<! DOCTYPE html > < html> < head> < metacharset = " utf-8" /> < title> </ title> < scripttype = " text/javascript" src = " https://cdn.jsdelivr.net/npm/echarts@5/dist/echarts.min.js" > </ script> < scriptsrc = " https://apps.bdimg.com/libs/jquery/2.1.4/jquery.min.js" > </ script> </ head> < body> < divid = " bar" style = " width : 1000px; height : 500px" > </ div> < scripttype = " text/javascript" >
let myBarChart = echarts. init ( document. getElementById ( 'bar' ) )
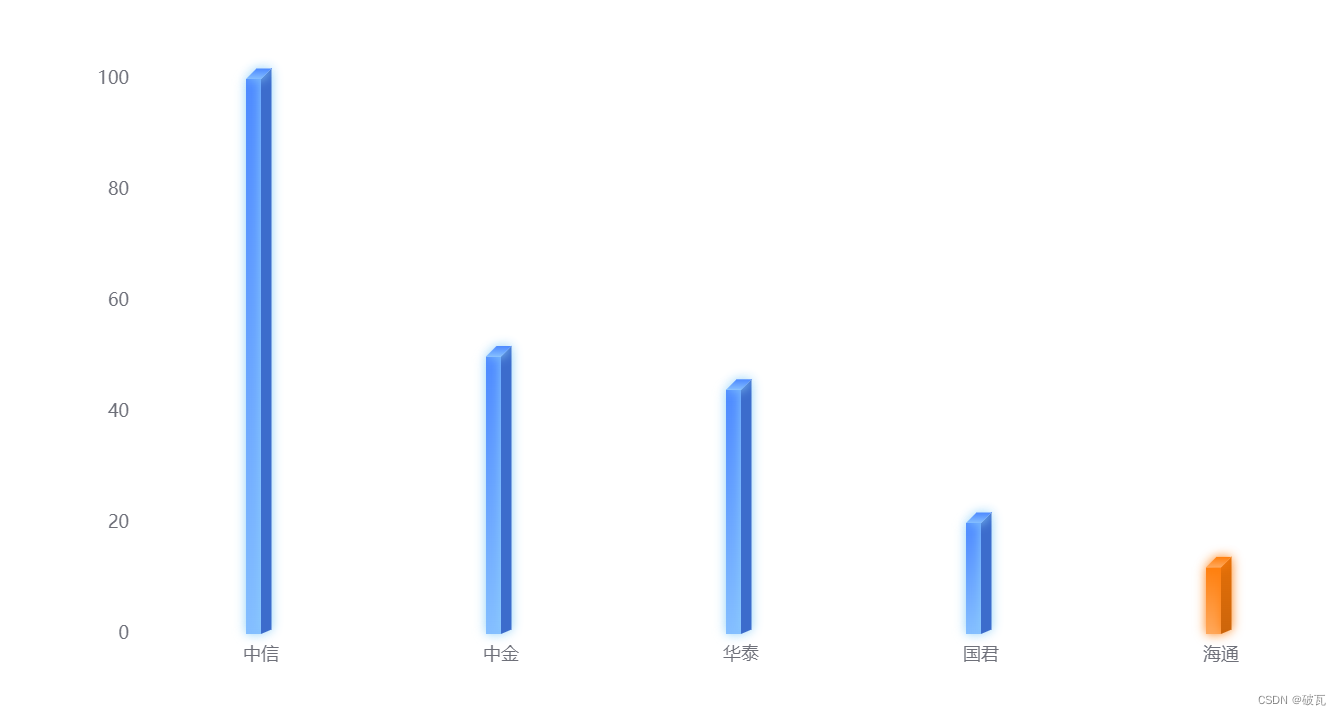
let seriesData1 = [
{
name : '国君' ,
value : 20 ,
} ,
{
name : '中信' ,
value : 100 ,
} ,
{
name : '中金' ,
value : 50 ,
} ,
{
name : '华泰' ,
value : 44 ,
} ,
{
name : '海通' ,
value : 12 ,
} ,
]
seriesData1. sort ( ( a, b ) => b. value - a. value)
console. log ( seriesData1)
let xData = [ ]
seriesData1. forEach ( ( item ) => {
xData. push ( item. name)
} )
let seriesData = [ ]
seriesData1. forEach ( ( item ) => {
seriesData. push ( item. value)
} )
let linearArr = [
'#4D89FF' ,
'#84BEFF' ,
'#3C6CCC' ,
'#FFA95D' ,
'#FF7F0E' ,
'#CC650B' ,
'#E46F07' ,
]
const offsetX = 10 ,
sliderWidth = 7 ,
offsetTick = 10
const CubeLeft = echarts. graphic. extendShape ( {
shape : {
x : 0 ,
y : 0 ,
} ,
buildPath : function ( ctx, shape ) {
const api = shape. api
const xAxisPoint = api. coord ( [ shape. xValue, 0 ] )
const c0 = [ shape. x - offsetTick, shape. y]
const c1 = [ shape. x - offsetTick + offsetX, shape. y]
const c2 = [ xAxisPoint[ 0 ] - offsetTick + offsetX, xAxisPoint[ 1 ] ]
const c3 = [ xAxisPoint[ 0 ] - offsetTick, xAxisPoint[ 1 ] ]
ctx
. moveTo ( c0[ 0 ] , c0[ 1 ] )
. lineTo ( c1[ 0 ] , c1[ 1 ] )
. lineTo ( c2[ 0 ] , c2[ 1 ] )
. lineTo ( c3[ 0 ] , c3[ 1 ] )
. closePath ( )
} ,
} )
const CubeRight = echarts. graphic. extendShape ( {
shape : {
x : 0 ,
y : 0 ,
} ,
buildPath : function ( ctx, shape ) {
const api = shape. api
const xAxisPoint = api. coord ( [ shape. xValue, 0 ] )
const c1 = [ shape. x - offsetTick + offsetX, shape. y]
const c2 = [
shape. x - offsetTick + offsetX + sliderWidth,
shape. y - sliderWidth,
]
const c3 = [
xAxisPoint[ 0 ] - offsetTick + offsetX + sliderWidth,
xAxisPoint[ 1 ] - sliderWidth + 4 ,
]
const c4 = [ shape. x - offsetTick + offsetX, xAxisPoint[ 1 ] ]
ctx
. moveTo ( c1[ 0 ] , c1[ 1 ] )
. lineTo ( c2[ 0 ] , c2[ 1 ] )
. lineTo ( c3[ 0 ] , c3[ 1 ] )
. lineTo ( c4[ 0 ] , c4[ 1 ] )
. closePath ( )
} ,
} )
const CubeTop = echarts. graphic. extendShape ( {
shape : {
x : 0 ,
y : 0 ,
} ,
buildPath : function ( ctx, shape ) {
const c1 = [ shape. x - offsetTick, shape. y]
const c2 = [ shape. x - offsetTick + offsetX, shape. y]
const c3 = [
shape. x - offsetTick + offsetX + sliderWidth,
shape. y - sliderWidth,
]
const c4 = [ shape. x - offsetTick + sliderWidth, shape. y - sliderWidth]
ctx
. moveTo ( c1[ 0 ] , c1[ 1 ] )
. lineTo ( c2[ 0 ] , c2[ 1 ] )
. lineTo ( c3[ 0 ] , c3[ 1 ] )
. lineTo ( c4[ 0 ] , c4[ 1 ] )
. lineTo ( c1[ 0 ] , c1[ 1 ] )
. closePath ( )
} ,
} )
echarts. graphic. registerShape ( 'CubeLeft' , CubeLeft)
echarts. graphic. registerShape ( 'CubeRight' , CubeRight)
echarts. graphic. registerShape ( 'CubeTop' , CubeTop)
option = {
xAxis : {
axisTick : {
show : false ,
} ,
axisLine : {
show : false ,
} ,
data : xData,
} ,
yAxis : {
type : 'value' ,
splitLine : {
show : false ,
} ,
} ,
series : [
{
type : 'custom' ,
data : seriesData,
itemStyle : {
shadowColor : '#000' ,
shadowBlur : 100 ,
} ,
renderItem : function ( params, api ) {
let location = api. coord ( [ api. value ( 0 ) , api. value ( 1 ) ] )
console. log ( seriesData[ params. dataIndex] )
return {
type : 'group' ,
children : [
{
type : 'CubeLeft' ,
shape : {
api,
xValue : api. value ( 0 ) ,
yValue : api. value ( 0 ) ,
x : location[ 0 ] ,
y : location[ 1 ] ,
} ,
style : {
shadowColor :
xData[ params. dataIndex] === '海通'
? '#FF7F0E'
: '#8DD0FA' ,
shadowOffsetX : 0 ,
shadowOffsetY : 0 ,
shadowBlur : 7 ,
fill : new echarts. graphic. LinearGradient ( 0 , 0 , 0 , 1 , [
{
offset : 0 ,
color :
xData[ params. dataIndex] === '海通'
? linearArr[ 4 ]
: linearArr[ 0 ] ,
} ,
{
offset : 1 ,
color :
xData[ params. dataIndex] === '海通'
? linearArr[ 3 ]
: linearArr[ 1 ] ,
} ,
] ) ,
} ,
} ,
{
type : 'CubeRight' ,
shape : {
api,
xValue : api. value ( 0 ) ,
yValue : api. value ( 1 ) ,
x : location[ 0 ] ,
y : location[ 1 ] ,
} ,
style : {
shadowColor :
xData[ params. dataIndex] === '海通'
? '#FF7F0E'
: '#8DD0FA' ,
shadowOffsetX : 0 ,
shadowOffsetY : 0 ,
shadowBlur : 7 ,
fill : new echarts. graphic. LinearGradient ( 0 , 0 , 0 , 1 , [
{
offset : 0 ,
color :
xData[ params. dataIndex] === '海通'
? linearArr[ 6 ]
: linearArr[ 2 ] ,
} ,
{
offset : 1 ,
color :
xData[ params. dataIndex] === '海通'
? linearArr[ 5 ]
: linearArr[ 2 ] ,
} ,
] ) ,
} ,
} ,
{
type : 'CubeTop' ,
shape : {
api,
xValue : api. value ( 0 ) ,
yValue : api. value ( 1 ) ,
x : location[ 0 ] ,
y : location[ 1 ] ,
} ,
style : {
shadowColor :
xData[ params. dataIndex] === '海通'
? '#FF7F0E'
: '#8DD0FA' ,
shadowOffsetX : 0 ,
shadowOffsetY : 0 ,
shadowBlur : 7 ,
fill : new echarts. graphic. LinearGradient ( 0 , 0 , 0 , 1 , [
{
offset : 0 ,
color :
xData[ params. dataIndex] === '海通'
? linearArr[ 4 ]
: linearArr[ 0 ] ,
} ,
{
offset : 1 ,
color :
xData[ params. dataIndex] === '海通'
? linearArr[ 3 ]
: linearArr[ 1 ] ,
} ,
] ) ,
} ,
} ,
] ,
}
} ,
} ,
] ,
}
myBarChart. setOption ( option)
</ script> </ body> </ html>





![[附源码]SSM计算机毕业设计江苏人才信息管理系统JAVA](https://img-blog.csdnimg.cn/1c7fc8ec1c0e407b9236562bf2abbe7f.png)

