echarts多折线按组分类控制显示隐藏

news2024/12/27 10:46:51

需求:目前有俩个组数组分别为sss和aaa,sss和aaa有4个属性,分别为温度、湿度、气压和ppm,根据不同的属性每组画出4条折现,结果应该为8条折现,每条折现颜色不一致,名称也不一致,时间也不一致,通过额外设置的按钮去控制每组的显示和隐藏

1.效果

2.主要代码和讲解

数据源格式如下:

        weatherData: [
                {
                    poi_code: 'sss',
                    time: '2024-10-01 14:14:14',
                    period_num: 230,
                    airpressure: 1020.3,
                    temperature: 30,
                    humidity: 29,
                    ppm: 7.13
                }
            ],

2.1 封装一个折线图

折线图上的数据示例我都有标注,只需要传一样的数据就可以实现了

<template>
    <!-- 折线图 -->
    <div :id="id" class="main" style="width: 100%; height: 100%"></div>
</template>

<script>
import * as echarts from 'echarts';
export default {
    props: ['sendOption', 'id'],
    mounted() {
        window.setTimeout(() => {
            this.play_echarts();
        }, 1000);
    },
    watch: {
        sendOption: {
            deep: true,
            handler() {
                this.play_echarts();
            }
        }
    },
    data() {
        return {
            myChart: null
        };
    },
    methods: {
        play_echarts() {
            let that = this;
            that.$nextTick((_) => {
                if (
                    //判断是否存在echarts实例化对象,如果存在则销毁
                    that.myChart != null &&
                    that.myChart != '' &&
                    that.myChart != undefined
                ) {
                    that.myChart.dispose();
                }
                // const pointName = that.sendOption.pointName;
                // const imei = that.sendOption.imei;
                // console.log(pointName, imei, "获取到的数据");
                let option = {
                    title: {
                        text: that.sendOption.title,
                        x: '20',
                        y: '-3', //"20",
                        textStyle: {
                            color: '#000',
                            fontFamily: 'Microsoft YaHei',
                            fontSize: '16'
                        }
                    },
                    tooltip: {
                        trigger: 'axis',
                        confine: true //限制tooltip在图表范围内展示
                    },
                    legend: {
                        data: that.sendOption.legend,
                        selected: that.sendOption.legendSelected[0]
                    },
                    grid: {
                        left: '3%',
                        right: '4%',
                        bottom: '6%',
                        top: '13%',
                        containLabel: true
                    },
                    toolbox: {
                        right: '10%',
                        // 自定义工具提示框
                        tooltip: {
                            show: true,
                            trigger: 'axis',
                            formatter: function (param) {
                                return '<div>' + param.title + '</div>';
                            }
                        },
                        // 隐藏工具标题
                        showTitle: false,
                        feature: {
                            // 保持图片
                            saveAsImage: {
                                type: 'png',
                                name: that.sendOption.title, //保存文件的名称
                                excludeComponents: ['toolbox'],
                                title: '下载为图片',
                                icon: 'path://M136.533333 0h750.933334c75.093333 0 136.533333 61.44 136.533333 136.533333v750.933334c0 75.093333-61.44 136.533333-136.533333 136.533333H136.533333c-75.093333 0-136.533333-61.44-136.533333-136.533333V136.533333C0 61.44 61.44 0 136.533333 0z m580.266667 409.6c54.613333 0 102.4-47.786667 102.4-102.4S771.413333 204.8 716.8 204.8 614.4 252.586667 614.4 307.2 662.186667 409.6 716.8 409.6z m-273.066667 266.24l-68.266666-109.226667c0-6.826667-6.826667-6.826667-13.653334-13.653333-20.48-6.826667-40.96-6.826667-47.786666 13.653333l-177.493334 273.066667v13.653333c0 20.48 13.653333 34.133333 34.133334 34.133334h696.32c13.653333 0 27.306667-13.653333 27.306666-27.306667 0-6.826667 0-13.653333-6.826666-13.653333l-150.186667-211.626667c-6.826667-13.653333-27.306667-13.653333-40.96-6.826667l-6.826667 6.826667-13.653333 13.653333-95.573333 150.186667c-13.653333 13.653333-34.133333 20.48-47.786667 6.826667-6.826667 0-6.826667-6.826667-6.826667-13.653334L443.733333 675.84z',
                                iconStyle: {
                                    color: '#409eff',
                                    borderColor: 'none'
                                }
                            }
                        }
                    },
                    xAxis: {
                        type: 'category',
                        boundaryGap: false,
                        data: that.sendOption.xAxis
                        // data: ['11-05 10:20:00', '11-05 10:21:00', '11-05 10:22:00']//示例代码
                    },
                    yAxis: {
                        type: 'value',
                        // min: yMin < 0 ? null : yMin,
                        // max: yMax,
                        // boundaryGap: true,
                        boundaryGap: [0.1, 1]
                        // max: function (value) {
                        //   if (value.max < 3) {
                        //     value.max = 3;
                        //   } else {
                        //     value.max = value.max;
                        //   }
                        //   return value.max;
                        // },
                        // boundaryGap: ["60%", "80%"],
                        // maxInterval: 30,
                    },
                    series: that.sendOption.seriesData
                    // 示例如下
                    // series: [
                    //     {
                    //         data: [
                    //             ['11-05 10:20:00', 14.06],
                    //             ['11-05 10:22:00', null]
                    //         ],
                    //         type: 'line',
                    //         name: 'sss',
                    //         smooth: true,
                    //         symbolSize: 6
                    //     },
                    //     {
                    //         data: [['11-05 10:21:00', 21.82]],
                    //         type: 'line',
                    //         name: 'aaa',
                    //         smooth: true,
                    //         symbolSize: 6
                    //     },
                    // ]
                };
                // 基于准备好的dom,初始化echarts实例
                that.myChart = echarts.init(document.querySelector(`#${that.id}`));
                window.addEventListener('resize', function () {
                    if (that.myChart) {
                        that.myChart.resize();
                    }
                });
                // 使用刚指定的配置项和数据显示图表。
                that.myChart.setOption(option);
            });
        },
        redraw() {
            // 使用刚指定的配置项和数据显示图表。
            that.myChart.setOption(option);
        }
    },
    beforeDestroy() {
        let that = this;
        if (!that.myChart) {
            return;
        }
        that.myChart.dispose();
        that.myChart = null;
    }
};
</script>

<style lang="scss" scoped>

</style>

 2.2 数据转换成折线图需要的数据

折线图封装完后引入页面需要传如下数据给折线图

            sendOptionTop: {
                title: '', //y轴标题
                seriesData: [], //主要数据
                xAxis: [], //点名称
                legend: [], //标题
                showTooltipLevel: true, //显示预警等级
                legendSelected: [] //控制显示隐藏
            },

 数据处理:把原始数据首先转换为分组的键值对

   // 根据poi_code对数据进行分组
            let groupedData = {};
            this.weatherData.forEach((item) => {
                // 判断当前poi_code是否存在groupedData中,以下是不存在的情况
                if (!groupedData[item.poi_code]) {
                    // 不存在则创建一个新的键值对
                    groupedData[item.poi_code] = {
                        times: [],
                        temperatures: [],
                        humidities: [],
                        airpressures: [],
                        ppms: []
                    };
                }
                groupedData[item.poi_code].times.push(item.time);
                groupedData[item.poi_code].temperatures.push([item.time || null, item.temperature || null]); // 处理null值
                groupedData[item.poi_code].humidities.push([item.time || null, item.humidity || null]);
                groupedData[item.poi_code].airpressures.push([item.time || null, item.airpressure || null]);
                groupedData[item.poi_code].ppms.push([item.time || null, item.ppm || null]);
            });
            console.log(groupedData, '组的数据-------');

转换后的效果如下, 一个组sss分别有4个单独的数据


 之后把键值对转换为数组,并且把sss添加到对应的值

        let echartsData = [];
            for (let code in groupedData) {
                echartsData.push({
                    name: code,
                    time: groupedData[code].times,
                    temperature: groupedData[code].temperatures,
                    humidity: groupedData[code].humidities,
                    airpressure: groupedData[code].airpressures,
                    ppm: groupedData[code].ppms
                });
            }
            console.log(echartsData, '');


 最后根据属性名进行匹配数据源,最终得到8条折现的数据

   let series = [];

            // 动态设置xAxis的data和series
            echartsData.forEach((data) => {
                // option.xAxis.data = data.time; // 设置x轴的时间数据(注意:这里可能需要根据实际情况调整,因为所有组的时间可能不一致)

                // 为每个poi_code创建一个series
                ['temperature', 'humidity', 'airpressure', 'ppm'].forEach((type) => {
                    series.push({
                        name: `${data.name} ${
                            type == 'temperature' ? '温度' : type == 'humidity' ? '湿度' : type == 'airpressure' ? '气压' : type
                        }`,
                        type: 'line',
                        smooth: true,
                        symbolSize: 6,
                        data: data[type]
                    });
                });
            });

注意这个name,name的值要在legend中

2.3按钮控制

按钮代码如下,只需要把title换成sss和aaa就行

  <div
                class="item"
                v-for="(item, index) in lineChartArr"
                :key="index"
                :class="{ isSelected: item.isSelect }"
                @click="handleLineFilter(item)"
            >
                <div
                    class="item-chunk"
                    :style="{
                        background: `${!item.isSelect ? item.color : '#e4e5e6'}`
                    }"
                ></div>
                <div class="item-title">{{ item.title }}</div>
            </div>

 点击按钮后和legend标签进行匹配,匹配成功就设置legendSelected,注意!不能直接改变legendSelected,不然没有响应只能通过一个变量selected来进行改变了

   handleLineFilter(code) {
            code.isSelect = !code.isSelect;
            this.sendOptionTop.legendSelected = [];
            let legendData = this.sendOptionTop.legend;
            for (let item of legendData) {
                // 检查当前元素是否包含 obj.title
                if (code.isSelect && item.indexOf(code.title) > -1) {
                    // 如果包含,则添加到 result 对象中,并设置值为 false
                    this.selected[item] = false;
                } else if (item.indexOf(code.title) > -1) {
                    this.selected[item] = true;
                }
            }
            this.lineChartArr.forEach((item) => {
                if (item.title === code.title) {
                    item.isSelect = code.isSelect;
                }
            });
            this.sendOptionTop.legendSelected.push(this.selected);
        }

匹配成功后的数据 ,这样就能让sss的组数据不选中了


3.完整代码

<template>
    <div class="box">
        <div class="top-item">
            <div
                class="item"
                v-for="(item, index) in lineChartArr"
                :key="index"
                :class="{ isSelected: item.isSelect }"
                @click="handleLineFilter(item)"
            >
                <div
                    class="item-chunk"
                    :style="{
                        background: `${!item.isSelect ? item.color : '#e4e5e6'}`
                    }"
                ></div>
                <div class="item-title">{{ item.title }}</div>
            </div>
        </div>

        <MultipleLineCharts id="zhexian02" :sendOption="sendOptionTop" />
    </div>
</template>

<script>
import MultipleLineCharts from '@/components/multipleLineCharts';
export default {
    components: {
        MultipleLineCharts
    },
    data() {
        return {
            lineChartArr: [
                {
                    color: '#8b8c8c', //'#DC143C',
                    title: 'sss',
                    isSelect: false
                },
                {
                    color: '#8b8c8c', //'#000000',
                    title: 'aa',
                    isSelect: false
                }
            ],
            weatherData: [
                {
                    poi_code: 'sss',
                    time: '2024-10-01 14:14:14',
                    period_num: 230,
                    airpressure: 1020.3,
                    temperature: 30,
                    humidity: 29,
                    ppm: 7.13
                },
                {
                    poi_code: 'sss',
                    time: '2024-10-02 13:14:14',
                    period_num: 527,
                    airpressure: null,
                    temperature: 1020.3,
                    humidity: 64,
                    ppm: 170
                },
                {
                    poi_code: 'sss',
                    time: '2024-10-03 14:14:14',
                    period_num: 528,
                    airpressure: null,
                    temperature: 756.3,
                    humidity: 65,
                    ppm: 53
                },
                {
                    poi_code: 'sss',
                    time: '2024-10-04 14:14:14',
                    period_num: 529,
                    airpressure: 54,
                    temperature: 1020.3,
                    humidity: null,
                    ppm: 0
                },
                {
                    poi_code: 'aaa',
                    time: '2024-10-02 13:14:14',
                    period_num: 527,
                    airpressure: 32,
                    temperature: 55,
                    humidity: null,
                    ppm: 0
                },
                {
                    poi_code: 'aaa',
                    time: '2024-10-05 11:14:14',
                    period_num: 122,
                    airpressure: 12,
                    temperature: 73,
                    humidity: 836,
                    ppm: 0
                },
                {
                    poi_code: 'aaa',
                    time: '2024-10-06 11:14:14',
                    period_num: 529,
                    airpressure: 1,
                    temperature: 23,
                    humidity: 55,
                    ppm: 1
                },
                {
                    poi_code: 'aaa',
                    time: '2024-10-07 06:14:14',
                    period_num: 530,
                    airpressure: 13,
                    temperature: 0,
                    humidity: 35,
                    ppm: 0
                },
                {
                    poi_code: 'aaa',
                    time: '2024-10-07 16:14:14',
                    period_num: 531,
                    airpressure: 33,
                    temperature: 32,
                    humidity: 62,
                    ppm: 0
                }
            ],
            sendOptionTop: {
                title: '', //y轴标题
                seriesData: [], //主要数据
                xAxis: [], //点名称
                legend: [], //标题
                showTooltipLevel: true, //显示预警等级
                legendSelected: [] //控制显示隐藏
            },
            selected: {}
        };
    },
    mounted() {
        this.queryWeather();
    },
    methods: {
        queryWeather() {
            // 根据poi_code对数据进行分组
            let groupedData = {};
            this.weatherData.forEach((item) => {
                // 判断当前poi_code是否存在groupedData中,以下是不存在的情况
                if (!groupedData[item.poi_code]) {
                    // 不存在则创建一个新的键值对
                    groupedData[item.poi_code] = {
                        times: [],
                        temperatures: [],
                        humidities: [],
                        airpressures: [],
                        ppms: []
                    };
                }
                groupedData[item.poi_code].times.push(item.time);
                groupedData[item.poi_code].temperatures.push([item.time || null, item.temperature || null]); // 处理null值
                groupedData[item.poi_code].humidities.push([item.time || null, item.humidity || null]);
                groupedData[item.poi_code].airpressures.push([item.time || null, item.airpressure || null]);
                groupedData[item.poi_code].ppms.push([item.time || null, item.ppm || null]);
            });
            console.log(groupedData, '组的数据-------');
            let echartsData = [];
            for (let code in groupedData) {
                echartsData.push({
                    name: code,
                    time: groupedData[code].times,
                    temperature: groupedData[code].temperatures,
                    humidity: groupedData[code].humidities,
                    airpressure: groupedData[code].airpressures,
                    ppm: groupedData[code].ppms
                });
            }
            console.log(echartsData, '');
            let series = [];

            // 动态设置xAxis的data和series
            echartsData.forEach((data) => {
                // option.xAxis.data = data.time; // 设置x轴的时间数据(注意:这里可能需要根据实际情况调整,因为所有组的时间可能不一致)

                // 为每个poi_code创建一个series
                ['temperature', 'humidity', 'airpressure', 'ppm'].forEach((type) => {
                    series.push({
                        name: `${data.name} ${
                            type == 'temperature' ? '温度' : type == 'humidity' ? '湿度' : type == 'airpressure' ? '气压' : type
                        }`,
                        type: 'line',
                        smooth: true,
                        symbolSize: 6,
                        data: data[type]
                    });
                });
            });
            console.log(series, 'series');

            let aa = this.weatherData.map((item) => item.time);
            this.sendOptionTop.xAxis = this.removeDuplicateDates(aa);
            this.sendOptionTop.seriesData = series;
            this.sendOptionTop.legend = this.sendOptionTop.seriesData.map((item) => item.name);
        },
        removeDuplicateDates(dates) {
            // 使用 Set 来自动去除重复项
            const uniqueDates = new Set(dates);
            // 将 Set 转换回 Array
            return Array.from(uniqueDates);
        },
        handleLineFilter(code) {
            code.isSelect = !code.isSelect;
            this.sendOptionTop.legendSelected = [];
            let legendData = this.sendOptionTop.legend;
            for (let item of legendData) {
                // 检查当前元素是否包含 obj.title
                if (code.isSelect && item.indexOf(code.title) > -1) {
                    // 如果包含,则添加到 result 对象中,并设置值为 false
                    this.selected[item] = false;
                } else if (item.indexOf(code.title) > -1) {
                    this.selected[item] = true;
                }
            }
            this.lineChartArr.forEach((item) => {
                if (item.title === code.title) {
                    item.isSelect = code.isSelect;
                }
            });
            console.log(this.sendOptionTop.legendSelected);
            this.sendOptionTop.legendSelected.push(this.selected);
        }
    }
};
</script>

<style lang="scss" scoped>
.box {
    height: 600px;
    width: 50%;
}
.top-item {
    width: 100%;
    display: flex;
    justify-content: center;
    margin: 40px 0px 20px;
    .item {
        display: flex;
        margin: 0 10px;
    }
}
.item-chunk {
    height: 13px;
    width: 26px;
    margin-top: 3px;
    margin-right: 5px;
}
</style>

文章到此结束,希望对你有所帮助~

本文来自互联网用户投稿,该文观点仅代表作者本人,不代表本站立场。本站仅提供信息存储空间服务,不拥有所有权,不承担相关法律责任。如若转载,请注明出处:http://www.coloradmin.cn/o/2205681.html

如若内容造成侵权/违法违规/事实不符,请联系多彩编程网进行投诉反馈,一经查实,立即删除!

相关文章

Overfrp内网穿透用例:使用域名部署穿透服务器以访问内网http/https服务

项目地址&#xff1a;https://github.com/sometiny/overfrp 使用overfrp部署穿透服务器&#xff0c;绑定域名后&#xff0c;可使用域名访问内网的http/https服务。 用例中穿透服务器和内网机器之间的访问全链路加密&#xff0c;具有ssh2相当的安全级别。&#xff01;&#xf…

软件测试的常用的面试题【带答案】

1. 请自我介绍一下(需简单清楚的表述自已的基本情况&#xff0c;在这过程中要展现出自信&#xff0c;对工作有激情&#xff0c;上进&#xff0c;好学) 面试官您好&#xff0c;我叫XXX&#xff0c;今年24岁&#xff0c;来自XX&#xff0c;就读专业是电子商务&#xff0c;毕业后就…

Spring18——Spring事务角色(事务管理员、事务协调员)

39-Spring事务角色 这部分我们重点要理解两个概念&#xff0c;分别是事务管理员和事务协调员。 当未开启Spring事务时 AccountDao的outMoney因为是修改操作&#xff0c;会开启一个事务T1 AccountDao的inMoney因为是修改操作&#xff0c;会开启一个事务T2AccountService的tr…

爬虫(反调试)

其实就是一种给页面反爬机制&#xff0c;一般页面用不到。 万能解决反调试方法&#xff1a;

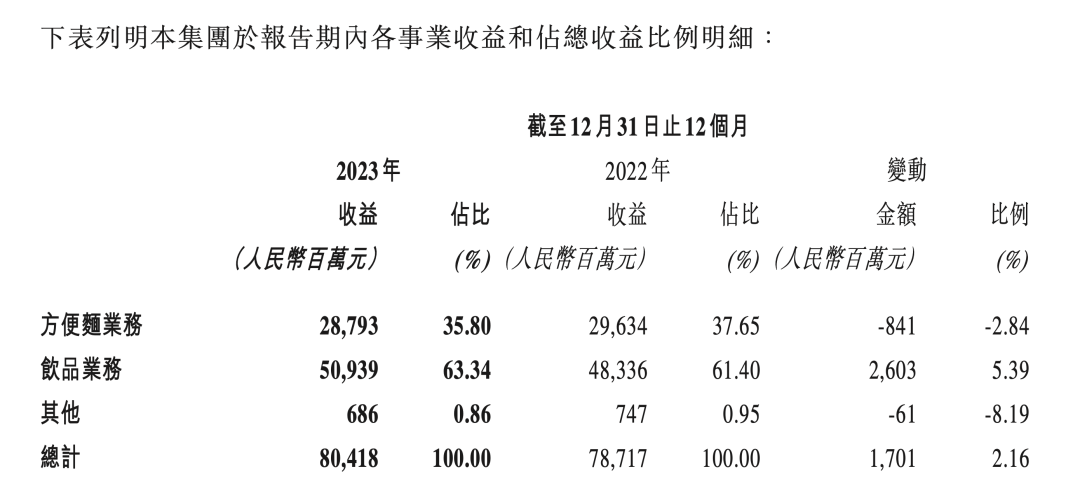
康师傅涨价背后:是自救还是失策?

涨价策略虽缓解成本压力&#xff0c;却可能导致消费者忠诚度下降&#xff0c;促使消费者转向竞品&#xff0c;加剧康师傅市场份额的流失。 转载&#xff1a;原创新熵 作者丨璐萱 编辑丨蕨影 康师傅方便面又双叒叕涨价了&#xff01; 今年5月份以来&#xff0c;在人们感叹买不…

C++与Rust那些事之跳过析构函数

C与Rust那些事之跳过析构函数 在Rust中mem::forget用于防止对象的析构&#xff0c;跳过清理工作&#xff0c;从而让资源的释放交给其他机制管理。 例如&#xff1a; let file File::open("foo.txt").unwrap(); mem::forget(file); 那么在C中如何防止析构&#xff1f…

滚柱导轨适配技巧与注意事项!

滚柱导轨是一种重要的传动元件&#xff0c;它由滚柱作为滚动体。用于连接机床的运动部件和床身基座&#xff0c;其设计旨在提供高承载能力和高刚度&#xff0c;适用于重型机床和精密仪器&#xff0c;而滚柱导轨的适配方法对于确保机械设备的高精度运行至关重要。 滚柱导轨的适配…

conda 创建虚拟环境 Anconda虚拟环境

1、创建虚拟python环境&#xff1a; 通过构建虚拟环境&#xff0c;可避免与其他人的软件版本冲突。 conda create -n name python2.x 例如创建名字为xgli的虚拟环境&#xff0c;python的版本为2.7.3&#xff0c;则命令为&#xff1a; conda create -n ia2024 python2.7&…

web基础-攻防世界

get-post 一、WP &#xff08;题目本质&#xff1a;get与post传参方法&#xff09; 用 GET 给后端传参的方法是&#xff1a;在?后跟变量名字&#xff0c;不同的变量之间用&隔开。例如&#xff0c;在 url 后添加/&#xff1f;a1 即可发送 get 请求。 利用 hackbar 进行…

DBMS-4 数据库存储

存储结构 一.表空间 1.概念&#xff1a;一张数据表在数据库空间中以一个表空间的形式存储。表空间由数据段、索引段、回滚段组成&#xff0c;分别记录一张表的不同信息。 2.层次信息 &#xff08;1&#xff09;一个表空间(TableSpace)由多个段(Segment)构成&#xff1b; &…

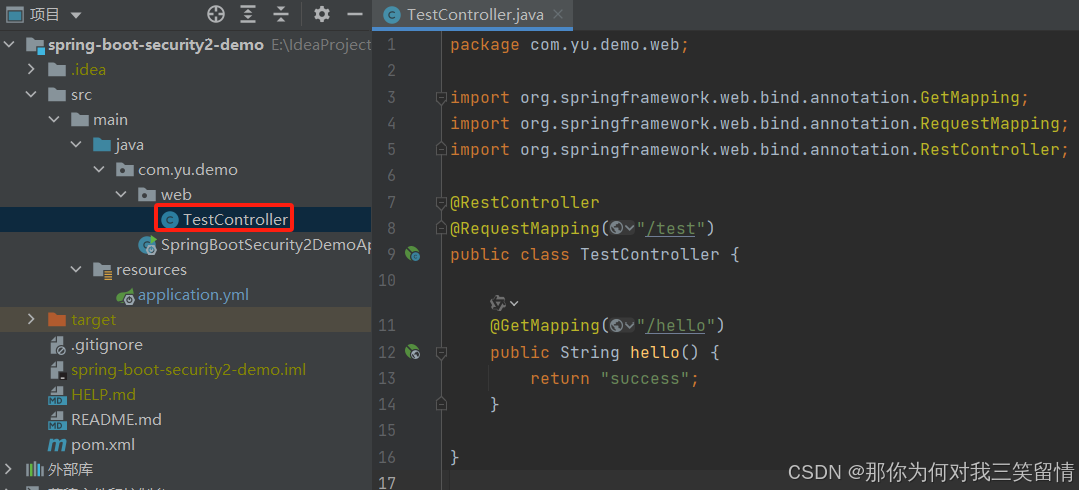
四、Spring Boot集成Spring Security之认证流程

Spring Boot集成Spring Security之认证流程 一、概要说明二、基于内存的用户名密码1、默认用户名密码2、自定义用户名密码3、为方便测试添加测试接口TestController 三、登录登出重要概念介绍四、登录业务逻辑1、登录业务相关过滤器2、访问业务请求处理流程①、访问业务请求地址…

AI核身-金融场景凭证篡改检测Baseline实践

金融领域交互式自证业务中涵盖信用成长、用户开户、商家入驻、职业认证、商户解限等多种应用场景&#xff0c;通常都需要用户提交一定的材料&#xff08;即凭证&#xff09;用于证明资产收入信息、身份信息、所有权信息、交易信息、资质信息等&#xff0c;而凭证的真实性一直是…

力扣19.删除链表的倒数第N个节点

题目链接&#xff1a;19. 删除链表的倒数第 N 个结点 - 力扣&#xff08;LeetCode&#xff09; 给你一个链表&#xff0c;删除链表的倒数第 n 个结点&#xff0c;并且返回链表的头结点。 示例 1&#xff1a; 输入&#xff1a;head [1,2,3,4,5], n 2输出&#xff1a;[1,2,3,…

【Linux调试工具】gdb/cgdb

文章目录 gdb 简介gdb 的主要功能 gdb的用法如何进入gdb显示代码如何运行程序如何打断点和取消断点逐语句调试逐行逐行执行代码&#xff08;s&#xff09;调试工具 总结 gdb 简介 GDB&#xff08;GNU Debugger&#xff09;是GNU项目中的一款强大的调试工具&#xff0c;广泛应用…

数字隔离器的技术竞争

长期以来&#xff0c;光耦合器一直被人们信赖&#xff0c;因为它能够在电路的不同部分之间提供电气隔离&#xff0c;确保信号的安全传输&#xff0c;同时保护元件免受高压影响。然而&#xff0c;近年来&#xff0c;数字隔离器已成为一种强大的替代品&#xff0c;在速度、寿命和…

Map的实现类:TreeMap

1.存储结构&#xff1a;红黑树 2.实现了SortedMap接口&#xff08;是Map的子接口&#xff09;&#xff0c;可以对key自动排序。 3.实例代码&#xff1a;Student类和Demo03 如果出现类转换异常 参考【TreeSet&#xff08;红黑树&#xff09;】 package com.map;import java…

苍穹外卖P19--异常处理

以上传数据库数据重复为例&#xff0c;进行异常处理。 接口文档报错&#xff1a; 重新启动&#xff1a;

Arduino中使用PS2手柄

目录 1、PS2手柄介绍 2、PS2库文件添加 3、Auduino代码 4、测试 5、测试程序和库文件下载连接 1、PS2手柄介绍 PS2手柄介绍见下面博客 STM32中使用PS2手柄_stm32 ps2-CSDN博客 PS2手柄按钮分布 2、PS2库文件添加 库文件和测试程序一起打包提供下载 3、Auduino代码 #in…

【数据结构】二叉堆一文详解,附demo

有时候也挺迷惑的&#xff0c;技术那么多&#xff0c;感觉学什么都来不及&#xff0c;又什么都得学&#xff0c;经常一看别人&#xff0c;哇&#xff0c;比你年轻比你厉害&#xff0c;然后自己emo一下又要鸡血模式&#xff0c;就挺无语的&#xff0c;但愿我们的坚持与努力都不白…

“炫我”受邀出席虚拟现实及元宇宙产业创新论坛!

当前&#xff0c;新一轮科技革命和产业变革向纵深演进&#xff0c;虚拟现实及元宇宙等相关产业加速发展&#xff0c;催生了新产业新业态新模式&#xff0c;发展潜力巨大、应用前景广阔。 9月27日&#xff0c;由北京市科学技术委员会、中关村科技园区管理委员会&#xff0c;北京…