【echarts】报错series.render is required.

news2024/11/16 21:39:08

总结:就是echarts无法保存renderItem函数到json里,因为renderItem是个封装方法,因此需要初始化加载时重新插入renderItem即可

1.描述:控制台报错series.render is required.

原数据json如下:

{
        type: "bar",
        coordinateSystem: "rightAngle-x", // 坐标系
        chartStyle: {
          width: 8,
          type: "",
          markPoint: {
            data: [
              {
                label: {
                  show: false,
                  position: "top",
                  color: "#00e6ff",
                  fontStyle: "normal",
                  fontWeight: "normal",
                  fontSize: "12",
                },
              },
              {
                label: {
                  show: false,
                  position: "top",
                  color: "#00e6ff",
                  fontStyle: "normal",
                  fontWeight: "normal",
                  fontSize: "12",
                },
              },
            ],
          },
        },
        option: {
          legend: {
            icon: "circle",
            show: true,
            itemWidth: 10,
            itemheight: 10,
            textStyle: {
              color: "#FFFFFF",
              fontStyle: "normal",
              fontWeight: "normal",
              fontSize: "12",
            },
            left: "left",
            top: "top",
          },
          title: [
            {
              text: "",
              textStyle: {
                color: "#FFFFFF",
                fontStyle: "normal",
                fontWeight: "normal",
                fontSize: "18",
              },
              left: "left",
            },
            {
              text: "",
              textStyle: {
                color: "#FFFFFF",
                fontStyle: "normal",
                fontWeight: "normal",
                fontSize: "14",
              },
              left: "left",
              top: "20",
            },
          ],
          tooltip: {
            trigger: "axis",
            axisPointer: {
              type: "line",
              lineStyle: {
                type: "dashed",
              },
            },
            backgroundColor: "transparent",
            borderWidth: 0,
            borderColor: "transparent",
            padding: 0,
            textStyle: {
              color: "#ffffff",
            },
            formatter: function (params) {
              var text = `<div style="width: 180px;height: 78px;backdrop-filter: blur(10px);background-color:#1A474266;
                          border-radius: 6px 6px 6px 6px;border: 1px solid #2c7d72FF;
                        ">
                                                <div style="margin:8px 0 10px 10px; font-size: 12px; display: flex; justify-content: space-between"><p> 数据:</p></div>
                                                <div style="margin:4px 0 9px 8px; padding:11px 10px 9px 9px;font-size: 12px;border-radius:4px;display: flex; justify-content: space-between;align-items: center;background: #1F7D7DE6;width: 164px;height: 28px;"><div style="display: flex; justify-content: space-between;"><div style="width: 10px;
                                                height: 10px;background: #3AFDF1;border-radius:50%;margin:5px 5px 0 0"></div><p>${params[0].name}</p></div>  <p>${params[0].value}</p></div>
                                            </div>`;
              return text;
            },
          },
          grid: {
            left: "3%",
            right: "3%",
            bottom: "3%",
            top: "48",
            containLabel: true,
          },
          xAxis: {
            type: "category",
            data: [],
            axisTick: {
              //刻度线
              show: false,
            },
            axisLine: {
              //轴线
              show: true,
              lineStyle: {
                color: "#ffffff",
                width: 1,
              },
            },
            axisLabel: {
              //轴标签
              show: true,
              color: "#FFFFFF",
              fontStyle: "normal",
              fontWeight: "normal",
              fontSize: "12",
              interval: "auto",
              rotate: 0,
            },
            splitLine: {
              //网格线
              show: false,
              lineStyle: {
                color: "#33333333",
                type: "dashed",
              },
            },
          },
          yAxis: {
            type: "value",
            axisTick: {
              //刻度线
              show: false,
            },
            axisLine: {
              //轴线
              show: false,
              lineStyle: {
                color: "#35404e",
                width: 2,
              },
            },
            axisLabel: {
              //轴标签
              show: true,
              color: "#FFFFFF",
              fontStyle: "normal",
              fontWeight: "normal",
              fontSize: "12",
            },
            splitLine: {
              //网格线
              show: false,
              lineStyle: {
                color: "#33333333",
                type: "dashed",
              },
            },
          },
          series: [
            {
              type: "custom",
              renderItem: function (params, api) {
                const location = api.coord([api.value(0), api.value(1)]);
                return {
                  type: "group",
                  children: [
                    {
                      type: "CubeLeft",
                      shape: {
                        x: location[0],
                        y: location[1],
                        xAxisPoint: api.coord([api.value(0), 0]),
                      },
                      style: {
                        fill: "#124340FF",
                      },
                    },
                    {
                      type: "CubeRight",
                      shape: {
                        x: location[0],
                        y: location[1],
                        xAxisPoint: api.coord([api.value(0), 0]),
                      },
                      style: {
                        fill: "#155049FF",
                      },
                    },
                    {
                      type: "CubeTop",
                      shape: {
                        x: location[0],
                        y: location[1],
                        xAxisPoint: api.coord([api.value(0), 0]),
                      },
                      style: {
                        fill: "#135146FF",
                      },
                    },
                  ],
                };
              },
              data: [],
              markPoint: {
                data: [
                  {
                    type: "max",
                    component: "最大值",
                    symbolSize: 0,
                    label: {
                      show: false,
                      position: "top",
                      color: "#00e6ff",
                      fontStyle: "normal",
                      fontWeight: "normal",
                      fontSize: "12",
                    },
                  },
                  {
                    type: "min",
                    component: "最小值",
                    symbolSize: 0,
                    label: {
                      show: false,
                      position: "top",
                      color: "#00e6ff",
                      fontStyle: "normal",
                      fontWeight: "normal",
                      fontSize: "12",
                    },
                  },
                ],
              },
            },
            {
              type: "custom",
              markPoint: {
                data: [
                  {
                    type: "max",
                    component: "最大值",
                    symbolSize: 0,
                    label: {
                      show: false,
                      position: "top",
                      color: "#00e6ff",
                      fontStyle: "normal",
                      fontWeight: "normal",
                      fontSize: "12",
                    },
                  },
                  {
                    type: "min",
                    component: "最小值",
                    symbolSize: 0,
                    label: {
                      show: false,
                      position: "top",
                      color: "#00e6ff",
                      fontStyle: "normal",
                      fontWeight: "normal",
                      fontSize: "12",
                    },
                  },
                ],
              },
              renderItem: (params, api) => {
                const location = api.coord([api.value(0), api.value(1)]);
                return {
                  type: "group",
                  children: [
                    {
                      type: "CubeLeft",
                      shape: {
                        x: location[0],
                        y: location[1],
                        xAxisPoint: api.coord([api.value(0), 0]),
                      },
                      style: {
                        fill: "#3CB0B7FF",
                      },
                    },
                    {
                      type: "CubeRight",
                      shape: {
                        x: location[0],
                        y: location[1],
                        xAxisPoint: api.coord([api.value(0), 0]),
                      },
                      style: {
                        fill: "#4EFCDDFF",
                      },
                    },
                    {
                      type: "CubeTop",
                      shape: {
                        x: location[0],
                        y: location[1],
                        xAxisPoint: api.coord([api.value(0), 0]),
                      },
                      style: {
                        fill: "#3AFDCEFF",
                      },
                    },
                  ],
                };
              },
              data: [],
            },
          ],
        },
      }

**

2.重点问题出在这里

因为renderItem是函数当保存为json后,renderItem会丢失

**

renderItem: (params, api) => {
                const location = api.coord([api.value(0), api.value(1)]);
                return {
                  type: "group",
                  children: [
                    {
                      type: "CubeLeft",
                      shape: {
                        x: location[0],
                        y: location[1],
                        xAxisPoint: api.coord([api.value(0), 0]),
                      },
                      style: {
                        fill: "#3CB0B7FF",
                      },
                    },
                    {
                      type: "CubeRight",
                      shape: {
                        x: location[0],
                        y: location[1],
                        xAxisPoint: api.coord([api.value(0), 0]),
                      },
                      style: {
                        fill: "#4EFCDDFF",
                      },
                    },
                    {
                      type: "CubeTop",
                      shape: {
                        x: location[0],
                        y: location[1],
                        xAxisPoint: api.coord([api.value(0), 0]),
                      },
                      style: {
                        fill: "#3AFDCEFF",
                      },
                    },
                  ],
                };
              },

3.解决办法

在created()或mounted()生命周期时,需要对保存的json数据再次特殊处理,对option.series数组里再次插入renderItem函数!

    const renderItem1 = (params, api) => {
        const location = api.coord([api.value(0), api.value(1)]);
        return {
          type: "group",
          children: [
            {
              type: "CubeLeft",
              shape: {
                x: location[0],
                y: location[1],
                xAxisPoint: api.coord([api.value(0), 0]),
              },
              style: {
                fill: "#124340FF",
              },
            },
            {
              type: "CubeRight",
              shape: {
                x: location[0],
                y: location[1],
                xAxisPoint: api.coord([api.value(0), 0]),
              },
              style: {
                fill: "#155049FF",
              },
            },
            {
              type: "CubeTop",
              shape: {
                x: location[0],
                y: location[1],
                xAxisPoint: api.coord([api.value(0), 0]),
              },
              style: {
                fill: "#135146FF",
              },
            },
          ],
        };
      };
      const renderItem2 = (params, api) => {
        const location = api.coord([api.value(0), api.value(1)]);
        return {
          type: "group",
          children: [
            {
              type: "CubeLeft",
              shape: {
                x: location[0],
                y: location[1],
                xAxisPoint: api.coord([api.value(0), 0]),
              },
              style: {
                fill: "#3CB0B7FF",
              },
            },
            {
              type: "CubeRight",
              shape: {
                x: location[0],
                y: location[1],
                xAxisPoint: api.coord([api.value(0), 0]),
              },
              style: {
                fill: "#4EFCDDFF",
              },
            },
            {
              type: "CubeTop",
              shape: {
                x: location[0],
                y: location[1],
                xAxisPoint: api.coord([api.value(0), 0]),
              },
              style: {
                fill: "#3AFDCEFF",
              },
            },
          ],
        };
      };
      option.series[0].renderItem = renderItem1;
      option.series[1].renderItem = renderItem2;
      //渲染tooltip
 const formatter = (params) => {
        var text = `<div style="width: 180px;height: 78px;backdrop-filter: blur(10px);background-color:#1A474266;
                          border-radius: 6px 6px 6px 6px;border: 1px solid #2c7d72FF;
                        ">
                                                <div style="margin:8px 0 10px 10px; font-size: 12px; display: flex; justify-content: space-between"><p> 数据:</p></div>
                                                <div style="margin:4px 0 9px 8px; padding:11px 10px 9px 9px;font-size: 12px;border-radius:4px;display: flex; justify-content: space-between;align-items: center;background: #1F7D7DE6;width: 164px;height: 28px;"><div style="display: flex; justify-content: space-between;"><div style="width: 10px;
                                                height: 10px;background: #3AFDF1;border-radius:50%;margin:5px 5px 0 0"></div><p>${params[0].name}</p></div>  <p>${params[0].value}</p></div>
                                            </div>`;
        return text;
      };
      option.tooltip.formatter = formatter;

在这里插入图片描述

本文来自互联网用户投稿,该文观点仅代表作者本人,不代表本站立场。本站仅提供信息存储空间服务,不拥有所有权,不承担相关法律责任。如若转载,请注明出处:http://www.coloradmin.cn/o/2170044.html

如若内容造成侵权/违法违规/事实不符,请联系多彩编程网进行投诉反馈,一经查实,立即删除!

相关文章

【数学分析笔记】第3章第4节闭区间上的连续函数(2)

3. 函数极限与连续函数 3.4 闭区间上的连续函数 3.4.4 中间值定理 【定理3.4.4】若 f ( x ) f(x) f(x)在 [ a , b ] [a,b] [a,b]上连续&#xff0c;则它一定能取到最大值 M M M与最小值 m m m之间的任何一个值。 M max ⁡ f ( x ) , x ∈ [ a , b ] , m min ⁡ f ( x ) , …

Vmware 静态ip配置

虚拟机网络设置NAT 查看当前的网络接口 ip addr编辑网络接口配置文件 sudo vi /etc/sysconfig/network-scripts/ifcfg-<接口名>配置静态 IP 地址 Vmware ➡ 编辑 ➡ 虚拟网络编辑器 ➡ Nat设置 参考上图进行配置&#xff0c;千万不要配置宿主机的配置 BOOTPROTOstat…

2023_Spark_实验十一:RDD基础算子操作

一、RDD的练习可以使用两种方式 使用Shell使用IDEA 二、使用Shell练习RDD 当你打开 Spark 的交互式命令行界面&#xff08;也就是 Spark shell&#xff09;的时候&#xff0c;它已经自动为你准备好了一个叫做 sc 的特殊对象&#xff0c;这个对象是用来和 Spark 集群沟通的。你…

女性在网络安全行业崛起,引领行业新风向

1、网络安全自诞生之日起&#xff0c;就与女性有着不解之缘。 ●二战期间&#xff0c;美国雇佣了1万名女性作为“密码女孩”来破译日本人和德国人发送的密信。 ●英国同样雇用了7000多名女性在英国密码分析中心工作&#xff0c;约占全部工作人员的四分之三。 ●世界上的第一…

108.游戏安全项目:信息显示二-剑侠情缘基址分析

免责声明&#xff1a;内容仅供学习参考&#xff0c;请合法利用知识&#xff0c;禁止进行违法犯罪活动&#xff01; 内容参考于&#xff1a;易道云信息技术研究院 本人写的内容纯属胡编乱造&#xff0c;全都是合成造假&#xff0c;仅仅只是为了娱乐&#xff0c;请不要盲目相信…

spring-boot web + vue

依赖的软件 maven 1. 官网下载zip 文件&#xff0c;比如apache-maven-3.9.9-bin.zip 2. 解压到某个盘符&#xff0c;必须保证父亲目录的名字包含英文&#xff0c;数字&#xff0c;破折号&#xff08;-&#xff09; 3. 设置环境变量M2_HOME, 并将%M2_HOME%\bin添加到windown…

openpnp - 散料飞达不要想着做万能版本,能够贴合现有的物料就好

文章目录 openpnp - 散料飞达不要想着做万能版本&#xff0c;能够贴合现有的物料就好概述笔记天真的版本改进的版本物料编带标准物料编带的样式对于散料飞达关心的尺寸不同编带宽度的散料飞达关键尺寸的列表8mm物料编带12mm物料编带16mm物料编带24mm物料编带32mm物料编带44mm物…

【Linux】环境变量(初步认识环境变量)

文章目录 1. 环境变量1.1 基本概念 2. 认识常见环境变量2.1 PATH2.2 HOME2.3 SHELL2.4 PWD2.5 USER 3. 理解环境变量 1. 环境变量 在main函数的命令行参数中&#xff0c;有argc、argv、env三个参数。 argc&#xff1a;命令函参数的个数argc&#xff1a;存放每个参数的具体数值…

FPGA学习(1)-mux2,2选1多路器

目录 1 开发板配套资料 1.1学习网址和资料网址 2.创建工程文件 2.1创建过程 2.2写程序及仿真测试 2.2.1 写程序生成电路 2.2.2仿真 2.2.3 生成执行文件并烧录 3.实验现象 买的小梅哥店铺的开发板&#xff1a;xc7z020clg400 看的小梅哥的视频&#xff1a;03C _基于ZYN…

提取出散射矩阵归一化相位的含义

散射矩阵的值是从图像中获得的&#xff0c;相位角是距离导致的&#xff0c;所以要归一化&#xff0c;VV/HH VV幅度/HH幅度。 VV相位-HH相位

Java-数据结构-Map与Set-(一) ٩(๑>◡<๑)۶

文本目录&#xff1a; ❄️一、搜索树&#xff1a; ☑ 1、概念&#xff1a; ☑ 2、操作-插入&#xff1a; 代码&#xff1a; ☑ 3、操作-查看&#xff1a; 代码&#xff1a; ☑ 4、操作-删除&#xff1a; 代码&#xff1a; ☑ 5、性能分析&#xff1a; ❄️二、搜索&#…

如何在Ubuntu上查看和刷新DNS缓存

DNS缓存是用于DNS查找的临时存储系统&#xff0c;负责将域名转换为IP地址。进行DNS查询时&#xff0c;系统会检查缓存中的相关信息。如果找到了&#xff0c;那么它会加速域名解析的过程。如果DNS缓存中的数据过时或不正确&#xff0c;则需刷新它以确保使用正确的信息。本文主要…

自己掏耳朵怎么弄干净?双十一必买的四大可视挖耳勺分享

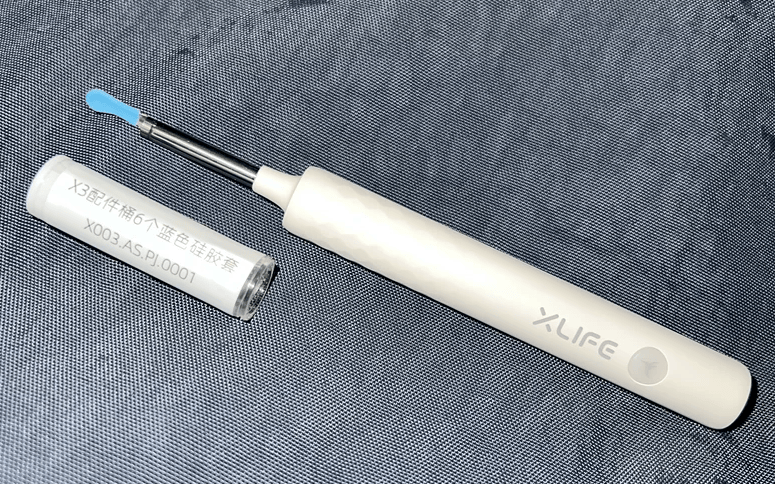
我们在掏耳朵时是不是老是觉得要么掏不干净&#xff0c;要么太进去了弄到痛耳朵。因为耳道属于我们一个盲区&#xff0c;在使用棉签或者普通耳勺容易因为操作不当弄伤耳膜。可能还会照成不可逆的后果。所以自己在掏耳勺更加推荐大家使用可视挖耳勺会更加干净和安全。那么&#…

【MATLAB代码】二维环境下的RSSI定位程序,自适应锚点数量,带图像输出、坐标输出、中文注释

程序描述 MATLAB编写的RSSI定位程序&#xff0c;自适应锚点数量&#xff0c;带图像输出、坐标输出、中文注释。 功能概述&#xff1a; 本程序实现了在二维平面上通过接收信号强度指示&#xff08;RSSI&#xff09;进行定位的功能。它使用多个锚节点的信号强度测量来估计未知…

CSS链接

链接是网站的重要组成部分&#xff0c;几乎在每个网页上都能看到不少的链接&#xff0c;合理的设计链接的样式能够给网页的颜值加分。链接有四种不同的状态&#xff0c;分别是 link、visited、active 和 hover&#xff0c;可以通过以下伪类选择器来为链接的四种状态设置不同的样…

CentOS8使用chrony同步网络时间

文章目录 引言I CentOS8使用chrony网络时间同步安装chrony配置间同步服务器地址检查本机的时区设置时区chronyc命令II windows网络时间同步2.1 修改同步服务器2.2 修改同步频率引言 应用场景: 获取服务器时间进行船舶在线率统计 dtos.forEach(item -> {if(item.getDwtime(…

红绿灯倒计时读秒数字识别系统源码分享

红绿灯倒计时读秒数字识别检测系统源码分享 [一条龙教学YOLOV8标注好的数据集一键训练_70全套改进创新点发刊_Web前端展示] 1.研究背景与意义 项目参考AAAI Association for the Advancement of Artificial Intelligence 项目来源AACV Association for the Advancement of …

数据结构——初识树和二叉树

线性结构是一对一的关系&#xff0c;意思就是只有唯一的前驱和唯一的后继&#xff1b; 非线性结构&#xff0c;如树形结构&#xff0c;它可以有多个后继&#xff0c;但只有一个前驱&#xff1b;图形结构&#xff0c;它可以有多个前驱&#xff0c;也可以有多个后继。 树的定义…

kubeadm部署k8s集群,版本1.23.6;并设置calico网络BGP模式通信,版本v3.25--未完待续

1.集群环境创建 三台虚拟机&#xff0c;一台master节点&#xff0c;两台node节点 (根据官网我们知道k8s 1.24版本之后就需要额外地安装cri-dockerd作为桥接才能使用Docker Egine。经过尝试1.24后的版本麻烦事很多&#xff0c;所以此处我们选择1.23.6版本) 虚拟机环境创建参考…

【LeetCode】动态规划—63. 不同路径 II(附完整Python/C++代码)

动态规划—63. 不同路径 II 前言题目描述基本思路1. 问题定义:2. 理解问题和递推关系:3. 解决方法:3.1 动态规划方法3.2 空间优化的动态规划 4. 进一步优化:5. 小总结: 代码实现Python3代码实现Python 代码解释C代码实现C 代码解释 总结: 前言 本文将探讨“不同路径 II”这一问…