-
1.效果展示,如图,tooltip的构成是指标名+实际值+【目标值】

-
2.后端的数据结构

-
3.完整代码:主要就是将需要展示的字段数据拼好放到tooltipInfo里
    initLeftEcharts() {
      const now = new Date();
      const year = now.getFullYear();
      const month = (now.getMonth() + 1).toString().padStart(2, '0');
      let param = {statsDimCd:"mon",dtMon:year+"-"+month}
      const xAxisData = [];
      const yAxisData = [];
      const tooltipData = [];

      myApi.dailyQueryMon(param).then(response=>{
           response.forEach(fr=>{
             xAxisData.push(fr.proLineName)
             let yData = [];
             let toolData = [];
             fr.matterVoList.forEach(se=>{
               if(se.retValue!=='0.0'&&se.retValue!==null){
                 yData.push(se.retValue)
                 toolData.push({
                   indicatorName: se.indicatorName,
                   retValue: se.retValue,
                   indicatorTarget: se.indicatorTarget
                 });
               }
             })
             yAxisData.push(yData);
             if(toolData.length>0){
               tooltipData.push(toolData);
             }else{
               tooltipData.push({
                 indicatorName: "无数据",
                 retValue: 0,
                 indicatorTarget: "无数据"
               });
             }
           })
        const leftEcharts = echarts.init(this.$refs.left);

        const seriesData = xAxisData
          .map((workshop, index) => {
            return yAxisData[index].map((cpk, idx) => ({
              name: workshop,
              value: [workshop, cpk],
              itemStyle: { color: `hsl(${index * 30}, 70%, 50%)` }, // 通过颜色区分不同车间
              tooltipInfo: tooltipData[index][idx] // 保存对应的tooltip数据
            }));
          })
          .flat();


        const option = {
          grid:{
            right:"5%"
          },
          title: {
            text: "关键质量指标监控",
            left: "center",
            textStyle: {
              color: "#A6CEE1",
            },
            top: 10,
          },
          tooltip: {
            trigger: "axis",
            showDelay: 0,
            formatter: function (params) {
              if (params.length > 0) {
                let tooltipStr = "";
                params.forEach(e => {
                  const info = e.data.tooltipInfo;
                  tooltipStr += `
        <div style="margin-bottom: 5px;">
          <span style="font-weight: bold; color: #A6CEE1;">${info.indicatorName}:</span>
          <span style="color: red;">${info.retValue}</span>
          <span style="color: green;">【${info.indicatorTarget}】</span><br/>
        </div>`;
                });
                return tooltipStr;
              } else {
                return 'No data available';
              }
            }
          },
          xAxis: {
            type: "category",
            data: xAxisData,
            axisLabel: {
              rotate: 30,
              show: true,
              textStyle: {
                color: "#A6CEE1",
              },
            },
          },
          yAxis: [
            {
              type: "value",
              name: "合格率(%)",
              min: 0,
              max: 100,
              axisLabel: {
                margin: 20,
                textStyle: {
                  color: "white",
                  margin: 15,
                },
              },
              nameTextStyle:{
                color:"white"
              }
            },
          ],
          series: [
            {
              type: "scatter",
              data: seriesData,
              itemStyle: {
                color: "#A6CEE1",
              },
            },
          ],
        };

        leftEcharts.setOption(option);
      })
    },
Echarts 散点图的 tooltip 自定义formatter方法(展示X、Y、value之外的数据)
news2026/2/11 22:36:09
本文来自互联网用户投稿,该文观点仅代表作者本人,不代表本站立场。本站仅提供信息存储空间服务,不拥有所有权,不承担相关法律责任。如若转载,请注明出处:http://www.coloradmin.cn/o/2066992.html
如若内容造成侵权/违法违规/事实不符,请联系多彩编程网进行投诉反馈,一经查实,立即删除!相关文章

oracle共享池(shared pool):一、工作原理、组成部分 二、软硬解析过程
文章目录 oracle整体结构图共享池(shared pool)shared pool的作用shared pool的组成查询 shared pool 各组成部分大小硬解析和软解析 oracle整体结构图 共享池(shared pool)
shared pool的作用
1、 将 sql 语句解析成执行计划
…

统一服务入口-Gateway(一)
目录
1.网关介绍
1.1含有问题
1.2什么是API网关
网关核心功能:
2.Spring Cloud Gateway
2.1什么是Spring Cloud Gateway
2.2快速上手
2.2.1创建网关项目
2.2.2引入网关依赖
2.2.3添加Gateway的路由配置
2.2.4测试
2.3Predicate
2.3.1Predicate的其他写…
![[数据集][目标检测]电力场景红外图像输电线路绝缘子检测数据集VOC+YOLO格式1846张1类别](https://i-blog.csdnimg.cn/direct/00ad5d0e0a9b44a6b207fd68e92ed2f2.png)
[数据集][目标检测]电力场景红外图像输电线路绝缘子检测数据集VOC+YOLO格式1846张1类别
数据集格式:Pascal VOC格式YOLO格式(不包含分割路径的txt文件,仅仅包含jpg图片以及对应的VOC格式xml文件和yolo格式txt文件) 图片数量(jpg文件个数):1846 标注数量(xml文件个数):1846 标注数量(txt文件个数):1846 标注…

《大模型应用开发极简入门》-当有了一个大模型,你需要知道的几件事情
从某种意义上来说,大模型(LLM-Large language model)也是一个任人打扮的小姑娘,你可以对她进行课程教学(即微调)、可以告诉她一些问题的应对办法(即提示工程)、还可以带上一部计算器…

(2024,ReLU-Transformer,样条,Veronese 映射,Pierce–Birkhoff 猜想)注意力机制是平滑的三次样条
Attention is a smoothed cubic spline 目录
0. 摘要和简介
0.1. 通过样条理解 Transformer
1. Transformer 的数学描述
1.9. ReLU-Transformer
2. 样条(Spline)
2.1. 标量值样条
2.2. 向量值样条
2.3. 矩阵值样条
2.4. Pierce–Birkhoff 猜想…

大杂烩!注意力机制+时空特征融合!组合模型集成学习预测!CNN-LSTM-Attention-Adaboost多变量负荷预测
大杂烩!注意力机制时空特征融合!组合模型集成学习预测!CNN-LSTM-Attention-Adaboost多变量负荷预测 目录 大杂烩!注意力机制时空特征融合!组合模型集成学习预测!CNN-LSTM-Attention-Adaboost多变量负荷预测…

AI大模型开发——7.百度千帆大模型调用
本节旨在为读者提供一个实用指南,探讨如何有效地利用百度千帆大模型平台的强大功能。从基础的账号注册和密钥申请入手,逐步引领用户通过案例, 理解并掌握如何调用文本和图像处理的大模型 API, 包括但不限于 NLP、对话生成、文本续…

linux中对.jar文件的配置文件进行修改
linux中对.jar文件的配置文件进行修改
第一步,进入你的.jar的当前文件夹 第二步 ,编辑你指定的 .jar 文件
编辑之前请先备份 cp xxx.jar xxx-1.2.jar
输入编辑命令
vim xxx.jar第三步,找到你要编辑的文件 输入命令进入vi模式(…

Python(TensorFlow)多模光纤光束算法和GPU并行模拟
🎯要点
🎯多模光纤包含光学系统线性和非线性部分 | 🎯单变量线性回归、多变量线性回归、人脸图像年龄预测、音频语音分类和 X 射线图像评估算法 | 🎯在空间光调制器记录海螺参数矩阵,光束算法多变量预测年龄 | &#…

pytorch训练后pt模型中保存内容详解(yolov8n.pt为例)
在 PyTorch 中,.pt 模型文件通常包含以下几类数据: 模型参数: 存储模型的权重和偏置参数。 优化器状态: 包含优化器的状态信息,以便在恢复训练时能够从中断的地方继续。 训练状态: 一些训练过程中的信息&am…

SpringBoot的自动配置原理探究
目录
什么是SpringBoot的自动配置(Auto-Configuration)
举例:SpringBoot自动配置(Redis的自动配置)的实例:
步骤1.:引入Redis启动器pom依赖
步骤2.在application.yml或者(proper…

火狐浏览器应用商店不支持下载
前言
之前手机一直用的火狐浏览器,现在换了新的手机,又想下载使用,从官网直接下载现在直接跳载到Google Play才能下载,但是国内又用不了的,这里就记录一下怎么在手机应用商店不支持情况下载。
从FTP服务器下载Beta版…

C++学习笔记----4、用C++进行程序设计(四)---- 复合关系与继承关系之间的细线
在现实世界只是很容易区分对象之间是复合关系还是继承关系。没有人会说桔子有一个水果--而只能是桔子是一种水果。但是,在代码中,有时候就不是那么清晰了。 设想有一个代表关联数组的假想类,将一个键影射到一个值的数据结构。例如,…

python画图高斯平滑均值曲线
注:细线是具体值,粗线是高斯平滑处理后的均值曲线
#codinggbk
import matplotlib.pyplot as plt
import numpy as np
from scipy.ndimage import gaussian_filter1d# 生成一些示例数据
np.random.seed(0)
timesteps np.linspace(1000, 0, 1000)
data 0.4 0.2 * np.random.r…

并查集(路径压缩、按秩合并、按大小合并)
文章目录 并查集简单介绍:初始化:如何查找?如何合并?优化如下:路径压缩:代码: 按秩合并:**代码:** 启发式合并(按大小合并):代码: 例题…
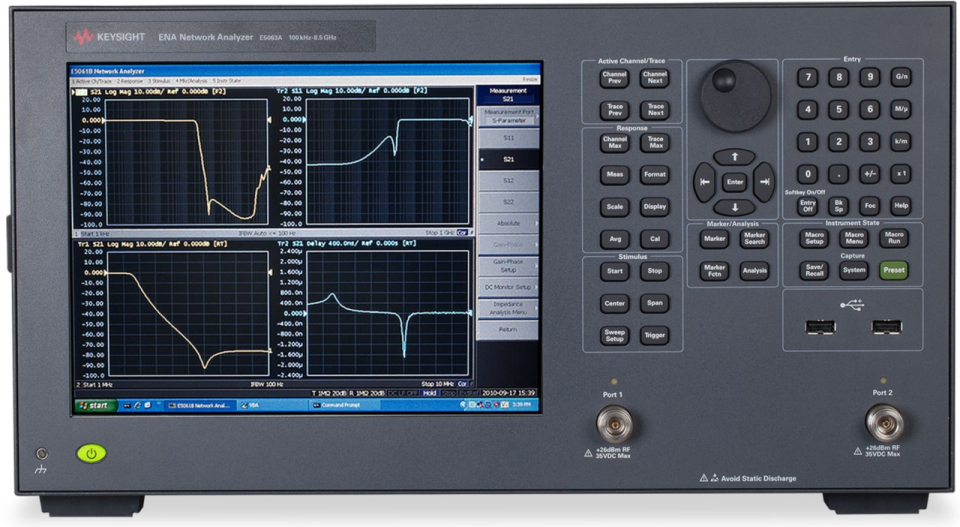
E5063A-011 时域分析/测试向导程序
矢量网络分析
E5063A 选件 011
E5063A-011
时域分析/测试向导程序 不容错过! 概述 Keysight E5063A ENA 系列 PCB 分析仪是较佳的 PCB 生产测试解决方案,可提供阻抗(TDR)和回波损耗(S 参数)测量能力。…

11091 最优自然数分解问题(优先做)
### 简短思路
#### 问题(1):将n分解为若干个互不相同的自然数之和,且使这些自然数的乘积最大 1. 对于n < 4的情况,直接返回特定值。 2. 对于n > 4的情况,使用贪心策略,将n分解为从2开始的…

证书学习(一)keytool 工具使用介绍
目录 一、keytool 简介1.1 什么是 keytool?1.2 主要功能:1.3 使用场景1.4 常用命令1.5 默认参数 二、keytool 用法说明2.1 基本使用2.2 创建密钥库和密钥条目2.3 查看密钥库信息2.4 导出密钥库条目证书2.5 导入信任证书到密钥库2.6 打印证书内容2.7 删除…

零工市场小程序应该有什么功能?
数字经济现如今正飞速发展,零工市场小程序在连接雇主与自由职业者方面发挥着越来越重要的作用。一个高效的零工市场小程序不仅需要具备基础的信息发布与匹配功能,还应该涵盖交易管理、安全保障以及个性化服务等多个方面。
那么,零工市场小程…

为什么企业跨国组网建议用SD-WAN?
SD-WAN成为企业跨国组网的首选方案,主要因为它在灵活性、智能化管理以及数据安全等方面具备显著优势。在企业进行跨国组网时,往往会面临网络连接复杂、流量管理难度大以及数据安全等诸多挑战,而SD-WAN能够有效应对这些难题。 首先,…