在当今竞争激烈的市场中,数据驱动的产品开发已成为创造成功产品的关键。通过利用数据洞察,公司可以更准确地了解用户需求,做出更明智的产品决策,并持续优化产品性能。本文将探讨如何在产品开发的各个阶段应用数据驱动方法。

目录
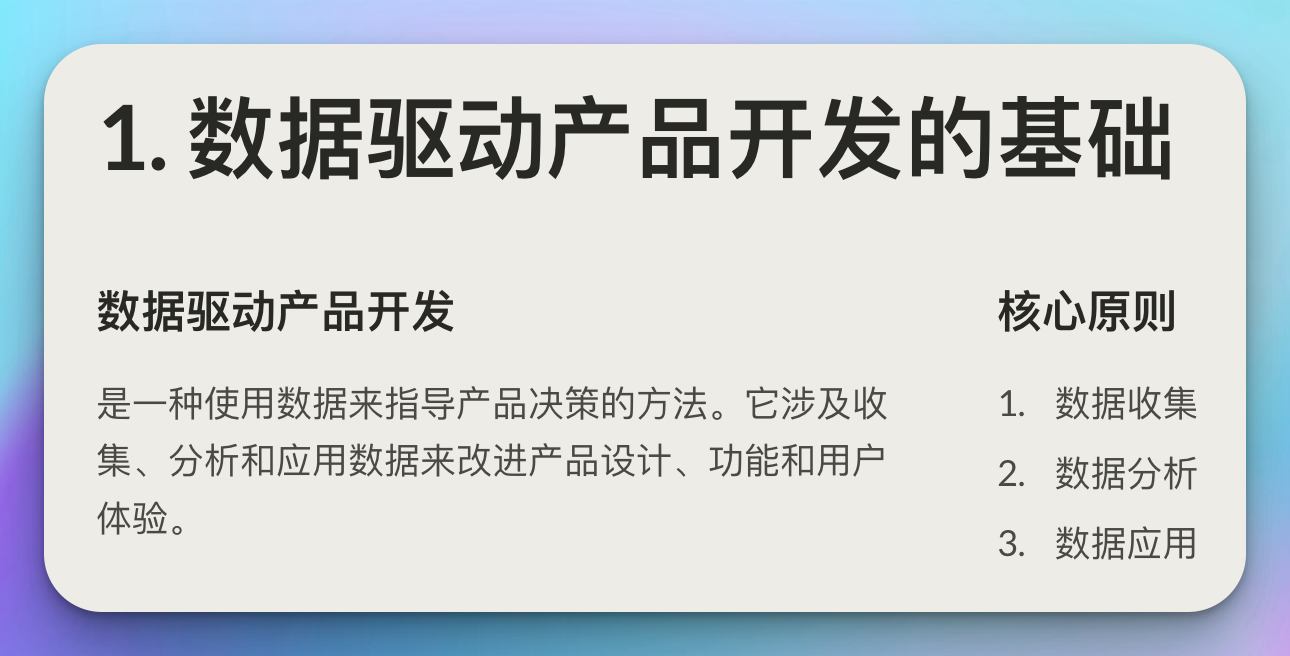
- 1. 数据驱动产品开发的基础
- 2. 用户需求分析
- 3. 功能优先级排序
- 4. A/B测试
- 5. 产品性能监控
- 6. 用户行为分析
- 7. 持续优化
- 8. 数据驱动决策的挑战
- 9. 案例研究:电子商务平台的数据驱动产品优化
- 10. 未来趋势
- 结语
1. 数据驱动产品开发的基础
数据驱动产品开发是一种使用数据来指导产品决策的方法。它涉及收集、分析和应用数据来改进产品设计、功能和用户体验。
class DataDrivenProductDevelopment:
    def __init__(self):
        self.stages = [
            "用户需求分析",
            "产品概念验证",
            "功能优先级排序",
            "原型设计与测试",
            "产品开发",
            "发布与监控",
            "持续优化"
        ]

    def explain_stage(self, stage):
        explanations = {
            "用户需求分析": "使用数据来了解用户的痛点和需求",
            "产品概念验证": "通过数据验证产品概念的可行性",
            "功能优先级排序": "基于数据来决定哪些功能最重要",
            "原型设计与测试": "使用数据来评估和改进原型",
            "产品开发": "在开发过程中持续使用数据来指导决策",
            "发布与监控": "使用数据来跟踪产品发布后的表现",
            "持续优化": "基于用户反馈和使用数据不断改进产品"
        }
        if stage in explanations:
            print(f"{stage}: {explanations[stage]}")
        else:
            print(f"未知阶段: {stage}")

    def demonstrate_process(self):
        print("数据驱动产品开发流程:")
        for stage in self.stages:
            self.explain_stage(stage)

# 使用示例
ddpd = DataDrivenProductDevelopment()
ddpd.demonstrate_process()
2. 用户需求分析
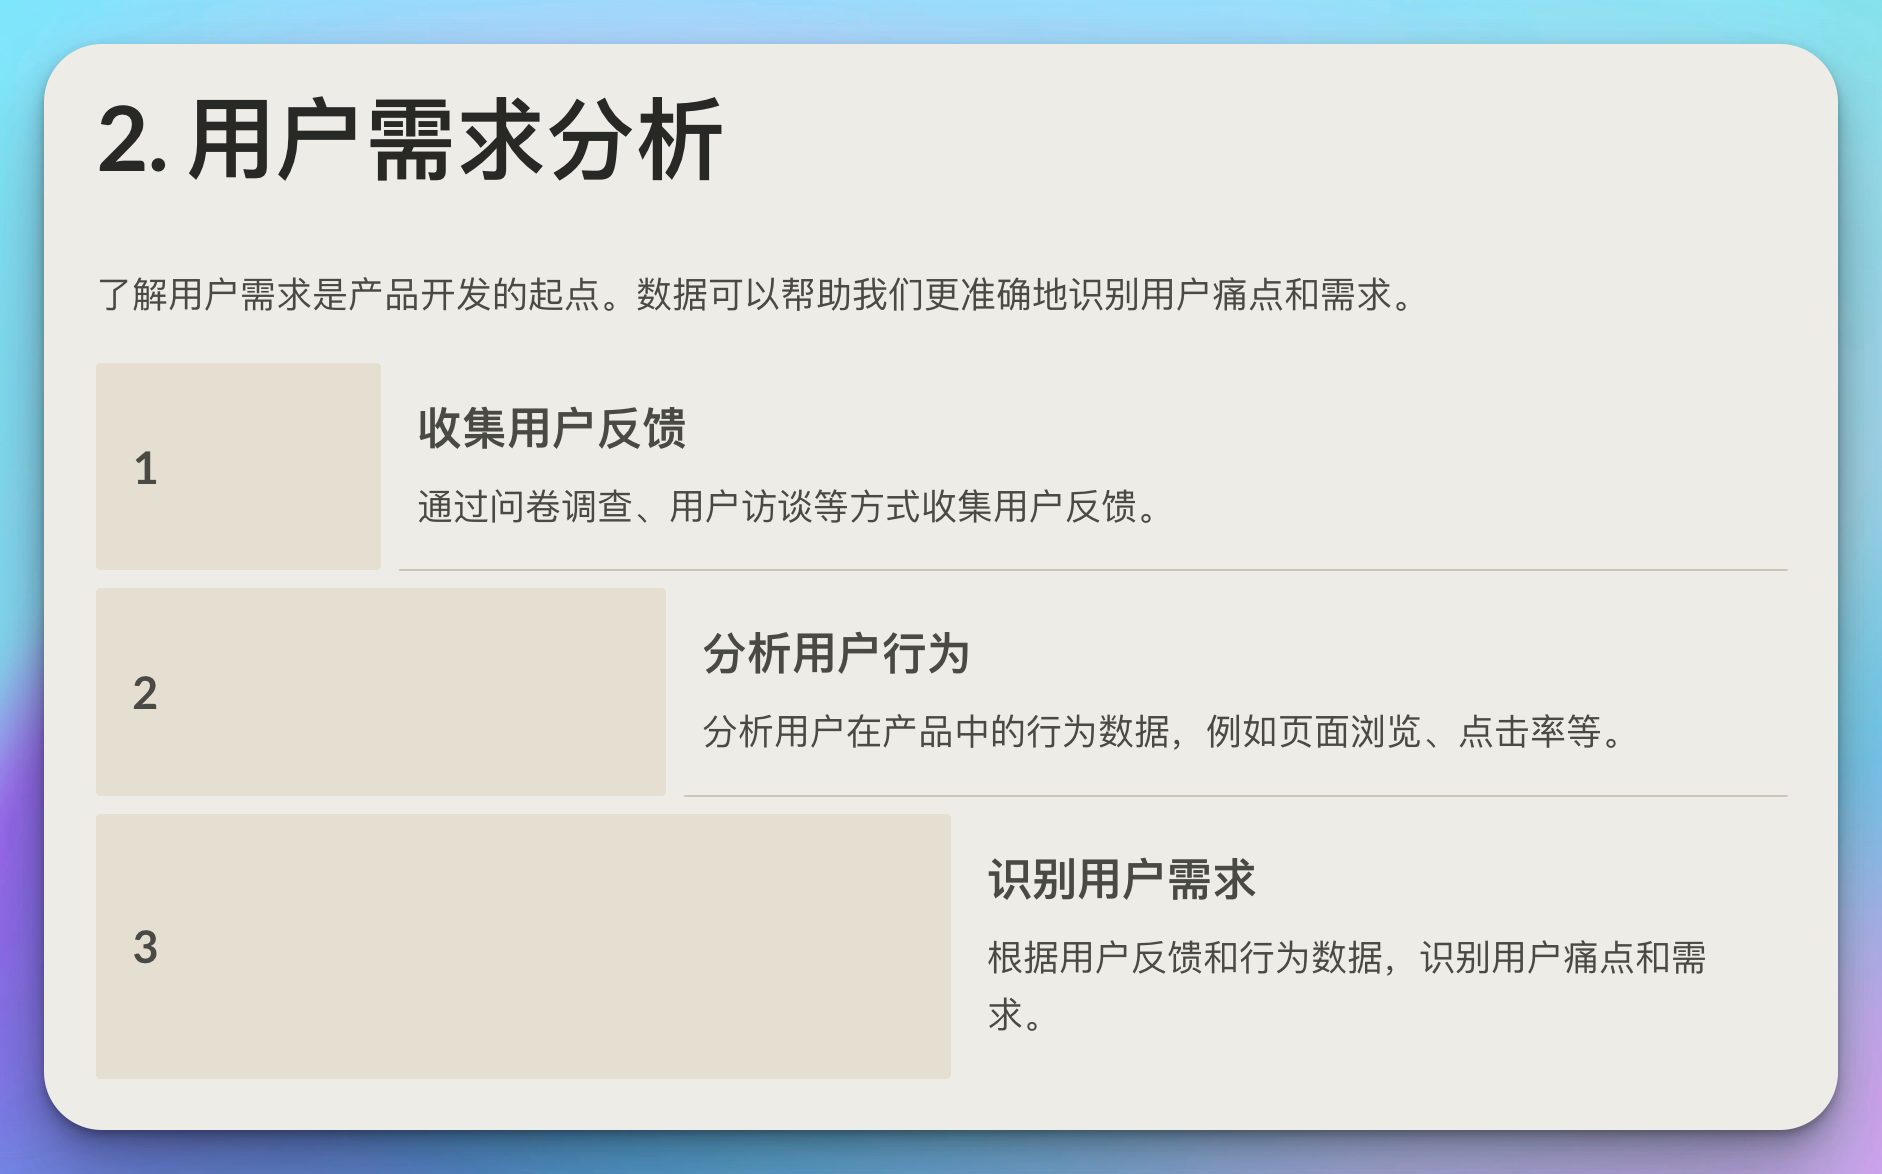
了解用户需求是产品开发的起点。数据可以帮助我们更准确地识别用户痛点和需求。
import pandas as pd
import matplotlib.pyplot as plt
from sklearn.feature_extraction.text import CountVectorizer
from sklearn.decomposition import LatentDirichletAllocation

class UserNeedsAnalysis:
    def __init__(self, feedback_data):
        self.feedback_data = feedback_data

    def analyze_sentiment(self):
        # 这里使用一个简单的情感分析方法,实际应用中可能需要更复杂的模型
        positive_words = ['good', 'great', 'excellent', 'love', 'like']
        negative_words = ['bad', 'poor', 'terrible', 'hate', 'dislike']

        self.feedback_data['sentiment'] = self.feedback_data['feedback'].apply(
            lambda x: 'positive' if any(word in x.lower() for word in positive_words)
            else ('negative' if any(word in x.lower() for word in negative_words)
            else 'neutral')
        )

        sentiment_counts = self.feedback_data['sentiment'].value_counts()
        plt.pie(sentiment_counts, labels=sentiment_counts.index, autopct='%1.1f%%')
        plt.title('Feedback Sentiment Analysis')
        plt.show()

    def topic_modeling(self, n_topics=5):
        vectorizer = CountVectorizer(max_df=0.95, min_df=2, stop_words='english')
        doc_term_matrix = vectorizer.fit_transform(self.feedback_data['feedback'])

        lda = LatentDirichletAllocation(n_components=n_topics, random_state=42)
        lda.fit(doc_term_matrix)

        feature_names = vectorizer.get_feature_names()
        for topic_idx, topic in enumerate(lda.components_):
            top_words = [feature_names[i] for i in topic.argsort()[:-10 - 1:-1]]
            print(f"Topic {topic_idx + 1}: {', '.join(top_words)}")

# 使用示例
feedback_data = pd.DataFrame({
    'feedback': [
        "I love the product, it's very user-friendly",
        "The app crashes frequently, terrible experience",
        "Great features but the interface could be improved",
        "I can't find the settings menu, very confusing",
        "Excellent customer support, they resolved my issue quickly"
    ]
})

analysis = UserNeedsAnalysis(feedback_data)
analysis.analyze_sentiment()
analysis.topic_modeling()
3. 功能优先级排序
使用数据来决定哪些功能最重要,可以帮助团队更有效地分配资源。
import pandas as pd
import matplotlib.pyplot as plt

class FeaturePrioritization:
    def __init__(self, features):
        self.features = features

    def calculate_rice_score(self):
        self.features['RICE'] = (self.features['Reach'] * self.features['Impact'] *
                                 self.features['Confidence']) / self.features['Effort']
        self.features = self.features.sort_values('RICE', ascending=False)

    def visualize_prioritization(self):
        plt.figure(figsize=(10, 6))
        plt.bar(self.features['Feature'], self.features['RICE'])
        plt.title('Feature Prioritization (RICE Score)')
        plt.xlabel('Features')
        plt.ylabel('RICE Score')
        plt.xticks(rotation=45, ha='right')
        plt.tight_layout()
        plt.show()

# 使用示例
features = pd.DataFrame({
    'Feature': ['Login System', 'Search Functionality', 'User Profile', 'Notifications', 'Chat'],
    'Reach': [1000, 5000, 2000, 3000, 1500],
    'Impact': [3, 5, 2, 4, 3],
    'Confidence': [90, 80, 70, 60, 50],
    'Effort': [5, 8, 3, 4, 6]
})

prioritization = FeaturePrioritization(features)
prioritization.calculate_rice_score()
prioritization.visualize_prioritization()
print(prioritization.features)
4. A/B测试
A/B测试是验证产品决策的有力工具。它允许我们用数据来支持或否定假设。
import numpy as np
from scipy import stats

class ABTest:
    def __init__(self, control_data, variant_data):
        self.control_data = control_data
        self.variant_data = variant_data

    def calculate_statistics(self):
        control_mean = np.mean(self.control_data)
        variant_mean = np.mean(self.variant_data)

        t_statistic, p_value = stats.ttest_ind(self.control_data, self.variant_data)

        return control_mean, variant_mean, t_statistic, p_value

    def interpret_results(self, alpha=0.05):
        control_mean, variant_mean, t_statistic, p_value = self.calculate_statistics()

        print(f"Control Mean: {control_mean:.2f}")
        print(f"Variant Mean: {variant_mean:.2f}")
        print(f"T-Statistic: {t_statistic:.2f}")
        print(f"P-Value: {p_value:.4f}")

        if p_value < alpha:
            print("The difference is statistically significant.")
            if variant_mean > control_mean:
                print("The variant performs better than the control.")
            else:
                print("The control performs better than the variant.")
        else:
            print("There is no statistically significant difference between the control and variant.")

# 使用示例
np.random.seed(42)
control_data = np.random.normal(10, 2, 1000)  # 控制组数据
variant_data = np.random.normal(10.5, 2, 1000)  # 实验组数据

ab_test = ABTest(control_data, variant_data)
ab_test.interpret_results()
5. 产品性能监控
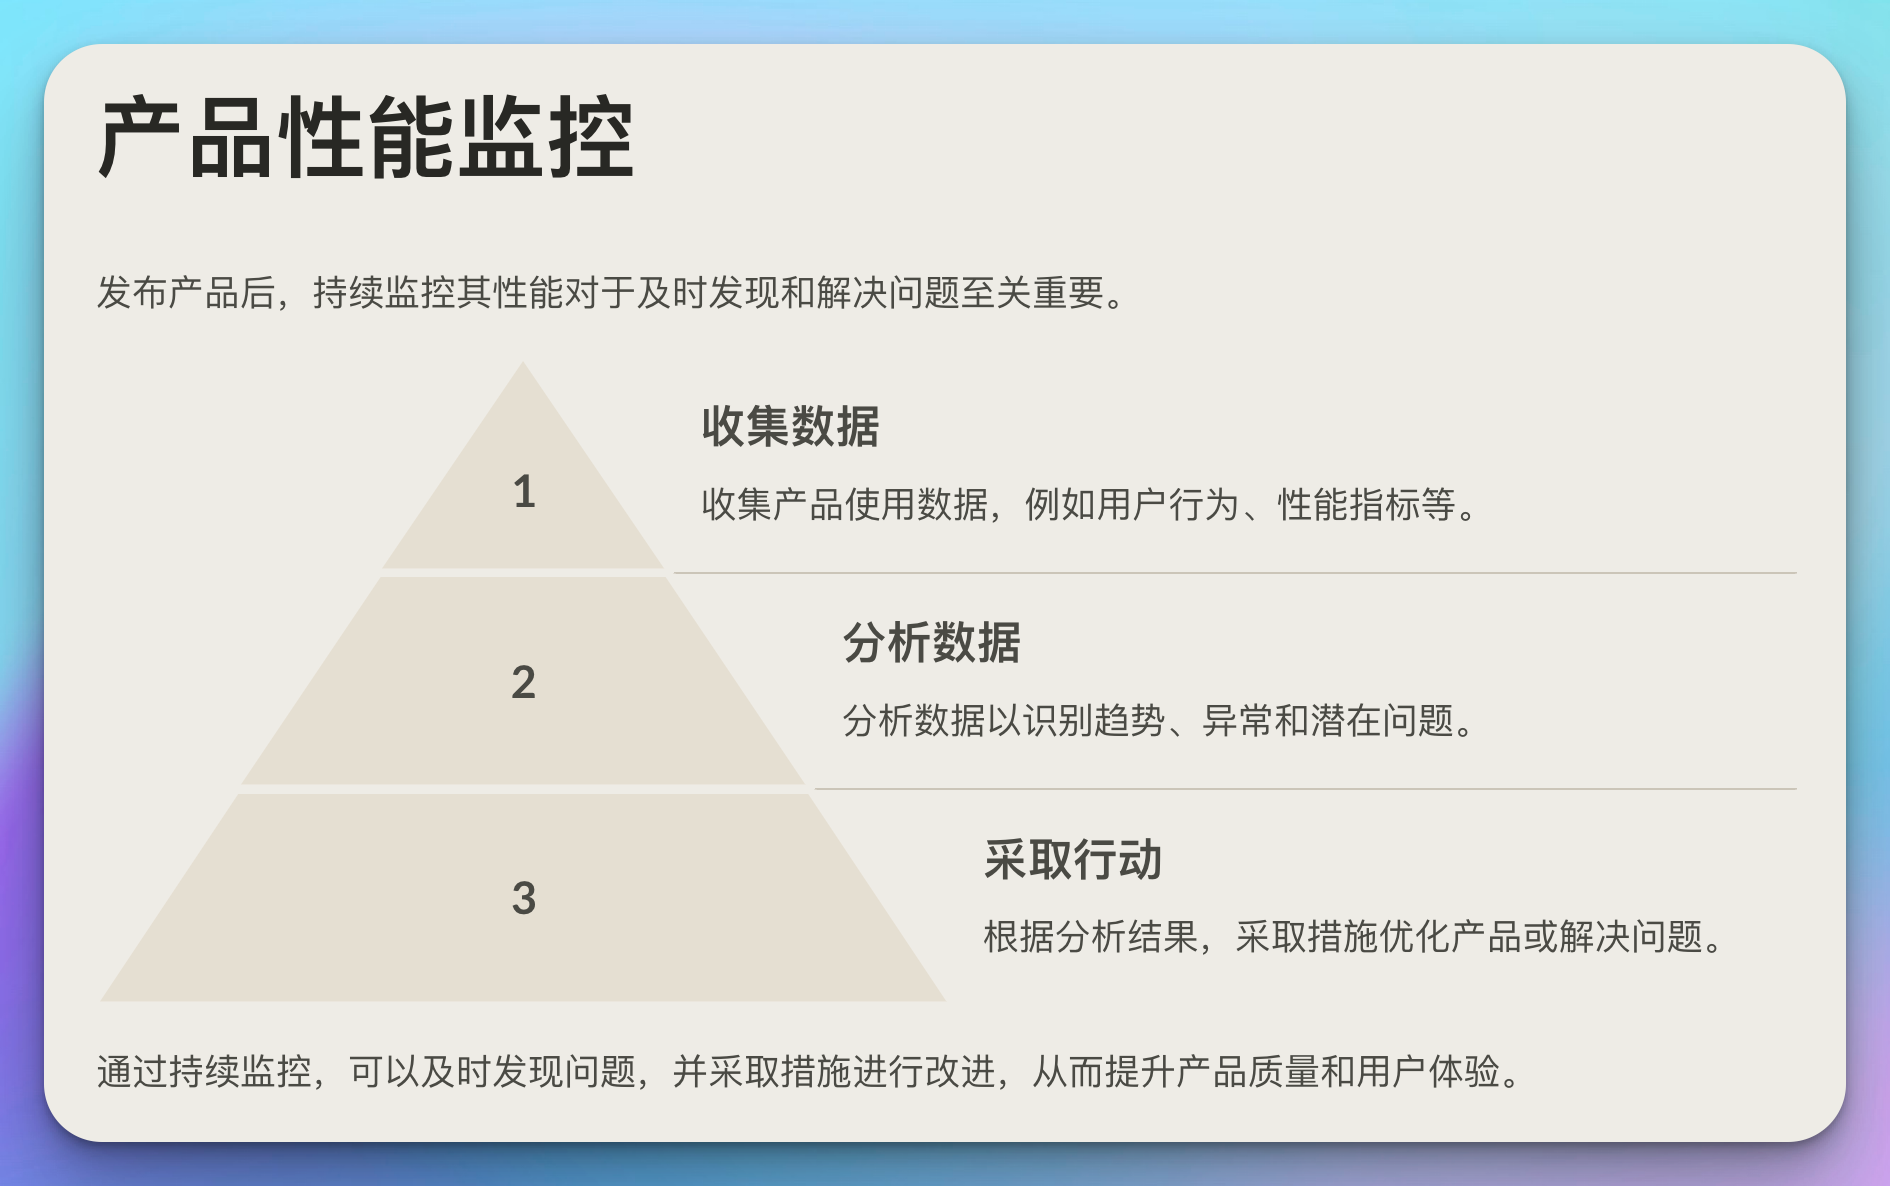
发布产品后,持续监控其性能对于及时发现和解决问题至关重要。
import pandas as pd
import matplotlib.pyplot as plt
from statsmodels.tsa.seasonal import seasonal_decompose

class ProductPerformanceMonitor:
    def __init__(self, performance_data):
        self.performance_data = performance_data

    def plot_key_metrics(self, metric):
        plt.figure(figsize=(12, 6))
        plt.plot(self.performance_data['date'], self.performance_data[metric])
        plt.title(f'{metric} Over Time')
        plt.xlabel('Date')
        plt.ylabel(metric)
        plt.xticks(rotation=45)
        plt.tight_layout()
        plt.show()

    def detect_anomalies(self, metric, window=7, threshold=2):
        rolling_mean = self.performance_data[metric].rolling(window=window).mean()
        rolling_std = self.performance_data[metric].rolling(window=window).std()

        anomalies = self.performance_data[abs(self.performance_data[metric] - rolling_mean) > threshold * rolling_std]

        plt.figure(figsize=(12, 6))
        plt.plot(self.performance_data['date'], self.performance_data[metric], label='Actual')
        plt.plot(self.performance_data['date'], rolling_mean, label='Rolling Mean')
        plt.scatter(anomalies['date'], anomalies[metric], color='red', label='Anomalies')
        plt.title(f'Anomaly Detection in {metric}')
        plt.xlabel('Date')
        plt.ylabel(metric)
        plt.legend()
        plt.xticks(rotation=45)
        plt.tight_layout()
        plt.show()

    def analyze_seasonality(self, metric):
        result = seasonal_decompose(self.performance_data[metric], model='additive', period=7)
        result.plot()
        plt.tight_layout()
        plt.show()

# 使用示例
dates = pd.date_range(start='2023-01-01', end='2023-12-31', freq='D')
daily_active_users = np.random.normal(1000, 100, len(dates)) + np.sin(np.arange(len(dates)) * 2 * np.pi / 7) * 50
performance_data = pd.DataFrame({
    'date': dates,
    'daily_active_users': daily_active_users
})

monitor = ProductPerformanceMonitor(performance_data)
monitor.plot_key_metrics('daily_active_users')
monitor.detect_anomalies('daily_active_users')
monitor.analyze_seasonality('daily_active_users')
6. 用户行为分析
深入理解用户如何使用产品可以为产品改进提供宝贵的洞察。
import pandas as pd
import networkx as nx
import matplotlib.pyplot as plt

class UserBehaviorAnalysis:
    def __init__(self, user_actions):
        self.user_actions = user_actions

    def analyze_user_flow(self):
        user_paths = self.user_actions.groupby('user_id')['action'].apply(list).reset_index()

        G = nx.DiGraph()
        for path in user_paths['action']:
            nx.add_path(G, path)

        pos = nx.spring_layout(G)
        plt.figure(figsize=(12, 8))
        nx.draw(G, pos, with_labels=True, node_color='lightblue', node_size=3000, font_size=10, arrows=True)
        edge_labels = nx.get_edge_attributes(G, 'weight')
        nx.draw_networkx_edge_labels(G, pos, edge_labels)
        plt.title('User Flow Analysis')
        plt.axis('off')
        plt.tight_layout()
        plt.show()

    def identify_common_patterns(self):
        action_counts = self.user_actions['action'].value_counts()
        plt.figure(figsize=(10, 6))
        action_counts.plot(kind='bar')
        plt.title('Most Common User Actions')
        plt.xlabel('Action')
        plt.ylabel('Count')
        plt.xticks(rotation=45, ha='right')
        plt.tight_layout()
        plt.show()

# 使用示例
user_actions = pd.DataFrame({
    'user_id': [1, 1, 1, 2, 2, 2, 3, 3, 3],
    'action': ['login', 'search', 'purchase', 'login', 'browse', 'logout', 'login', 'search', 'logout']
})

behavior_analysis = UserBehaviorAnalysis(user_actions)
behavior_analysis.analyze_user_flow()
behavior_analysis.identify_common_patterns()
7. 持续优化
产品开发是一个持续的过程。使用数据来指导迭代和优化至关重要。
import pandas as pd
import matplotlib.pyplot as plt

class ContinuousOptimization:
    def __init__(self, metrics_data):
        self.metrics_data = metrics_data

    def track_key_metrics(self, metric):
        plt.figure(figsize=(12, 6))
        for version in self.metrics_data['version'].unique():
            version_data = self.metrics_data[self.metrics_data['version'] == version]
            plt.plot(version_data['date'], version_data[metric], label=f'Version {version}')

        plt.title(f'{metric} Across Product Versions')
        plt.xlabel('Date')
        plt.ylabel(metric)
        plt.legend()
        plt.xticks(rotation=45)
        plt.tight_layout()
        plt.show()

    def compare_versions(self, metric):
        version_comparison = self.metrics_data.groupby('version')[metric].mean().sort_values(ascending=False)

        plt.figure(figsize=(10, 6))
        version_comparison.plot(kind='bar')
        plt.title(f'Average {metric} by Product Version')
        plt.xlabel('Version')
        plt.ylabel(f'Average {metric}')
        plt.xticks(rotation=0)
        plt.tight_layout()
        plt.show()

    def identify_improvement_areas(self):
        latest_version = self.metrics_data['version'].max()
        latest_data = self.metrics_data[self.metrics_data['version'] == latest_version]

        improvement_areas = []
        for column in latest_data.columns:
            if column not in ['date', 'version']:
                if latest_data[column].mean() < self.metrics_data[column].mean():
                    improvement_areas.append(column)

        print("需要改进的领域:")
        for area in improvement_areas:
            print(f"- {area}")

# 使用示例
dates = pd.date_range(start='2023-01-01', end='2023-12-31', freq='D')
versions = np.repeat([1, 2, 3], len(dates)//3 + 1)[:len(dates)]
user_satisfaction = np.random.normal(7, 1, len(dates)) + versions * 0.5
daily_active_users = np.random.normal(1000, 100, len(dates)) + versions * 100

metrics_data = pd.DataFrame({
    'date': dates,
    'version': versions,
    'user_satisfaction': user_satisfaction,
    'daily_active_users': daily_active_users
})

optimization = ContinuousOptimization(metrics_data)
optimization.track_key_metrics('user_satisfaction')
optimization.compare_versions('daily_active_users')
optimization.identify_improvement_areas()
8. 数据驱动决策的挑战
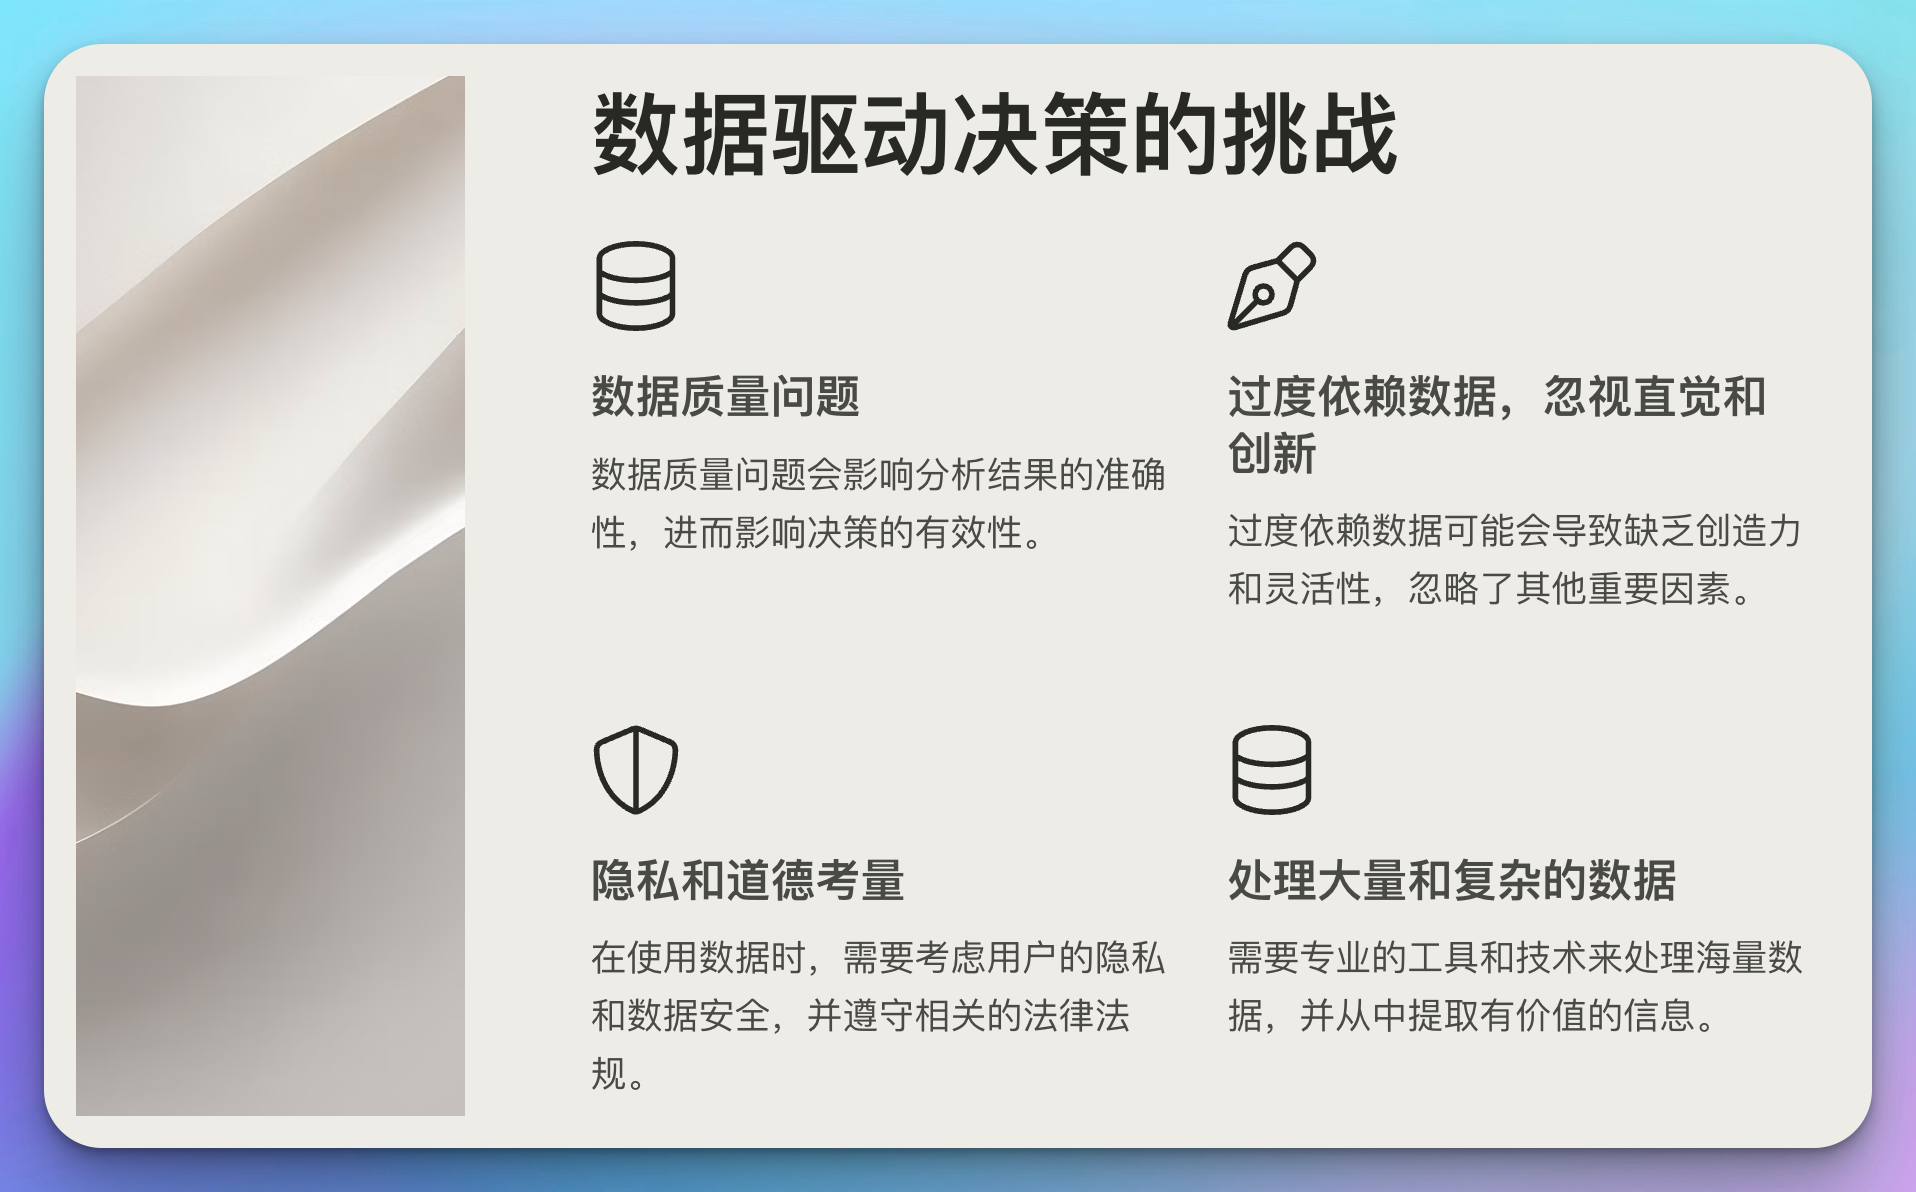
虽然数据驱动的产品开发有许多优势,但也面临一些挑战:
- 数据质量问题
- 过度依赖数据,忽视直觉和创新
- 隐私和道德考量
- 处理大量和复杂的数据
- 平衡短期指标和长期目标
class DataDrivenChallenges:
    def __init__(self):
        self.challenges = [
            "数据质量问题",
            "过度依赖数据,忽视直觉和创新",
            "隐私和道德考量",
            "处理大量和复杂的数据",
            "平衡短期指标和长期目标"
        ]

    def discuss_challenge(self, challenge):
        if challenge in self.challenges:
            print(f"讨论数据驱动决策的挑战: {challenge}")
            # 这里可以添加具体的讨论内容
        else:
            print(f"未知的挑战: {challenge}")

    def propose_solution(self, challenge):
        solutions = {
            "数据质量问题": "实施严格的数据验证和清洗流程",
            "过度依赖数据,忽视直觉和创新": "平衡定量分析和定性洞察",
            "隐私和道德考量": "制定和遵守严格的数据伦理准则",
            "处理大量和复杂的数据": "投资先进的数据处理和分析工具",
            "平衡短期指标和长期目标": "建立全面的指标体系,包括长期和短期指标"
        }
        if challenge in solutions:
            print(f"针对'{challenge}'的解决方案: {solutions[challenge]}")
        else:
            print(f"未找到针对'{challenge}'的解决方案")

# 使用示例
challenges = DataDrivenChallenges()
challenges.discuss_challenge("隐私和道德考量")
challenges.propose_solution("隐私和道德考量")

9. 案例研究:电子商务平台的数据驱动产品优化
让我们通过一个电子商务平台的案例来综合应用我们所学的知识。
import pandas as pd
import numpy as np
import matplotlib.pyplot as plt
from sklearn.cluster import KMeans

class EcommerceProductOptimization:
    def __init__(self, user_data, product_data, transaction_data):
        self.user_data = user_data
        self.product_data = product_data
        self.transaction_data = transaction_data

    def analyze_user_segments(self):
        user_features = self.user_data[['age', 'total_spend']]
        kmeans = KMeans(n_clusters=3, random_state=42)
        self.user_data['segment'] = kmeans.fit_predict(user_features)

        plt.figure(figsize=(10, 6))
        for segment in self.user_data['segment'].unique():
            segment_data = self.user_data[self.user_data['segment'] == segment]
            plt.scatter(segment_data['age'], segment_data['total_spend'], label=f'Segment {segment}')
        plt.title('User Segments')
        plt.xlabel('Age')
        plt.ylabel('Total Spend')
        plt.legend()
        plt.show()

    def product_performance_analysis(self):
        product_performance = self.transaction_data.groupby('product_id').agg({
            'quantity': 'sum',
            'revenue': 'sum'
        }).reset_index()

        product_performance = product_performance.merge(self.product_data, on='product_id')

        plt.figure(figsize=(12, 6))
        plt.scatter(product_performance['price'], product_performance['revenue'],
                    s=product_performance['quantity'], alpha=0.5)
        plt.title('Product Performance')
        plt.xlabel('Price')
        plt.ylabel('Revenue')
        plt.tight_layout()
        plt.show()

    def recommend_optimizations(self):
        # 基于用户细分的个性化推荐
        segment_preferences = self.transaction_data.merge(self.user_data[['user_id', 'segment']], on='user_id')
        segment_preferences = segment_preferences.groupby(['segment', 'category']).agg({
            'quantity': 'sum'
        }).reset_index().sort_values('quantity', ascending=False)

        print("基于用户细分的产品类别推荐:")
        for segment in segment_preferences['segment'].unique():
            top_category = segment_preferences[segment_preferences['segment'] == segment].iloc[0]['category']
            print(f"Segment {segment}: 推荐 {top_category}")

        # 识别表现不佳的产品
        underperforming_products = self.transaction_data.groupby('product_id').agg({
            'quantity': 'sum',
            'revenue': 'sum'
        }).reset_index().sort_values('revenue').head(5)

        print("\n需要优化的产品:")
        for _, product in underperforming_products.iterrows():
            print(f"Product ID {product['product_id']}: Revenue ${product['revenue']:.2f}")

# 使用示例
np.random.seed(42)

# 生成模拟数据
user_data = pd.DataFrame({
    'user_id': range(1000),
    'age': np.random.randint(18, 70, 1000),
    'total_spend': np.random.uniform(100, 1000, 1000)
})

product_data = pd.DataFrame({
    'product_id': range(100),
    'category': np.random.choice(['Electronics', 'Clothing', 'Books', 'Home'], 100),
    'price': np.random.uniform(10, 500, 100)
})

transaction_data = pd.DataFrame({
    'user_id': np.random.choice(user_data['user_id'], 5000),
    'product_id': np.random.choice(product_data['product_id'], 5000),
    'quantity': np.random.randint(1, 5, 5000)
})
transaction_data['revenue'] = transaction_data['quantity'] * product_data.loc[transaction_data['product_id'], 'price'].values

ecommerce_optimization = EcommerceProductOptimization(user_data, product_data, transaction_data)
ecommerce_optimization.analyze_user_segments()
ecommerce_optimization.product_performance_analysis()
ecommerce_optimization.recommend_optimizations()
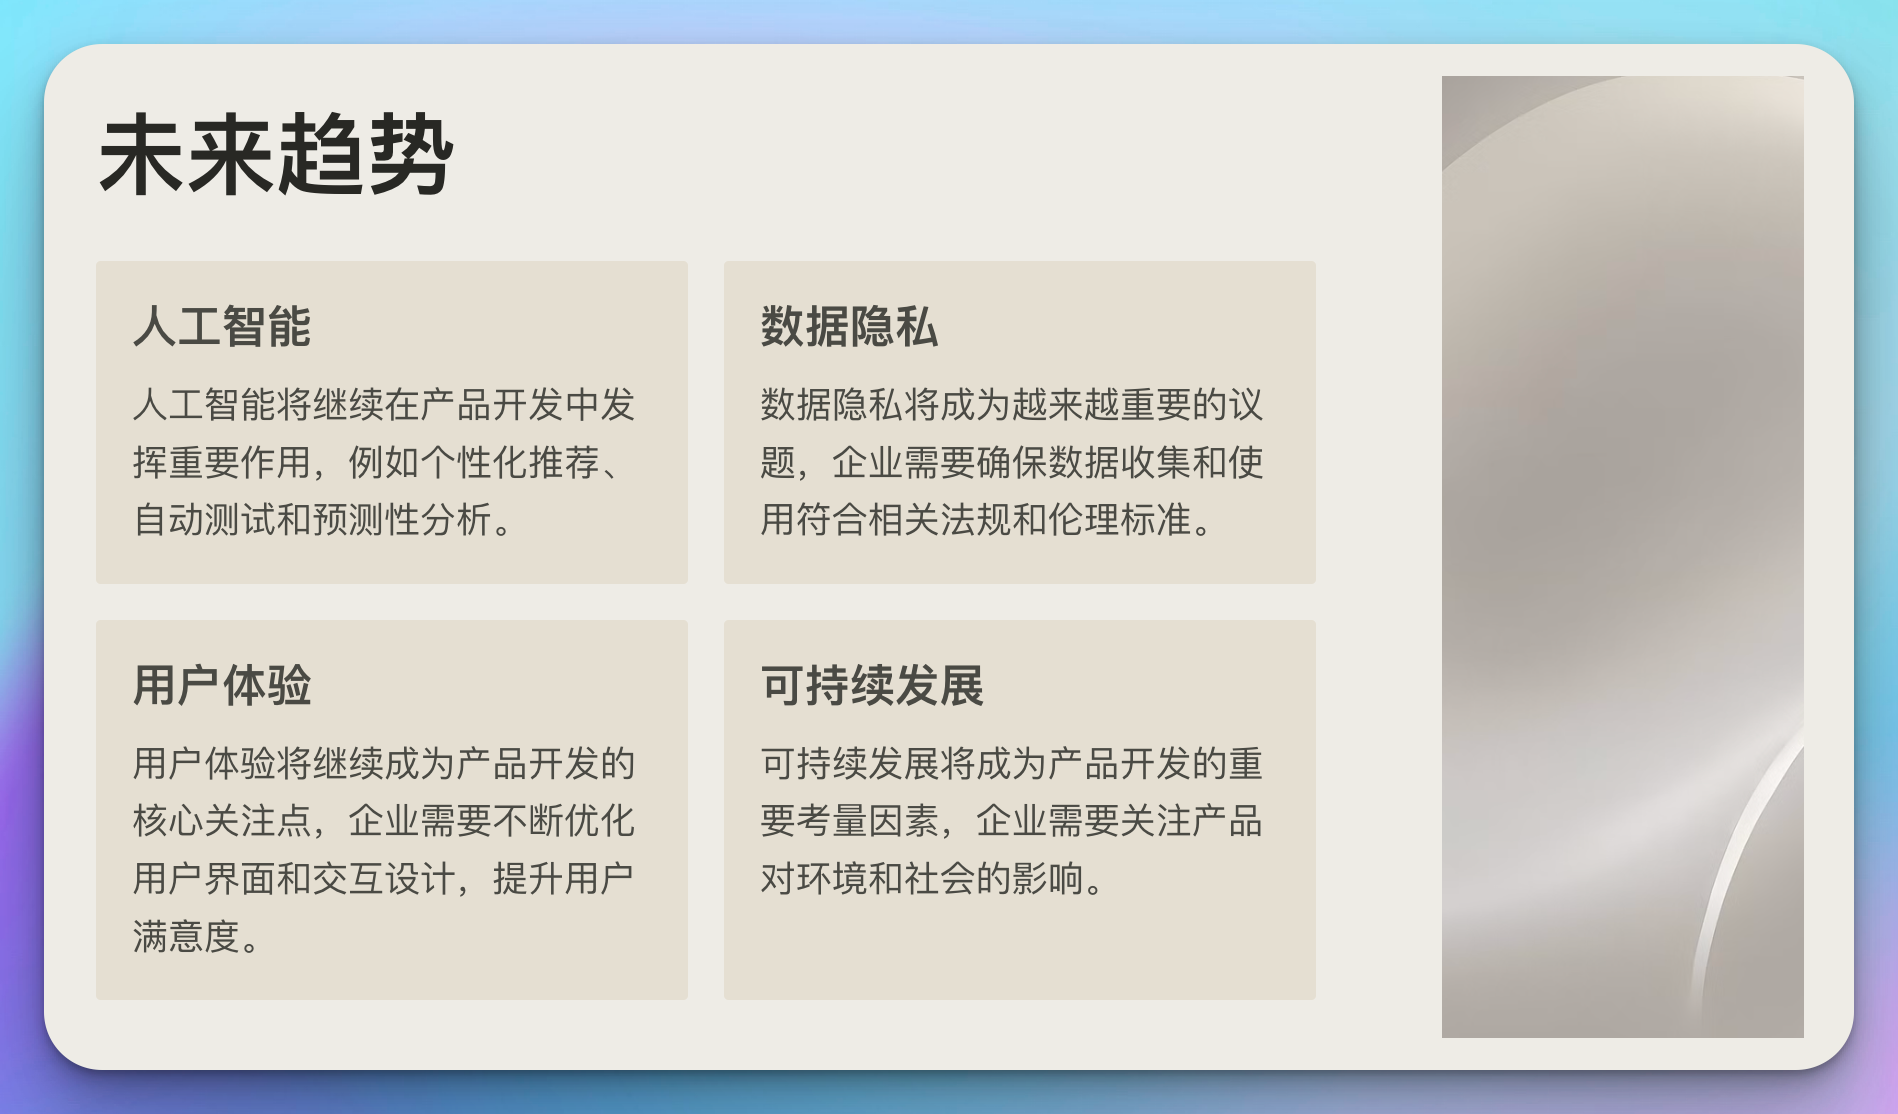
10. 未来趋势
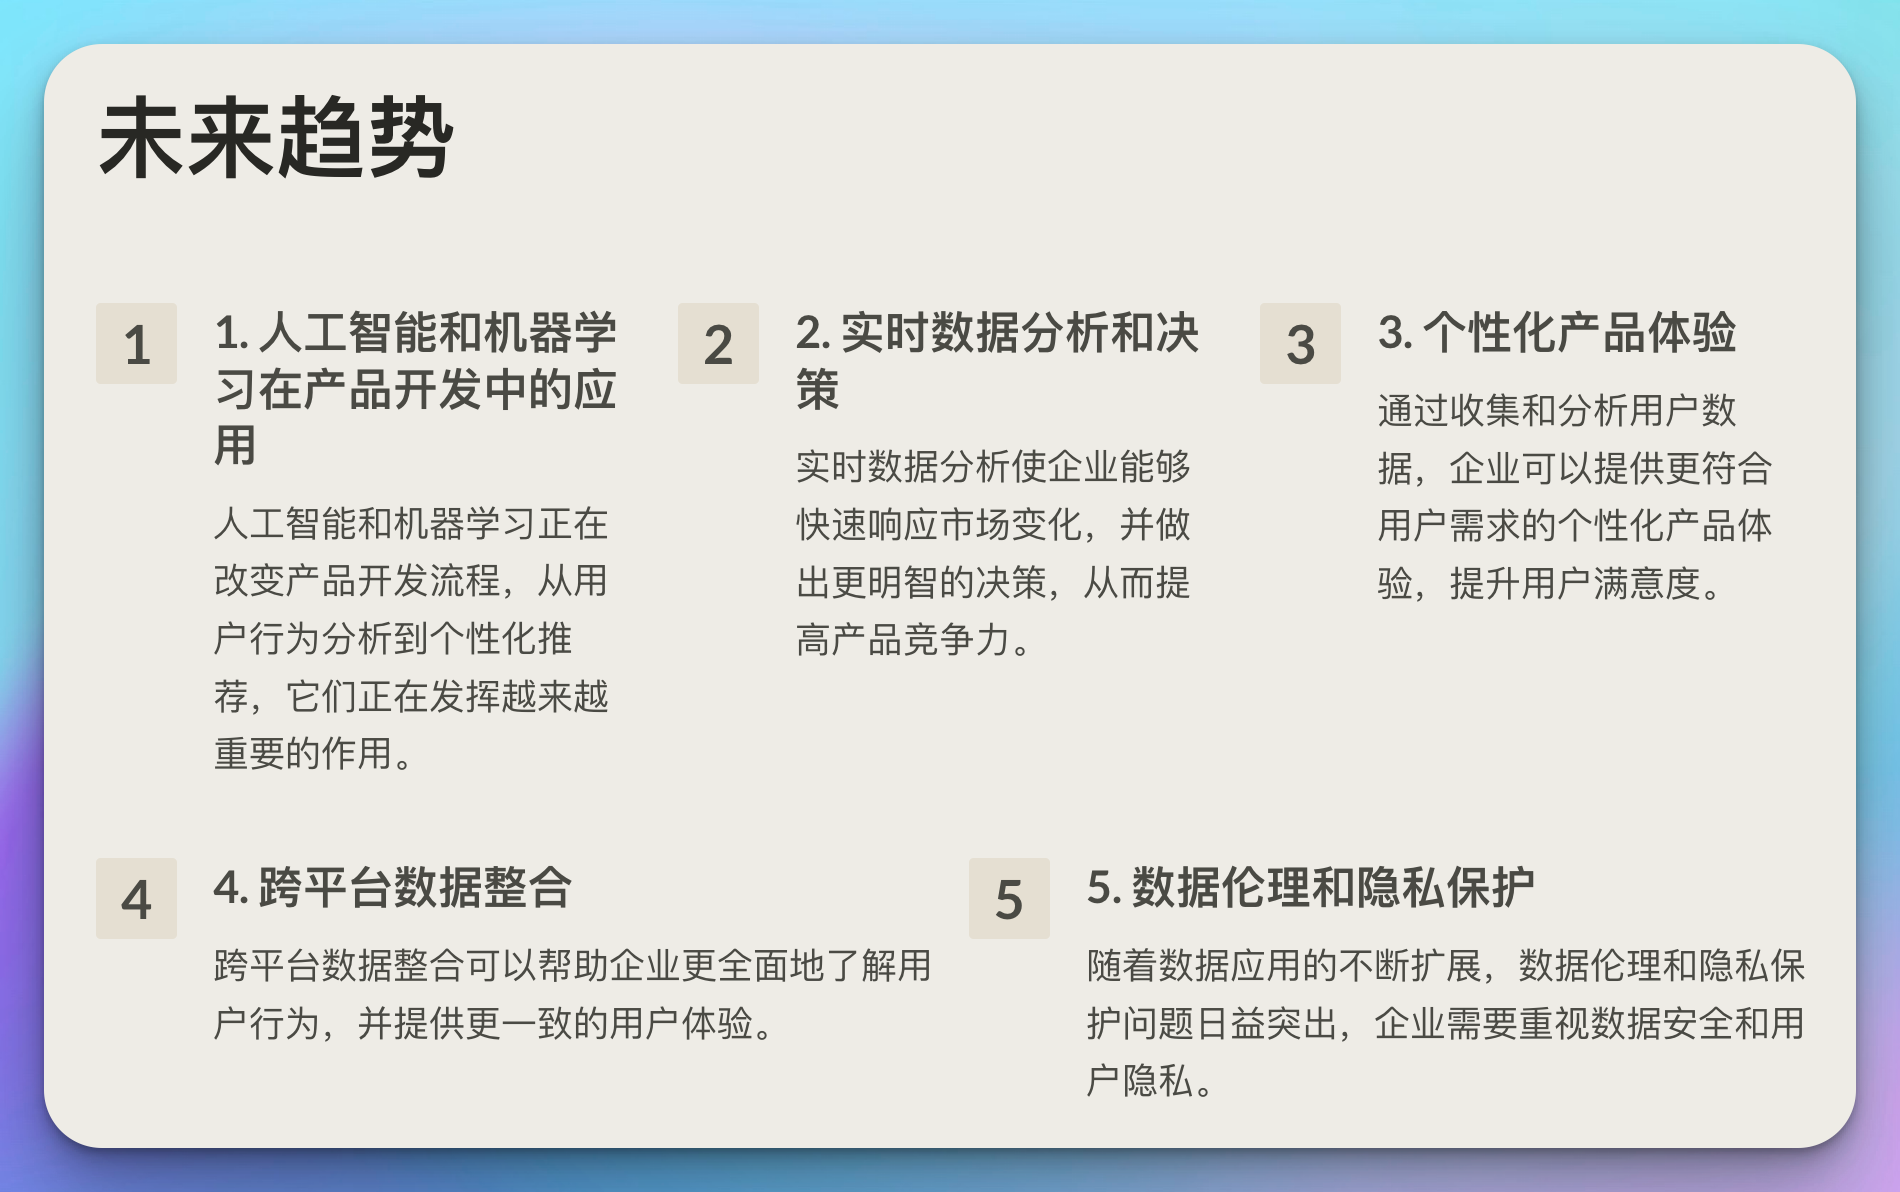
数据驱动产品开发领域正在快速发展,以下是一些值得关注的趋势:
- 人工智能和机器学习在产品开发中的应用
- 实时数据分析和决策
- 个性化产品体验
- 跨平台数据整合
- 数据伦理和隐私保护
class ProductDevelopmentTrends:
    def __init__(self):
        self.trends = [
            "人工智能和机器学习在产品开发中的应用",
            "实时数据分析和决策",
            "个性化产品体验",
            "跨平台数据整合",
            "数据伦理和隐私保护"
        ]

    def explore_trend(self, trend):
        if trend in self.trends:
            print(f"\n探索产品开发的未来趋势: {trend}")
            impact = input("预期影响 (低/中/高): ")
            readiness = input("行业准备程度 (低/中/高): ")

            print(f"趋势分析结果:")
            print(f"  预期影响: {impact}")
            print(f"  行业准备程度: {readiness}")

            if impact.lower() == "高" and readiness.lower() != "高":
                print("  建议: 需要加大投资和关注以提高准备程度")
            elif impact.lower() == "中" and readiness.lower() == "低":
                print("  建议: 需要开始规划和准备")
            else:
                print("  建议: 持续关注发展动态")
        else:
            print(f"未知的产品开发趋势: {trend}")

# 使用示例
trends = ProductDevelopmentTrends()
trends.explore_trend("人工智能和机器学习在产品开发中的应用")
结语
数据驱动的产品开发为组织提供了强大的工具,能够更准确地了解用户需求,做出更明智的产品决策,并持续优化产品性能。本文探讨了数据驱动产品开发的核心概念、方法论和实践,涵盖了从用户需求分析到持续优化的整个过程。
关键要点包括:
- 利用数据进行用户需求分析和行为洞察
- 基于数据进行功能优先级排序
- 使用A/B测试验证产品决策
- 持续监控产品性能并进行优化
- 应对数据驱动决策的挑战
- 关注产品开发的未来趋势
通过掌握这些数据驱动产品开发的知识和技能,产品经理和开发团队可以创造出更符合用户需求、更具竞争力的产品。记住,数据驱动不仅仅是收集和分析数据,更重要的是将数据洞察转化为实际的产品改进和创新。
在数据时代,那些能够有效利用数据来指导产品开发的组织将在竞争中脱颖而出。通过不断学习和实践数据驱动方法,你可以帮助你的组织创造出真正卓越的产品,为用户创造价值,推动业务增长。