Title
题目
Evaluation of a Cascaded Deep Learning–based Algorithm for Prostate Lesion Detection at Biparametric MRI
基于级联深度学习算法的前列腺病灶检测在双参数MRI中的评估
Background
背景
Multiparametric MRI (mpMRI) improves prostate cancer (PCa) detection compared with systematic biopsy, but its interpretation is prone to interreader variation, which results in performance inconsistency. Artificial intelligence (AI) models can assist in mpMRI interpretation, but large training data sets and extensive model testing are required.
多参数MRI(mpMRI)相比系统性活检能提高前列腺癌(PCa)的检测率,但其解读易受不同阅片者之间的差异影响,导致性能不一致。人工智能(AI)模型可以辅助mpMRI的解读,但需要大量的训练数据集和广泛的模型测试。
Method
方法
This secondary analysis of a prospective registry included consecutive patients with suspected or known PCa who underwent mpMRI, US-guided systematic biopsy, or combined systematic and MRI/US fusion–guided biopsy between April 2019 and September 2022. All lesions were prospectively evaluated using Prostate Imaging Reporting and Data System version 2.1. The lesion- and participant-level performance of a previously developed cascaded deep learning algorithm was compared with histopathologic outcomes and radiologist readings using sensitivity, positive predictive value (PPV), and Dice similarity coefficient (DSC).
这项前瞻性登记的二次分析纳入了2019年4月至2022年9月期间连续接受多参数MRI(mpMRI)、超声引导的系统性活检或系统性活检与MRI/超声融合引导活检联合检查的疑似或已知前列腺癌(PCa)患者。所有病灶均按照前列腺影像报告与数据系统(Prostate Imaging Reporting and Data System,PI-RADS)2.1版本进行前瞻性评估。使用敏感性、阳性预测值(PPV)和Dice相似系数(DSC)比较了先前开发的级联深度学习算法与组织病理学结果及放射科医生解读之间的病灶级和参与者级表现。
Conclusion
结论
The AI algorithm detected cancer-suspicious lesions on biparametric MRI scans with a performance comparable to that of
该AI算法在双参数MRI扫描中检测癌症可疑病灶的表现与以下内容相当:
Results
结果
A total of 658 male participants (median age, 67 years [IQR, 61–71 years]) with 1029 MRI-visible lesions were included. At histopathologic analysis, 45% (294 of 658) of participants had lesions of International Society of Urological Pathology (ISUP) grade group (GG) 2 or higher. The algorithm identified 96% (282 of 294; 95% CI: 94%, 98%) of all participants with clinically significant PCa, whereas the radiologist identified 98% (287 of 294; 95% CI: 96%, 99%; P = .23). The algorithm identified 84% (103 of 122), 96% (152 of 159), 96% (47 of 49), 95% (38 of 40), and 98% (45 of 46) of participants with ISUP GG 1, 2, 3, 4, and 5 lesions, respectively. In the lesion-level analysis using radiologist ground truth, the detection sensitivity was 55% (569 of 1029; 95% CI: 52%, 58%), and the PPV was 57% (535 of 934; 95% CI: 54%, 61%). The mean number of false-positive lesions per participant was 0.61 (range, 0–3). The lesion segmentation DSC was 0.29.
共纳入了658名男性参与者(中位年龄67岁 [IQR, 61–71岁]),其中包括1029个MRI可见病灶。在组织病理学分析中,45%的参与者(658人中的294人)具有国际泌尿病理学会(ISUP)分级2级或更高的病灶。算法识别出了96%的临床意义显著的前列腺癌(PCa)参与者(294人中的282人;95% CI:94%,98%),而放射科医生识别出了98%(294人中的287人;95% CI:96%,99%;P = .23)。该算法分别识别出84%(122人中的103人)、96%(159人中的152人)、96%(49人中的47人)、95%(40人中的38人)和98%(46人中的45人)的ISUP分级1、2、3、4和5级病灶患者。在使用放射科医生作为标准的病灶级分析中,检测敏感性为55%(1029个病灶中的569个;95% CI:52%,58%),阳性预测值(PPV)为57%(934个检测出的病灶中的535个;95% CI:54%,61%)。每位参与者的平均假阳性病灶数为0.61(范围,0–3)。病灶分割的Dice相似系数(DSC)为0.29。
Figure
图
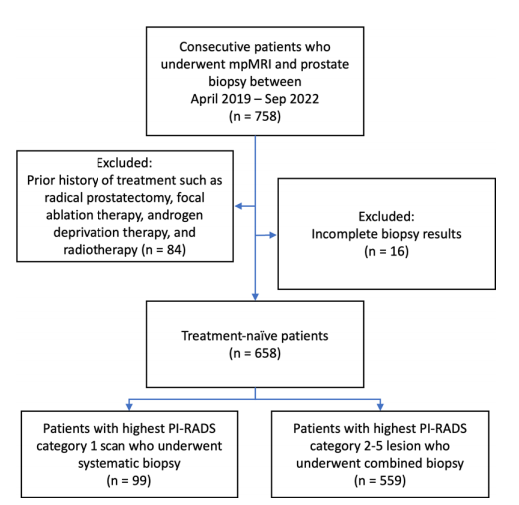
Figure 1: Participant flow diagram. mpMRI = multiparametric MRI, PI-RADS = Prostate Imaging Reporting and Data System.
图1: 参与者流程图。mpMRI = 多参数MRI,PI-RADS = 前列腺影像报告与数据系统。
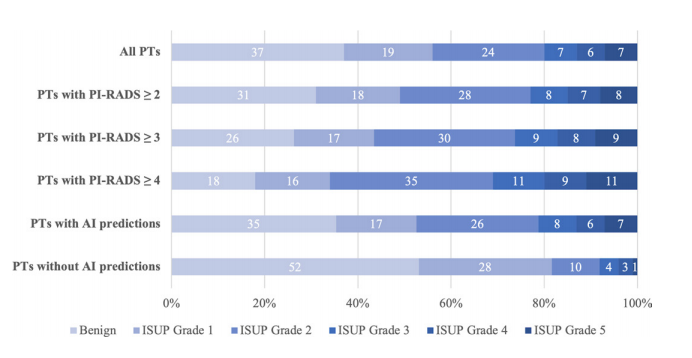
Figure 2: Distribution of combined biopsy outcomes (percentage) based on highest International Society of Urological Pathology (ISUP) grade group per participant (PT). AI = artificial intelligence, PI-RADS = Prostate Imaging Reporting and Data System.
图2: 根据每位参与者的最高国际泌尿病理学会(ISUP)分级组,显示联合活检结果的分布情况(百分比)。AI = 人工智能,PI-RADS = 前列腺影像报告与数据系统。

Figure 3: Axial multiparametric MRI scans in a 72-year-old male participant with a serum prostate-specific antigen level of 9.1 ng/mL: (A) T2-weighted image, (B)apparent diffusion coefficient map, (C) high-b-value diffusion-weighted image (b = 1500 sec/mm2 ), (D) dynamic contrast-enhanced image (frame 17 of 54 acquired at 5.6-second intervals), (E) T2-weighted image with radiologist-segmented lesions (green contours) overlaid, (F) T2-weighted image with artificial intelligence (AI) prediction map overlaid (red contour is positive prediction; blue contour is AI prostate organ segmentation), and (G) T2-weighted image with AI probability map overlaid (red indicates higher probability). Two distinct lesions were detected by the radiologist and represented the ground truth. Lesion 1 (1.6 cm; arrow in A–D) was in the right midgland transition zone and was designated Prostate Imaging Reporting and Data System (PI-RADS) category 4. Lesion 2 (1.5 cm; arrowhead in A–D) was in the left midgland transition zone and was designated PI-RADS category 3. Lesion 1 was correctly detected (true positive), while lesion 2 was missed by the AI algorithm (false negative). Based on targeted biopsy samples, lesion 1 was positive for Gleason score 7 (3 + 4) prostate adenocarcinoma, and lesion 2 was benign.
图3: 一名72岁男性参与者的轴向多参数MRI扫描,血清前列腺特异性抗原(PSA)水平为9.1 ng/mL:(A) T2加权图像,(B) 表观扩散系数图,(C) 高b值扩散加权图像(b = 1500 sec/mm²),(D) 动态对比增强图像(在5.6秒间隔内获取的54帧中的第17帧),(E) 覆盖放射科医生分割病灶(绿色轮廓)的T2加权图像,(F) 覆盖人工智能(AI)预测图的T2加权图像(红色轮廓为阳性预测;蓝色轮廓为AI前列腺器官分割),以及(G) 覆盖AI概率图的T2加权图像(红色表示更高的概率)。放射科医生检测到两个不同的病灶,并作为标准。病灶1(1.6厘米;A–D中的箭头)位于右侧腺体中部过渡区,被指定为前列腺影像报告与数据系统(PI-RADS)类别4。病灶2(1.5厘米;A–D中的箭头头)位于左侧腺体中部过渡区,被指定为PI-RADS类别3。病灶1被正确检测到(真阳性),而病灶2被AI算法遗漏(假阴性)。根据靶向活检样本,病灶1被确诊为Gleason评分7(3 + 4)的前列腺腺癌,病灶2为良性。
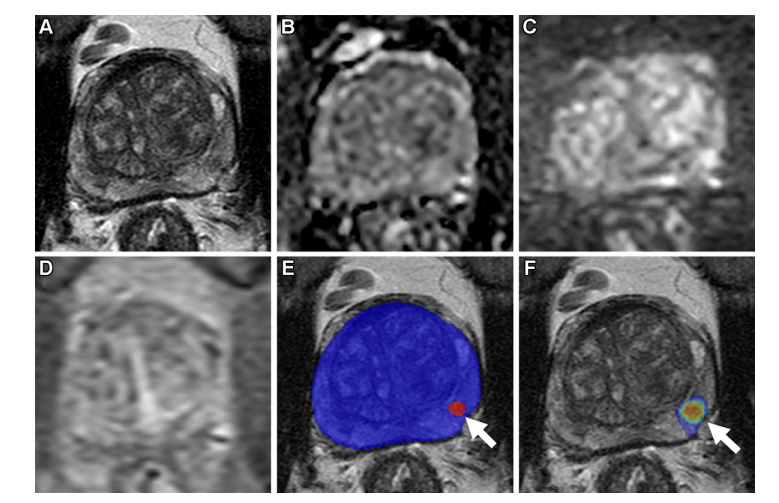
Figure 4: Axial multiparametric MRI scans in a 64-year-old male participant with a serum prostate-specific antigen level of 8.1 ng/mL: (A)T2-weighted image, (B) apparent diffusion coefficient map, (C) high-b-value diffusion-weighted image (b = 1500 sec/mm2 ), (D) dynamic contrastenhanced image (frame 45 of 54 acquired at 5.6-second intervals), (E) T2-weighted image with artificial intelligence (AI) prediction map overlaid (red contour is positive prediction; blue contour is AI prostate organ segmentation), and (F) T2-weighted image with AI probability map overlaid (red indicates higher probability). No distinct lesion was detected by the radiologist (Prostate Imaging Reporting and Data System category 1). One lesion was called by the AI algorithm in the left midgland peripheral zone (arrow in E and F), representing a false positive based on the radiologist ground truth. Systematic biopsy obtained from this site (left midgland lateral) was positive for Gleason score 7 (3 + 4) prostate adenocarcinoma.
图4: 一名64岁男性参与者的轴向多参数MRI扫描,血清前列腺特异性抗原(PSA)水平为8.1 ng/mL:(A) T2加权图像,(B) 表观扩散系数图,(C) 高b值扩散加权图像(b = 1500 sec/mm²),(D) 动态对比增强图像(在5.6秒间隔内获取的54帧中的第45帧),(E) 覆盖人工智能(AI)预测图的T2加权图像(红色轮廓为阳性预测;蓝色轮廓为AI前列腺器官分割),以及(F) 覆盖AI概率图的T2加权图像(红色表示更高的概率)。放射科医生未检测到明显病灶(前列腺影像报告与数据系统类别1)。AI算法在左侧腺体中部外围区检测到一个病灶(E和F中的箭头),根据放射科医生的标准,该病灶被认为是假阳性。来自该部位(左侧腺体中部外侧)的系统性活检结果显示,确诊为Gleason评分7(3 + 4)的前列腺腺癌。

Figure 5: Axial multiparametric MRI scans in a 69-year-old male participant with a serum prostate-specific antigen level of 7.3 ng/mL: (A)T2-weighted image, (B) apparent diffusion coefficient map, (C) high-b-value diffusion-weighted image (b = 1500 sec/mm2 ), (D) dynamic contrastenhanced image (frame 25 of 54 acquired at 5.6-second intervals), (E) T2-weighted image with artificial intelligence (AI) prediction map overlaid (red contour is positive prediction; blue contour is AI prostate organ segmentation), and (F) T2-weighted image with AI probability map overlaid (red indicates higher probability). One lesion was called by the AI algorithm in the left midgland anterior transition zone (arrow in E and F), representing a false positive based on the radiologist ground truth. A systematic biopsy sample obtained from this site (left midgland medial) was benign.
图5: 一名69岁男性参与者的轴向多参数MRI扫描,血清前列腺特异性抗原(PSA)水平为7.3 ng/mL:(A) T2加权图像,(B) 表观扩散系数图,(C) 高b值扩散加权图像(b = 1500 sec/mm²),(D) 动态对比增强图像(在5.6秒间隔内获取的54帧中的第25帧),(E) 覆盖人工智能(AI)预测图的T2加权图像(红色轮廓为阳性预测;蓝色轮廓为AI前列腺器官分割),以及(F) 覆盖AI概率图的T2加权图像(红色表示更高的概率)。AI算法在左侧腺体中部前方过渡区检测到一个病灶(E和F中的箭头),根据放射科医生的标准,该病灶被认为是假阳性。从该部位(左侧腺体中部内侧)获取的系统性活检样本为良性。
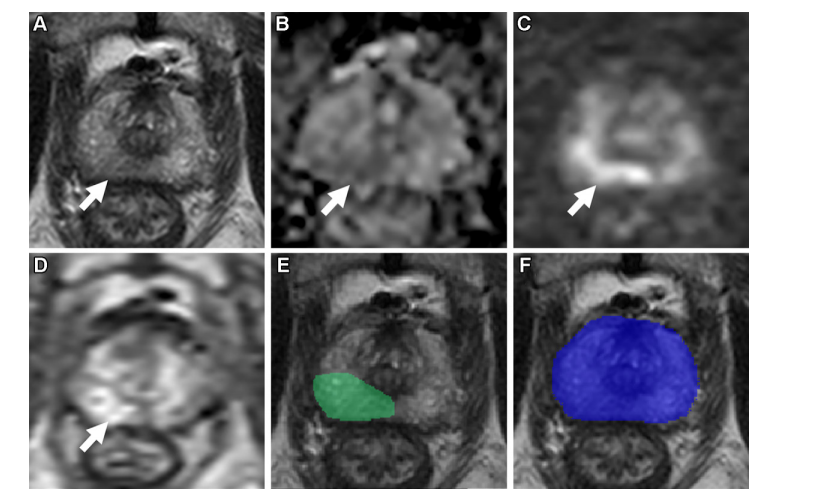
Figure 6: Axial multiparametric MRI scans in a 74-year-old male participant with a serum prostate-specific antigen level of 12.9 ng/mL: (A) T2-weighted image, (B) apparent diffusion coefficient map, (C) high-b-value diffusion-weighted image (b = 1500 sec/mm2 ), (D) dynamic contrast-enhanced image (frame 16 of 54 acquired at 5.6-second intervals), (E) T2-weighted image with radiologist-segmented lesion (green contour) overlaid, and (F) T2-weighted image with artificial intelligence (AI) prediction map overlaid (no positive prediction; blue contour is AI prostate organ segmentation). One lesion was detected by the radiologist and represented the ground truth. The lesion (1.9 cm; arrow in A–D) was in the right apical midgland peripheral zone and was designated Prostate Imaging Reporting and Data System category 4. This lesion was missed by the AI algorithm, representing a false negative. A targeted biopsy sample obtained from the lesion was positive for Gleason score 7 (3 + 4) prostate adenocarcinoma.
图6: 一名74岁男性参与者的轴向多参数MRI扫描,血清前列腺特异性抗原(PSA)水平为12.9 ng/mL:(A) T2加权图像,(B) 表观扩散系数图,(C) 高b值扩散加权图像(b = 1500 sec/mm²),(D) 动态对比增强图像(在5.6秒间隔内获取的54帧中的第16帧),(E) 覆盖放射科医生分割病灶(绿色轮廓)的T2加权图像,(F) 覆盖人工智能(AI)预测图的T2加权图像(无阳性预测;蓝色轮廓为AI前列腺器官分割)。放射科医生检测到一个病灶,并作为标准。病灶(1.9厘米;A–D中的箭头)位于右侧顶端腺体中部外围区,被指定为前列腺影像报告与数据系统(PI-RADS)类别4。该病灶被AI算法遗漏,属于假阴性。从该病灶获取的靶向活检样本显示为Gleason评分7(3 + 4)的前列腺腺癌。
Table
表
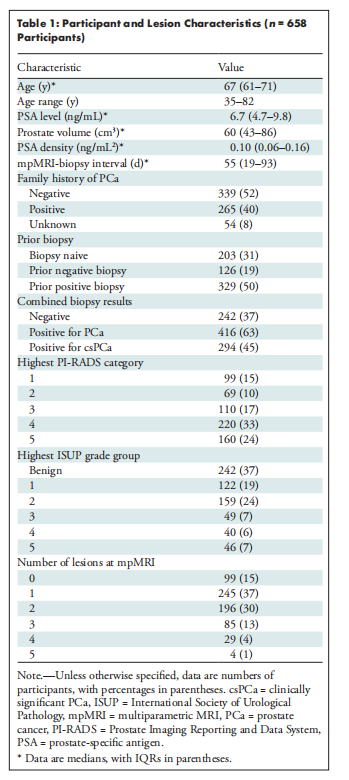
Table 1: Participant and Lesion Characteristics (n = 658 Participants)
表1: 参与者及病灶特征(n = 658名参与者)
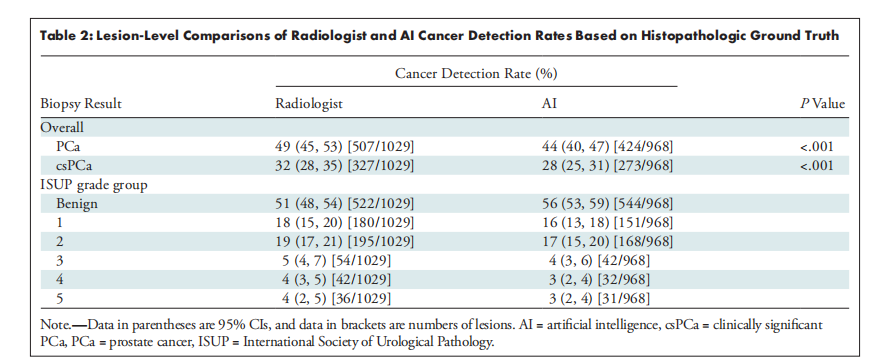
Table 2: Lesion-Level Comparisons of Radiologist and AI Cancer Detection Rates Based on Histopathologic Ground Truth
表2: 基于组织病理学标准的放射科医生与AI癌症检测率的病灶级比较
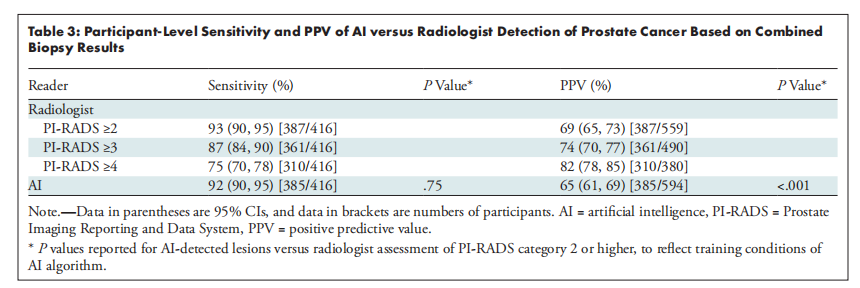
Table 3: Participant-Level Sensitivity and PPV of AI versus Radiologist Detection of Prostate Cancer Based on Combined Biopsy Results
表3: 基于联合活检结果的AI与放射科医生检测前列腺癌的参与者级敏感性和阳性预测值(PPV)比较
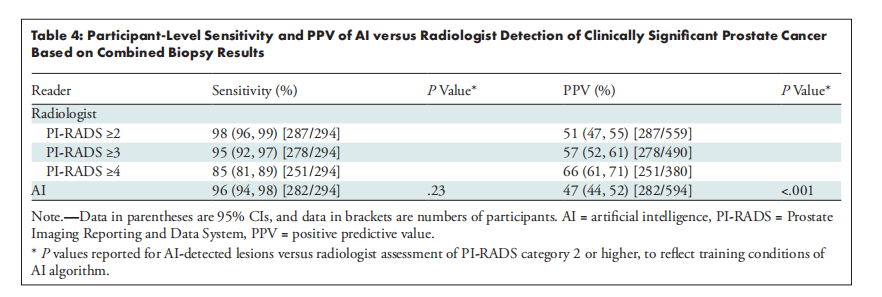
Table 4: Participant-Level Sensitivity and PPV of AI versus Radiologist Detection of Clinically Significant Prostate Cancer Based on Combined Biopsy Results
表4: 基于联合活检结果的AI与放射科医生检测临床意义显著的前列腺癌的参与者级敏感性和阳性预测值(PPV)比较
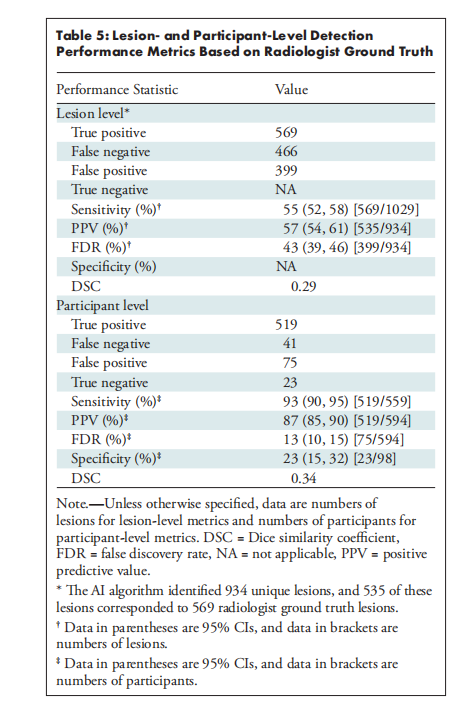
Table 5: Lesion- and Participant-Level Detection Performance Metrics Based on Radiologist Ground Truth
表5: 基于放射科医生标准的病灶级和参与者级检测性能指标