这一期来美化我们仅有的三个可视化图形(可怜),毕竟,帅是一辈子的事。
1 折线图改面积图(渐变色)
需求:折线图改为蓝色的面积图,并且有一点的渐变色。
这个非常简单,只需要修改LineChart.vue的series部分,添加一个属性:
            areaStyle: {
              opacity: 0.8,
              color: new echarts.graphic.LinearGradient(0, 0, 0, 1, [
                {
                  offset: 0,
                  color: 'rgba(80,215,237,0.99)'
                },
                {
                  offset: 1,
                  color: 'rgb(28,70,206)'
                }
              ])
            },
就实现了一个渐变色的面积图了:

2 柱状图
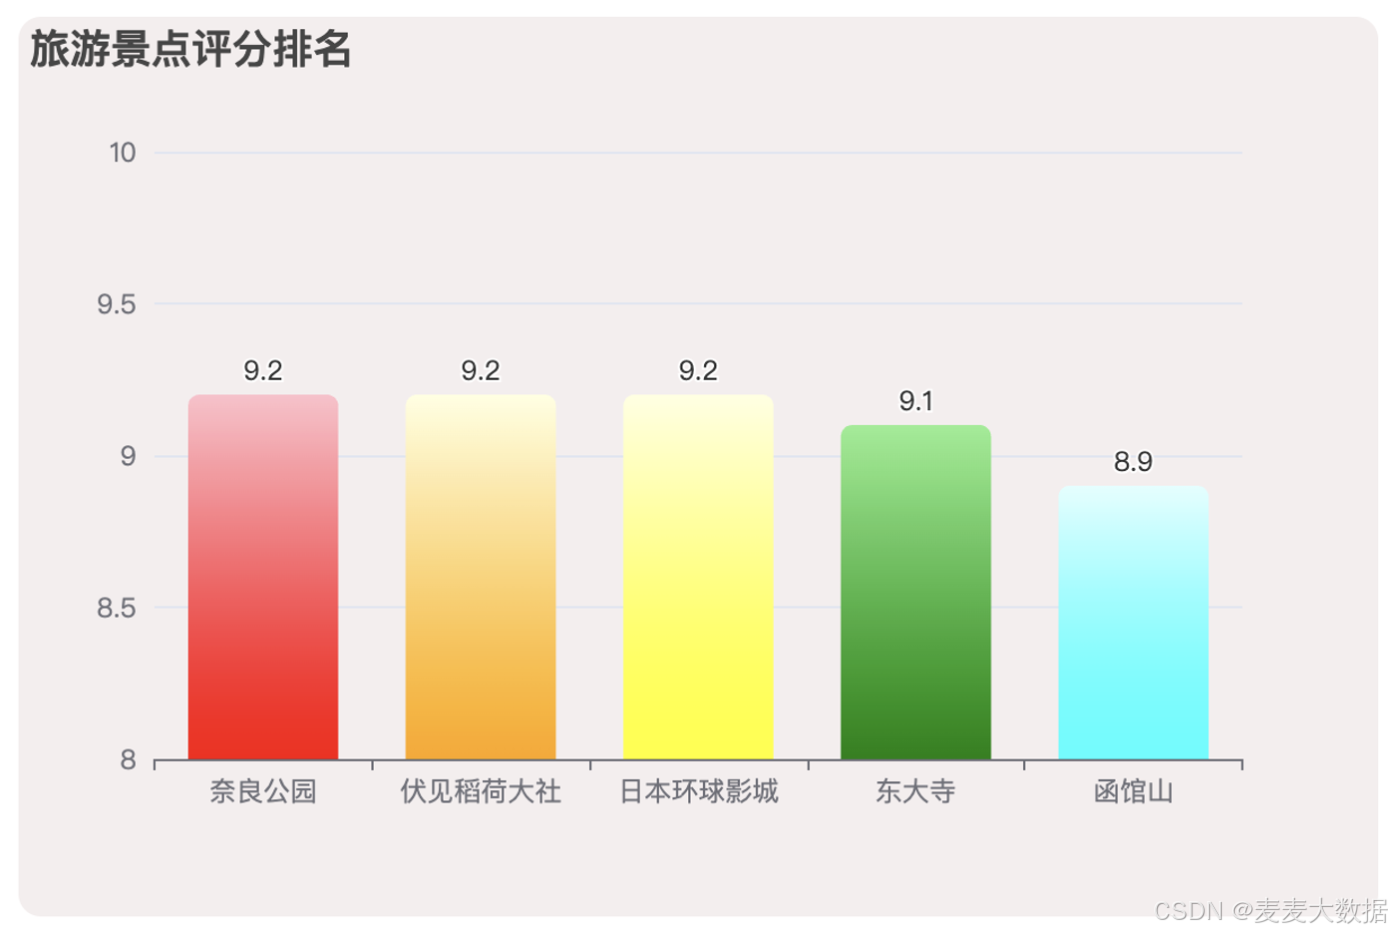
需求:柱状图五个柱子的颜色不同,并且带有渐变色,柱子是圆角的并且文字显示在柱子上方。
这个实现也纯粹是echarts的设置问题。
series: [
          {
            name: '评分',
            type: 'bar',
            data: [8.5, 9.0, 7.5, 9.3, 8.0],
            label: {
              show: true,
              position: 'top'
            },
            itemStyle: {
              borderRadius: [5, 5, 0, 0], // 设置柱子的圆角
              color: (params) => {
                // 定义每根柱子的渐变色
                const colorList = [
                  new echarts.graphic.LinearGradient(0, 0, 0, 1, [
                    { offset: 1, color: 'red' },
                    { offset: 0, color: 'pink' }
                  ]),
                  new echarts.graphic.LinearGradient(0, 0, 0, 1, [
                    { offset: 1, color: 'orange' },
                    { offset: 0, color: 'lightyellow' }
                  ]),
                  new echarts.graphic.LinearGradient(0, 0, 0, 1, [
                    { offset: 1, color: 'yellow' },
                    { offset: 0, color: 'lightyellow' }
                  ]),
                  new echarts.graphic.LinearGradient(0, 0, 0, 1, [
                    { offset: 1, color: 'green' },
                    { offset: 0, color: 'lightgreen' }
                  ]),
                  new echarts.graphic.LinearGradient(0, 0, 0, 1, [
                    { offset: 1, color: 'cyan' },
                    { offset: 0, color: 'lightcyan' }
                  ])
                ];
                return colorList[params.dataIndex];
              }
            },
          },
        ],
实现效果:

3 饼图
需求:饼图可以选中,并且默认选中景点最多的城市,并且具体的数据在文字后面可以显示。
这个需要开启select模式设置才有用,开启后就可以选中饼图了,默认的选中模式需要在获取数据的时候找到数据最大的那个,并且设置selected=true
series: [{
          type: 'pie',
          selectedMode: 'single', //注意这个必须有,否则设置selected无效
          data: [
            {name:'东京',value:104},
            {name:'大阪',value:81},
            {name:'京都',value:47},
            {name:'横滨',value:51},
            {name:'名古屋',value:62}],
          label: {
            normal: {
              position: 'outside', // 标签显示在饼图外部
              formatter: '{b}({d}%)' // 标签格式
            }
          },
        }]

   mounted() {
    getCityRank().then(res => {
      // 获取最大值对应的索引
      const maxIndex = res.data.data.findIndex(item => item.value === Math.max(...res.data.data.map(i => i.value)));

      // 选中最大值对应的扇区
      this.chartOptions.series[0].data = res.data.data
      this.chartOptions.series[0].data[maxIndex].selected = true;
    })
  }
实现效果:

4 展望
下一期开始,我们来做数据的增删改查对接 ✅


