本文由ScriptEcho平台提供技术支持
项目地址:传送门
使用 uPlot 在 Vue 中创建交互式图表
应用场景介绍
uPlot 是一个轻量级、高性能的图表库,适用于创建各种交互式图表。它具有丰富的功能,包括可自定义的轴、网格、刻度和交互性。本篇博客将介绍如何使用 uPlot 在 Vue 中创建交互式图表。
代码基本功能介绍
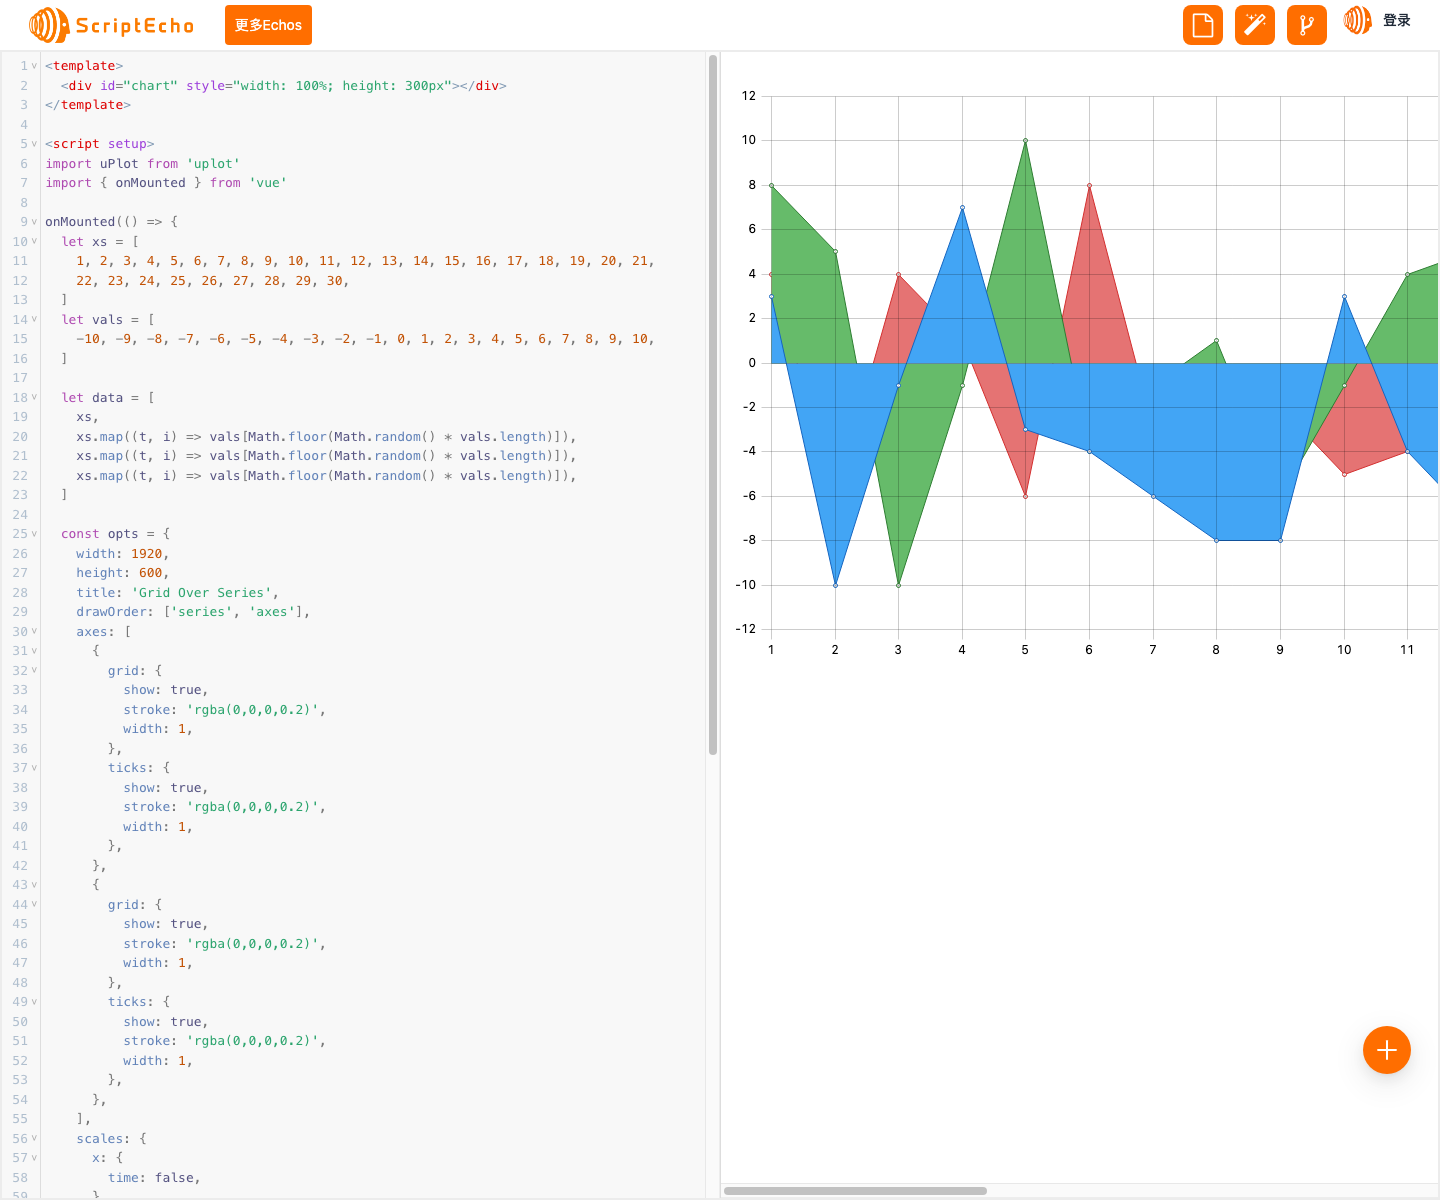
本例代码展示了如何使用 uPlot 创建一个带有网格、轴和多个系列的交互式折线图。用户可以与图表进行交互,例如缩放、平移和悬停以查看数据点的详细信息。
功能实现步骤及关键代码分析
1. 安装依赖项
首先,我们需要安装 uPlot 和 Vue:
npm install uplot vue
2. 引入依赖项
在 Vue 组件中,我们引入 uPlot 和 Vue 的 onMounted 钩子:
import uPlot from 'uplot'
import { onMounted } from 'vue'
3. 生成数据
onMounted 钩子中,我们生成了一组随机数据点,并将它们存储在 data 数组中:
let xs = [1, 2, 3, 4, 5, 6, 7, 8, 9, 10, 11, 12, 13, 14, 15, 16, 17, 18, 19, 20, 21,
  22, 23, 24, 25, 26, 27, 28, 29, 30]
let vals = [-10, -9, -8, -7, -6, -5, -4, -3, -2, -1, 0, 1, 2, 3, 4, 5, 6, 7, 8, 9, 10]

let data = [
  xs,
  xs.map((t, i) => vals[Math.floor(Math.random() * vals.length)]),
  xs.map((t, i) => vals[Math.floor(Math.random() * vals.length)]),
  xs.map((t, i) => vals[Math.floor(Math.random() * vals.length)]),
]
4. 配置图表选项
接下来,我们配置 uPlot 的选项:
const opts = {
  width: 1920,
  height: 600,
  title: 'Grid Over Series',
  drawOrder: ['series', 'axes'],
  axes: [
    {
      grid: {
        show: true,
        stroke: 'rgba(0,0,0,0.2)',
        width: 1,
      },
      ticks: {
        show: true,
        stroke: 'rgba(0,0,0,0.2)',
        width: 1,
      },
    },
    {
      grid: {
        show: true,
        stroke: 'rgba(0,0,0,0.2)',
        width: 1,
      },
      ticks: {
        show: true,
        stroke: 'rgba(0,0,0,0.2)',
        width: 1,
      },
    },
  ],
  scales: {
    x: {
      time: false,
    },
  },
  series: [
    {},
    {
      stroke: '#D32F2F',
      fill: '#E57373',
      //	width: 5,
      points: {
        //		size: 10,
      },
    },
    {
      stroke: '#2E7D32',
      fill: '#66BB6A',
      points: {
        //		size: 10,
      },
    },
    {
      stroke: '#1565C0',
      fill: '#42A5F5',
      points: {
        //		size: 10,
      },
    },
  ],
}
此配置指定了图表的大小、标题、网格和轴的样式以及系列的颜色和样式。
5. 创建图表
最后,我们使用 new uPlot() 构造函数创建图表:
let u = new uPlot(opts, data, document.getElementById('chart'))
此行代码将图表渲染到 #chart 元素中。
总结与展望
通过本例代码,我们展示了如何使用 uPlot 在 Vue 中创建交互式图表。uPlot 提供了丰富的功能和高度的可定制性,使我们能够创建各种类型的图表。
未来,我们可以进一步扩展此代码以支持更多的交互功能,例如数据筛选、导出和动态数据更新。此外,我们可以探索 uPlot 的其他高级功能,例如自定义工具提示和缩放行为。
更多组件:


获取更多Echos
本文由ScriptEcho平台提供技术支持
项目地址:传送门
扫码加入AI生成前端微信讨论群:


