在14年的时候,oncoPredict函数的开发团队在Genome Biology上发了一篇文章。
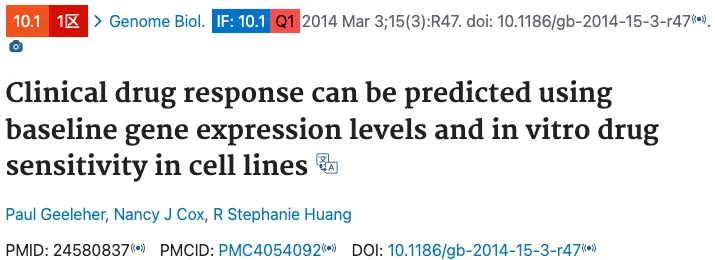
这篇文章的核心目的是阐释了使用治疗前基线肿瘤基因表达数据去预测患者化疗反应。开发团队发现使用细胞系去预测临床样本的药物反应是可行的。
鉴于之前的理论,该研究团队首先提出了pRRophetic算法用于评价不同药物治疗临床样本的敏感性。

之后再原有的基础之上,该研究团队提出了R包oncoPredict。
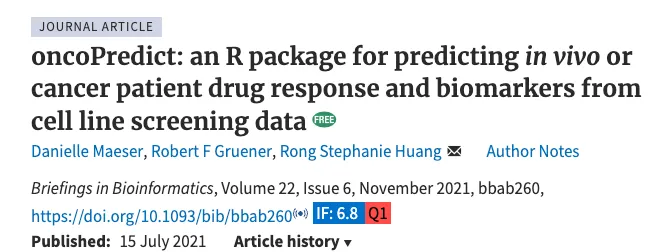
该R包的优势主要有两个,分别是预测患者的临床药物反应和将这些预测与临床特征关联起来从而发现有价值的生物标志物。
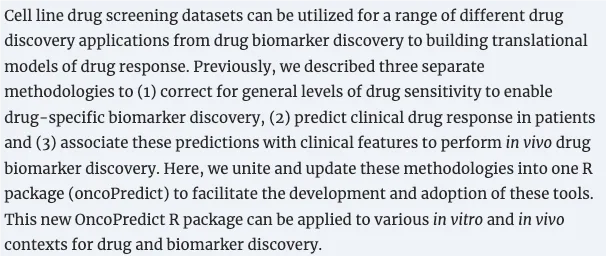
其中使用最多的就是去预测患者的临床药物反应,其中的函数是calcPhenotype,这个功能是使用基线肿瘤基因表达数据,实现了预测临床药物反应。该函数使用了大规模基因表达和药物筛选数据(训练数据集)来构建了Ridge regression模型,然后将其应用于新的基因表达数据集(测试数据集),以产生新的药物敏感性分析结果。
开发团队也提示使用者除了可以用他们预打包的GDSC或CTRP数据作为训练数据集,也可以使用自己的训练数据从而预测任何表达矩阵情况下的药物反应。
在使用该分析流程之前,需要去https://osf.io/c6tfx/ 下载DataFile文件夹下作者准备好的数据,用作药物预测的训练集。
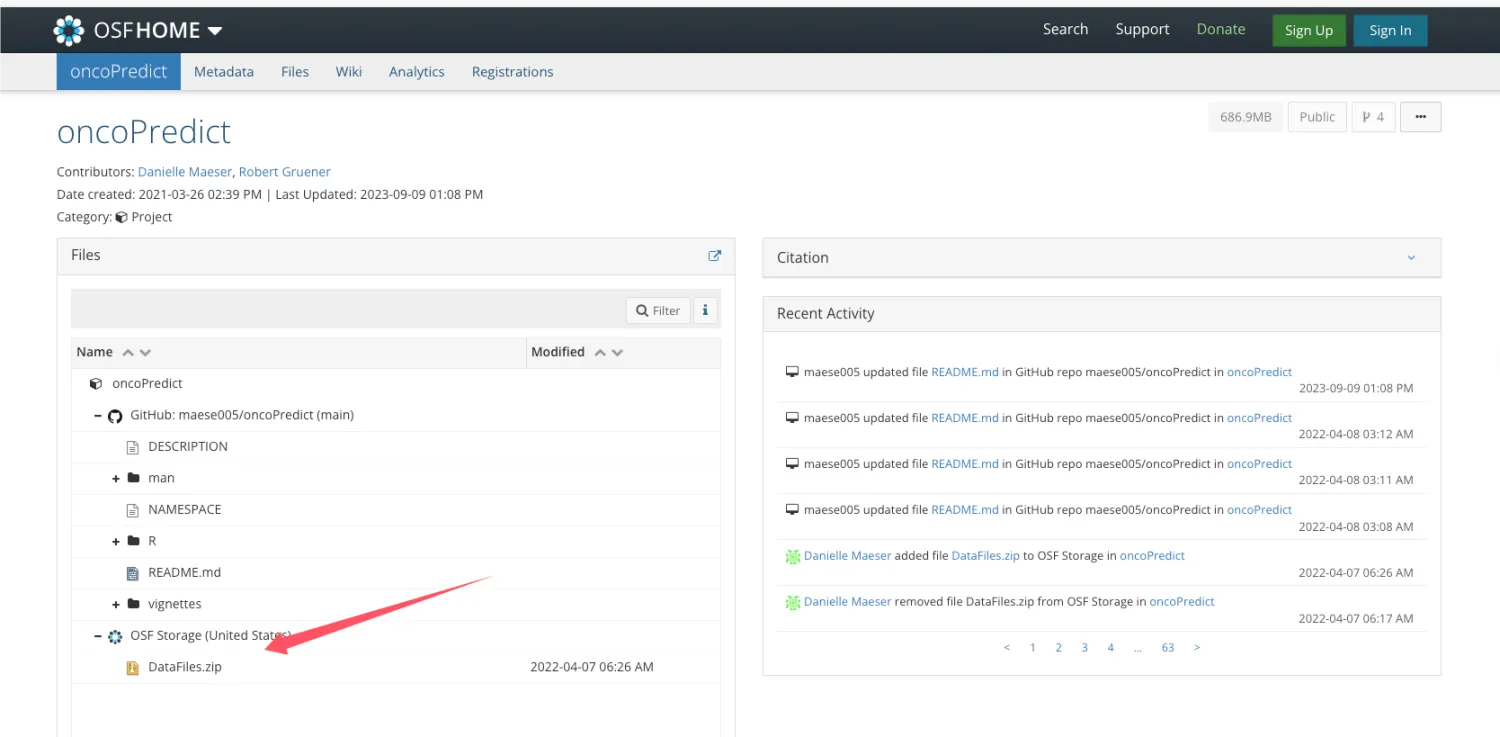
这里边有两个重要的数据库的数据,分别是CTRP和GDSC。
CTRP全称是癌症治疗反应门户(https://portals.broadinstitute.org/ctrp/),其通过连接癌细胞系的基因、家族以及其他细胞特征与小分子药物敏感性信息进而加速与患者相匹配的癌症治疗药物的发现。

GDSC全称是癌症药物敏感性基因组学数据库(https://www.cancerrxgene.org/),该数据库时关于癌症细胞药物敏感性和分子标志物信息的最大公共数据库之一,该数据库整合了细胞、药物和分子的三个不同层次,阐述了不同肿瘤细胞对药物的敏感性。
分析步骤
1、加载R包和数据
rm(list = ls())
library(oncoPredict)
library(data.table)
library(gtools)
library(reshape2)
library(ggpubr)
library(openxlsx)

dir.create("onco_drug")
setwd("onco_drug")

dir='~/Training Data/'
dir(dir)

# [1] "CTRP2_Expr (RPKM, not log transformed).rds"
# [2] "CTRP2_Expr (TPM, not log transformed).rds"
# [3] "CTRP2_Res.rds"
# [4] "GDSC1_Expr (RMA Normalized and Log Transformed).rds"
# [5] "GDSC1_Res.rds"
# [6] "GDSC2_Expr (RMA Normalized and Log Transformed).rds"
# [7] "GDSC2_Res.rds"
2、选择训练集数据
# GDSC2数据
#exp = readRDS(file=file.path(dir,'GDSC2_Expr (RMA Normalized and Log Transformed).rds'))
#exp[1:4,1:4]
#dim(exp)
#drug = readRDS(file = file.path(dir,"GDSC2_Res.rds"))
#drug <- exp(drug) #下载到的数据是被log转换过的,用这句代码逆转回去
#drug[1:4,1:4]
#dim(drug)
#identical(rownames(drug),colnames(exp))

#CTRP2数据
exp <- readRDS(file = file.path(dir,"CTRP2_Expr (TPM, not log transformed).rds"))
exp[1:4,1:4]
dim(exp)
drug <- readRDS(file = file.path(dir,"CTRP2_Res.rds"))
drug[1:4,1:4]
identical(rownames(drug),colnames(exp))
两个数据库的数据都可以使用,CTRP2中的数据会多一点。
drug是药物IC50值,exp是对应细胞系基因的表达矩阵。
3、导入表达矩阵数据并进行分析-这一步会耗费很长时间
load("~/TCGA-LIHC_sur_model.Rdata")
test = exprSet

calcPhenotype(trainingExprData = exp,
                trainingPtype = drug,
                testExprData = test,
                batchCorrect = 'standardize',  #   "eb" for array,standardize  for rnaseq
                powerTransformPhenotype = TRUE,
                removeLowVaryingGenes = 0.2,
                minNumSamples = 10,
                printOutput = TRUE,
                removeLowVaringGenesFrom = 'rawData' )
4、查看结果
# 运行之后的结果,被存在固定文件夹calcPhenotype_Output下。文件名也是固定的DrugPredictions.csv。
testPtype <- read.csv('./calcPhenotype_Output/DrugPredictions.csv',
                      row.names = 1,check.names = F)
testPtype[1:4, 1:4]
dim(testPtype)
identical(colnames(testPtype),colnames(drug))
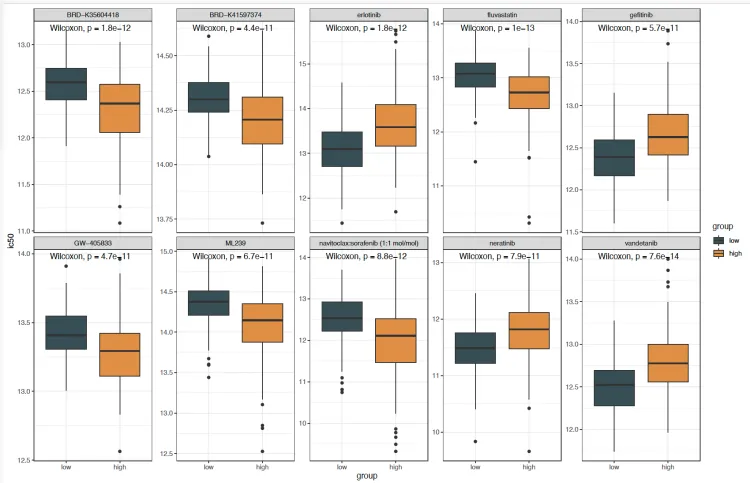
5、结合高低风险分组画图
# 需参照这个代码自行修改哦~

load("~/model_parameters.Rdata")
TCGA_LIHC <- rs[[1]]
identical(rownames(TCGA_LIHC),colnames(exprSet))
TCGA_LIHC$group <- ifelse(TCGA_LIHC$RS > median(TCGA_LIHC$RS),"high","low")
TCGA_LIHC$group <- factor(TCGA_LIHC$group,levels = c("low","high"))
rsurv <- TCGA_LIHC


identical(rownames(testPtype),rownames(rsurv))
a = apply(testPtype, 2, function(x){
  #x = testPtype[,1]
   wilcox.test(x~rsurv$group)$p.value
})
head(a)
#p值最小的10个药物
dg = names(head(sort(a),10))

library(tinyarray)
library(tidyr)
library(dplyr)
library(ggplot2)
library(ggpubr)
library(ggsci)

group <- rsurv$group
testPtype[,dg] %>%
  bind_cols(group = group) %>%
  pivot_longer(1:10,names_to = "drugs",values_to = "ic50")  %>%
ggplot(., aes(group,ic50))+
  geom_boxplot(aes(fill=group))+
  scale_fill_jama()+
  theme(axis.text.x = element_text(angle = 45,hjust = 1),
        axis.title.x = element_blank(),
        legend.position = "none")+
  facet_wrap(vars(drugs),scales = "free_y",nrow = 2)+
  stat_compare_means()+
  theme_bw()
ggsave("box_drug.pdf",width = 14,height = 9)
致谢:感谢曾老师,小洁老师以及生信技能树团队全体成员。
注:若对内容有疑惑或者有发现明确错误的朋友,请联系后台(欢迎交流)。更多内容可关注公众号:生信方舟
- END -


