前言
系列专栏:【深度学习:算法项目实战】✨︎
涉及医疗健康、财经金融、商业零售、食品饮料、运动健身、交通运输、环境科学、社交媒体以及文本和图像处理等诸多领域,讨论了各种复杂的深度神经网络思想,如卷积神经网络、循环神经网络、生成对抗网络、门控循环单元、长短期记忆、自然语言处理、深度强化学习、大型语言模型和迁移学习。
随着金融市场的日益复杂和全球化,投资者们对于准确预测股票价格的需求愈发迫切。然而,股票市场的波动受到众多因素的影响,包括宏观经济状况、公司财务状况、市场情绪等,这使得股票价格的预测成为了一个复杂且具有挑战性的任务。
近年来,深度学习技术的快速发展为股票价格预测提供了新的思路和方法。双向长短期记忆(BiLSTM)网络作为深度学习中的一种重要模型,具有强大的序列建模能力,能够捕捉数据中的长期依赖关系。因此,将BiLSTM应用于股票单变量时间序列预测,有望提高预测的准确性和稳定性。
本文旨在探讨基于PyTorch框架的BiLSTM模型在股票单变量时间序列预测中的应用。首先,我们将介绍金融时间序列数据的特点和预处理方法,包括数据的标准化、去噪和特征提取等。然后,我们将详细阐述BiLSTM模型的构建过程,包括模型架构的设计、参数的选择和优化算法的应用等。接着,我们将通过具体的实验来验证BiLSTM模型在股票预测任务中的有效性,并与传统的时间序列预测方法进行比较。最后,我们将对实验结果进行分析和讨论,探讨BiLSTM模型在股票预测中的优势和不足,并展望未来的研究方向。
BiLSTM 单变量时间序列预测
- 1. 股票时间序列数据
- 1.1 数据预处理
- 1.2 探索性分析(可视化)
- 1.2.1 股票的日收盘价
- 1.2.2 股票的日交易量
- 1.2.3 股票的日收益率
- 1.2.4 股票价格相关性
- 1.2.5 股票的风险价值
- 2. 时间数据特征工程(APPL)
- 2.1 构造序列数据
- 2.2 特征缩放(归一化)
- 2.3 数据集划分(TimeSeriesSplit)
- 2.4 数据集张量(TensorDataset)
- 3. 构建时间序列模型(BiLSTM)
- 3.1 构建双向 LSTM 模型
- 3.2 定义模型、损失函数与优化器
- 4. 模型训练与可视化
- 4.1 训练过程
- 4.2 Loss 可视化
- 5. 模型评估与可视化
- 5.1 评估指标(MAE、RMSE、MAPE、R2)
- 5.2 反归一化
- 5.3 结果可视化
- 6. 模型预测
- 6.1 转换最新时间步收盘价的数组为张量
- 6.2 预测下一个时间点的收盘价格
- 参考链接
1. 股票时间序列数据
股票时间序列数据是指按照时间顺序排列的关于股票市场的历史数据。这些数据记录了股票市场在不同时间点上的各种信息,如股票的开盘价、最高价、最低价、收盘价、成交量等。时间序列数据是金融市场分析的重要基础,因为它们反映了市场参与者的行为、市场供求关系以及宏观经济和政策的影响等因素。
import numpy as np
import pandas as pd
import matplotlib.pyplot as plt
import seaborn as sns

from sklearn.preprocessing import MinMaxScaler
from sklearn.model_selection import TimeSeriesSplit

import torch
import torch.nn as nn
from torch.utils.data import DataLoader, TensorDataset
from torchinfo import summary
from tqdm import tqdm
1.1 数据预处理
pandas.to_datetime 函数将标量、数组、Series 或 DataFrame/dict-like 转换为 pandas datetime 对象。
AAPL = pd.read_csv('AAPL.csv')
print(type(AAPL['Close'].iloc[0]),type(AAPL['Date'].iloc[0]))
# Let's convert the data type of timestamp column to datatime format
AAPL['Date'] = pd.to_datetime(AAPL['Date'])
print(type(AAPL['Close'].iloc[0]),type(AAPL['Date'].iloc[0]))

# Selecting subset
cond_1 = AAPL['Date'] >= '2021-04-23 00:00:00'
cond_2 = AAPL['Date'] <= '2024-04-23 00:00:00'
AAPL = AAPL[cond_1 & cond_2].set_index('Date')
print(AAPL.shape)
<class 'numpy.float64'> <class 'str'>
<class 'numpy.float64'> <class 'pandas._libs.tslibs.timestamps.Timestamp'>
(755, 6)
AMZN、GOOG、MSFT 处理方式与上述方式相同
1.2 探索性分析(可视化)
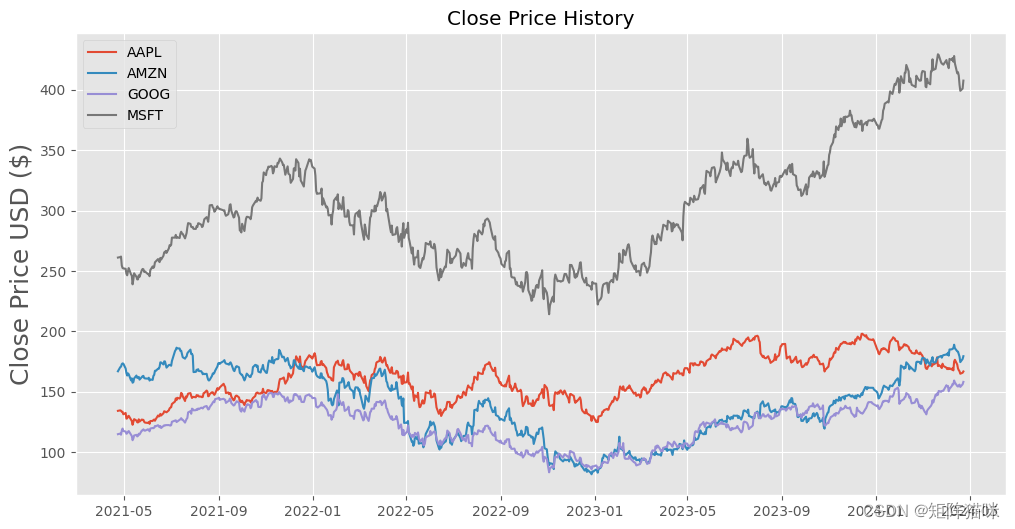
1.2.1 股票的日收盘价
收盘价是股票在正常交易日交易的最后价格。股票的收盘价是投资者用来跟踪其长期表现的标准基准。
# plt.style.available
plt.style.use('ggplot')
plt.figure(figsize=(12,6))
plt.title('Close Price History')
plt.plot(AAPL['Close'],label='AAPL')
plt.plot(AMZN['Close'],label='AMZN')
plt.plot(GOOG['Close'],label='GOOG')
plt.plot(MSFT['Close'],label='MSFT')
plt.ylabel('Close Price USD ($)', fontsize=18)
plt.legend()
plt.show()
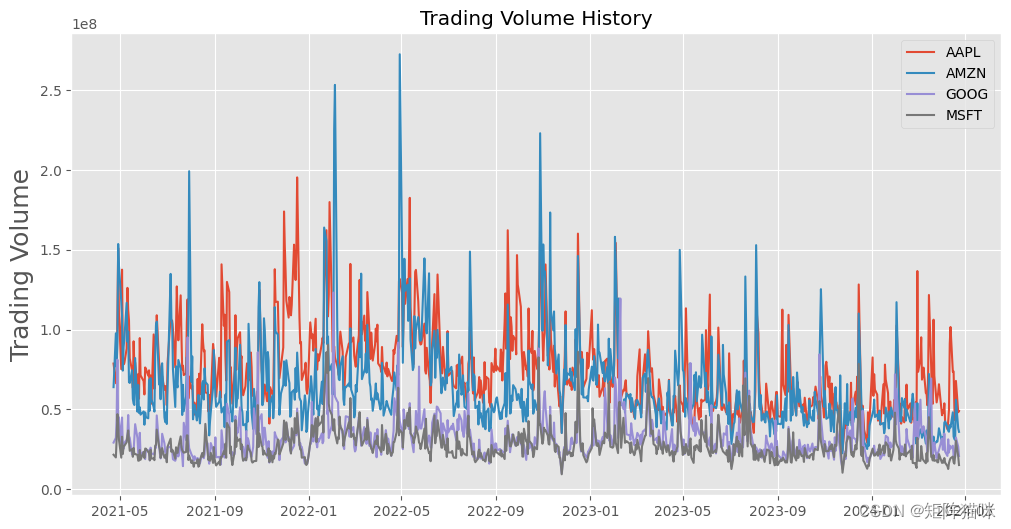
1.2.2 股票的日交易量
交易量是指一段时间内(通常是一天内)易手的资产或证券的数量。例如,股票交易量是指每天开盘和收盘之间交易的证券股票数量。交易量以及交易量随时间的变化是技术交易者的重要输入。
plt.figure(figsize=(12,6))
plt.title('Trading Volume History')
plt.plot(AAPL['Volume'],label='AAPL')
plt.plot(AMZN['Volume'],label='AMZN')
plt.plot(GOOG['Volume'],label='GOOG')
plt.plot(MSFT['Volume'],label='MSFT')
plt.ylabel('Trading Volume', fontsize=18)
plt.legend()
plt.show()
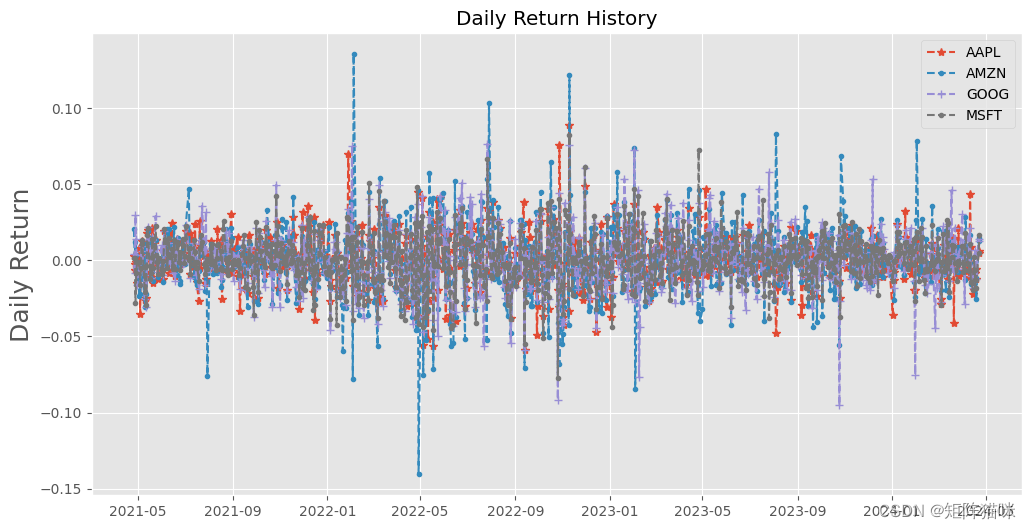
1.2.3 股票的日收益率
股票的日收益率是反映投资者在一天内从股票投资中获得的回报比例。它通常用百分比来表示,计算公式为:日收益率 = (今日收盘价 - 前一日收盘价) / 前一日收盘价 × 100%,这里我们可是使用 .pct_change() 函数来实现。
plt.figure(figsize=(12,6))
plt.title('Daily Return History')
plt.plot(AAPL['Adj Close'].pct_change(),linestyle='--',marker='*',label='AAPL')
plt.plot(AMZN['Adj Close'].pct_change(),linestyle='--',marker='.',label='AMZN')
plt.plot(GOOG['Adj Close'].pct_change(),linestyle='--',marker='+',label='GOOG')
plt.plot(MSFT['Adj Close'].pct_change(),linestyle='--',marker='.',label='MSFT')
plt.ylabel('Daily Return', fontsize=18)
plt.legend()
plt.show()
1.2.4 股票价格相关性
在金融和投资行业中,相关性是一种衡量两个变量相对于彼此移动程度的统计数据,其值必须介于-1.0和+1.0之间。相关性衡量关联,但不显示 x 是否导致 y,反之亦然,或者关联是否由第三个因素引起。1
现在让我们通过分析不同股票的收益率,来继续探索不同股票收盘价格之间的相关性。
rate1 = AAPL['Adj Close'].pct_change()
rate2 = AMZN['Adj Close'].pct_change()
rate3 = GOOG['Adj Close'].pct_change()
rate4 = MSFT['Adj Close'].pct_change()
df_rates = pd.concat(
    [rate1.rename('AAPL'),
     rate2.rename('AMZN'),
     rate3.rename('GOOG'),
     rate4.rename('MSFT')], axis=1)
df_rates.corr()
| AAPL | AMZN | GOOG | MSFT | |
|---|---|---|---|---|
| AAPL | 1.000000 | 0.592132 | 0.667637 | 0.709469 |
| AMZN | 0.592132 | 1.000000 | 0.656435 | 0.668468 |
| GOOG | 0.667637 | 0.656435 | 1.000000 | 0.717995 |
| MSFT | 0.709469 | 0.668468 | 0.717995 | 1.000000 |
现在我们可以比较两只股票的每日百分比回报率,以检查其相关性。
# We'll use joinplot to compare the daily returns of Google and Microsoft
sns.set_theme(style="darkgrid")

g = sns.jointplot(x="GOOG", y="MSFT", data=df_rates,
                  kind="reg", truncate=False,
                  color="m", height=8)
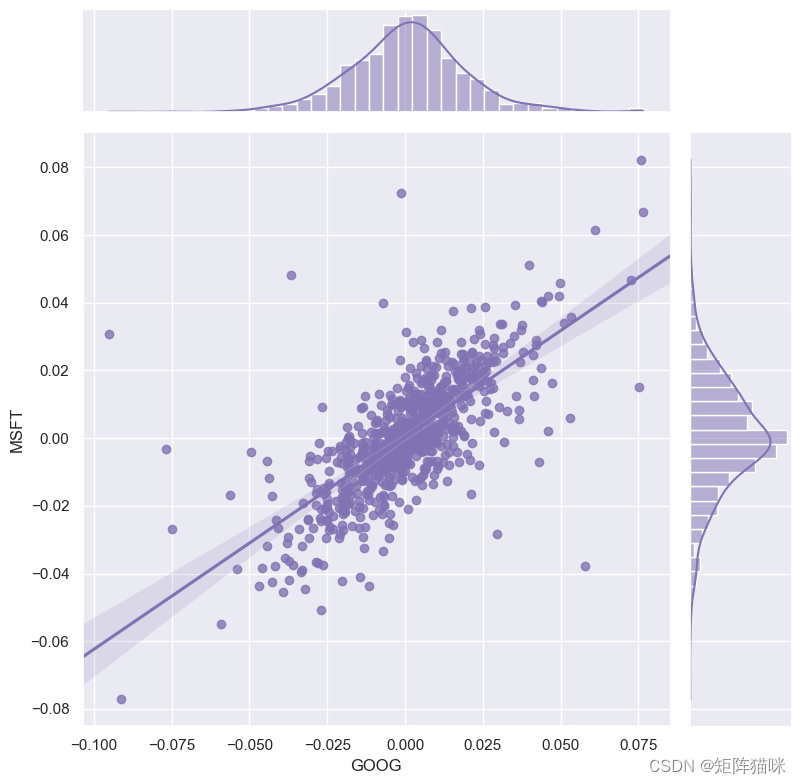
我们可以看到,如果两只股票完全(并且正)相互关联,那么它们的日收益率之间应该存在线性关系。
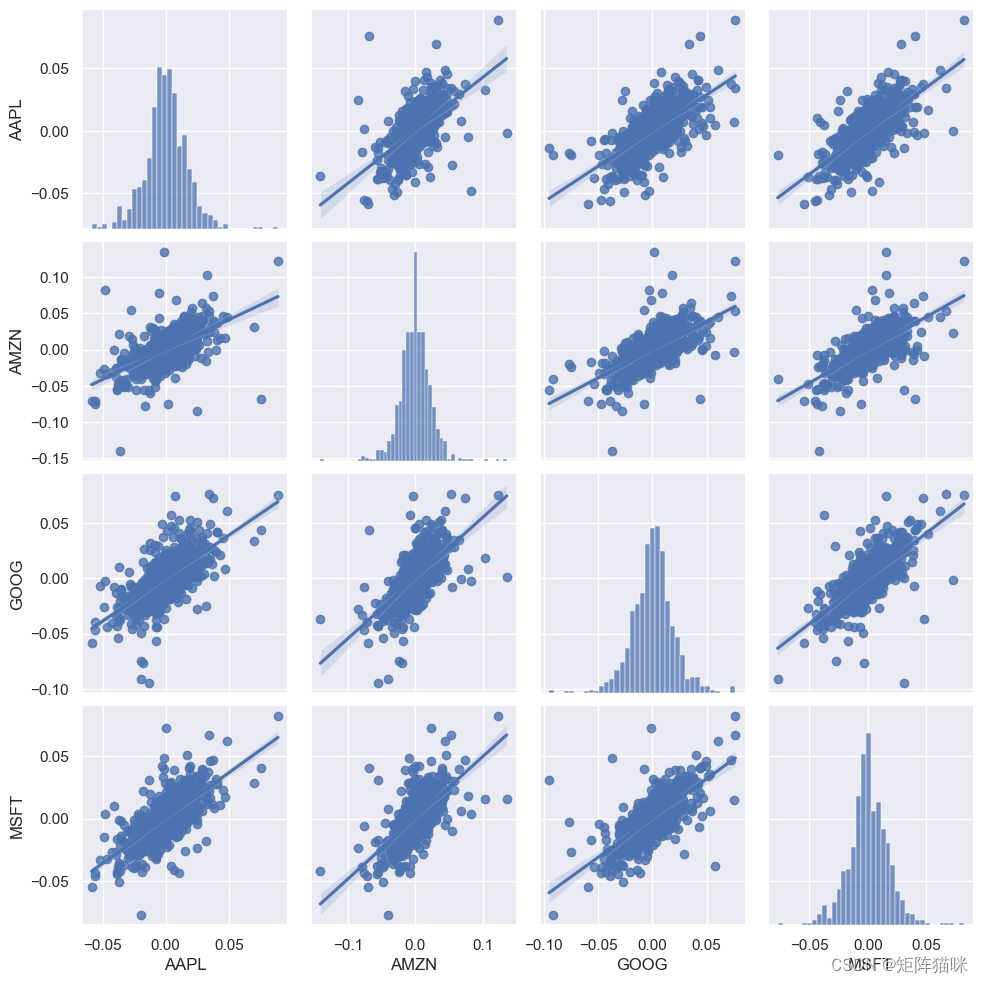
接下来使用sns.pairplot()绘制收益率数据集中的成对关系。
# Plot pairwise relationships in df_rates.
sns.pairplot(tech_rets, kind='reg')
最后,我们还可以绘制一个相关性热力图,以获得股票每日回报值之间相关性的实际数值
plt.figure(figsize=(12, 10))

plt.subplot(2, 2, 1)
sns.heatmap(df_rates.corr(), annot=True, cmap='Blues')
plt.title('Correlation of stock return')

plt.subplot(2, 2, 2)
sns.heatmap(df_close.corr(), annot=True, cmap='Blues')
plt.title('Correlation of stock closing price')

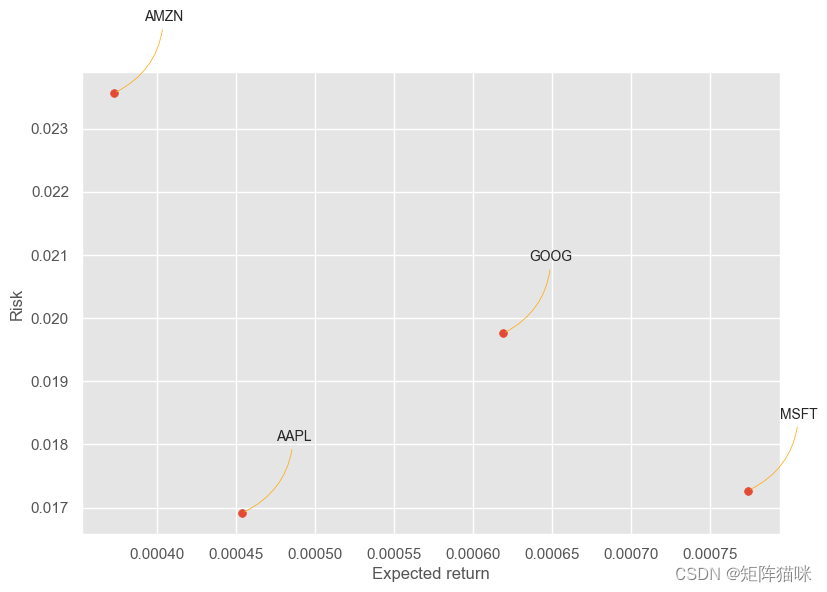
1.2.5 股票的风险价值
量化风险的方法有很多,其中一种最基本的方法是利用我们收集到的每日百分比收益信息,将预期收益与每日收益的标准差进行比较。
rets = df_rates.dropna()
area = np.pi * 10

plt.style.use('ggplot')
plt.figure(figsize=(9, 6))
plt.scatter(rets.mean(), rets.std(), s=area)
plt.xlabel('Expected return')
plt.ylabel('Risk')

for label, x, y in zip(rets.columns, rets.mean(), rets.std()):
    plt.annotate(label, xy=(x, y), xytext=(50, 50),
                 textcoords='offset points', ha='right', va='bottom',
                 arrowprops=dict(arrowstyle='-', color='orange', connectionstyle='arc3,rad=-0.3'))
2. 时间数据特征工程(APPL)
在时间序列分析中,时间窗口通常用于描述在训练模型时考虑的连续时间步 time steps 的数量。这个时间窗口的大小,即 window_size,对于模型预测的准确性至关重要。
具体来说,window_size 决定了模型在做出预测时所使用的历史数据的长度。例如,如果我们想要用前60天的股票数据来预测未来7天的收盘价,那么window_size 就是60。
# 设置时间窗口大小
window_size = 60
2.1 构造序列数据
该函数需要两个参数:dataset 和 lookback,前者是要转换成数据集的 NumPy 数组,后者是用作预测下一个时间段的输入变量的前一时间步数,默认设为 1。
# 构造序列数据函数
def create_dataset(dataset, lookback=1):
    """Transform a time series into a prediction dataset

    Args:
        dataset: A numpy array of time series, first dimension is the time steps
        lookback: Size of window for prediction
    """
    X, y = [], []
    for i in range(len(dataset)-lookback):
        feature = dataset[i:(i+lookback), 0]
        target = dataset[i + lookback, 0]
        X.append(feature)
        y.append(target)
    return np.array(X), np.array(y)
2.2 特征缩放(归一化)
MinMaxScaler() 函数主要用于将特征数据按比例缩放到指定的范围。默认情况下,它将数据缩放到[0, 1]区间内,但也可以通过参数设置将数据缩放到其他范围。在机器学习中,MinMaxScaler()函数常用于不同尺度特征数据的标准化,以提高模型的泛化能力。
# 选取AAPL['Close']作为特征, 归一化数据
scaler = MinMaxScaler(feature_range=(0, 1))
scaled_data = scaler.fit_transform(AAPL['Close'].values.reshape(-1, 1))
# 创建数据集
X, y = create_dataset(scaled_data, lookback=window_size)
# 重塑输入数据为[samples, time steps, features]
X = np.reshape(X, (X.shape[0], X.shape[1], 1))
2.3 数据集划分(TimeSeriesSplit)
TimeSeriesSplit() 函数与传统的交叉验证方法不同,TimeSeriesSplit 特别适用于需要考虑时间顺序的数据集,因为它确保测试集中的所有数据点都在训练集数据点之后,并且可以分割多个训练集和测试集。
# 使用TimeSeriesSplit划分数据集,根据需要调整n_splits
tscv = TimeSeriesSplit(n_splits=3, test_size=90)
# 遍历所有划分进行交叉验证
for i, (train_index, test_index) in enumerate(tscv.split(X)):
    X_train, X_test = X[train_index], X[test_index]
    y_train, y_test = y[train_index], y[test_index]
    # print(f"Fold {i}:")
    # print(f"  Train: index={train_index}")
    # print(f"  Test:  index={test_index}")

# 查看最后一个 fold 数据帧的维度
print(X_train.shape, X_test.shape, y_train.shape, y_test.shape)
(605, 60, 1) (90, 60, 1) (605,) (90,)
2.4 数据集张量(TensorDataset)
张量是一个多维数组或矩阵的数学对象,可以看作是向量和矩阵的推广。在深度学习中,张量通常用于表示输入数据、模型参数以及输出数据
# 将 NumPy数组转换为 tensor张量
X_train_tensor = torch.from_numpy(X_train).type(torch.Tensor)
X_test_tensor = torch.from_numpy(X_test).type(torch.Tensor)
y_train_tensor = torch.from_numpy(y_train).type(torch.Tensor).view(-1,1)
y_test_tensor = torch.from_numpy(y_test).type(torch.Tensor).view(-1,1)

print(X_train_tensor.shape, X_test_tensor.shape, y_train_tensor.shape, y_test_tensor.shape)
view() 函数用于重塑张量对象,它等同于 NumPy 中的 reshape() 函数,允许我们重组数据,以匹配 BiLSTM 模型所需的输入形状。以这种方式重塑数据可确保 BiLSTM 模型以预期格式接收数据。
torch.Size([605, 60, 1]) torch.Size([90, 60, 1]) torch.Size([605, 1]) torch.Size([90, 1])
接下来,我们将使用 TensorDataset 和 DataLoader创建数据集和数据加载器
train_dataset = TensorDataset(X_train_tensor, y_train_tensor)
train_loader = DataLoader(train_dataset, batch_size=32, shuffle=True)
test_dataset = TensorDataset(X_test_tensor, y_test_tensor)
test_loader = DataLoader(test_dataset, batch_size=32, shuffle=False)
shuffle=True 表示在每个epoch开始时,数据集将被随机打乱,这有助于防止模型在训练时过拟合。与训练数据加载器类似,shuffle=False 表示在测试时不需要打乱数据集。因为测试集通常用于评估模型的性能,而不是用于训练,所以不需要打乱。
3. 构建时间序列模型(BiLSTM)
双向LSTM(Bi-directional Long Short-Term Memory)网络可以通过使用 nn.LSTM 类并设置 bidirectional=True 参数来完成
PyTorch所提供的数学公式及解释如下:🔗
Apply a multi-layer long short-term memory (LSTM) RNN to an input sequence. For each element in the input sequence, each layer computes the following function:
i
t
=
σ
(
W
i
i
x
t
+
b
i
i
+
W
h
i
h
t
−
1
+
b
h
i
)
f
t
=
σ
(
W
i
f
x
t
+
b
i
f
+
W
h
f
h
t
−
1
+
b
h
f
)
g
t
=
tanh
(
W
i
g
x
t
+
b
i
g
+
W
h
g
h
t
−
1
+
b
h
g
)
o
t
=
σ
(
W
i
o
x
t
+
b
i
o
+
W
h
o
h
t
−
1
+
b
h
o
)
c
t
=
f
t
⊙
c
t
−
1
+
i
t
⊙
g
t
h
t
=
o
t
⊙
tanh
(
c
t
)
\begin{array}{ll} \\ i_t = \sigma(W_{ii} x_t + b_{ii} + W_{hi} h_{t-1} + b_{hi}) \\ f_t = \sigma(W_{if} x_t + b_{if} + W_{hf} h_{t-1} + b_{hf}) \\ g_t = \tanh(W_{ig} x_t + b_{ig} + W_{hg} h_{t-1} + b_{hg}) \\ o_t = \sigma(W_{io} x_t + b_{io} + W_{ho} h_{t-1} + b_{ho}) \\ c_t = f_t \odot c_{t-1} + i_t \odot g_t \\ h_t = o_t \odot \tanh(c_t) \\ \end{array}
it=σ(Wiixt+bii+Whiht−1+bhi)ft=σ(Wifxt+bif+Whfht−1+bhf)gt=tanh(Wigxt+big+Whght−1+bhg)ot=σ(Wioxt+bio+Whoht−1+bho)ct=ft⊙ct−1+it⊙gtht=ot⊙tanh(ct)
where
h
t
h_t
ht is the hidden state at time
t
t
t,
c
t
c_t
ct is the cell state at time
t
t
t,
x
t
x_t
xt is the input at time
t
t
t,
h
t
−
1
h_{t-1}
ht−1 is the hidden state of the layer at time
t
−
1
t-1
t−1 or the initial hidden state at time
0
0
0, and
i
t
i_t
it,
f
t
f_t
ft,
g
t
g_t
gt,
o
t
o_t
ot are the input, forget, cell, and output gates, respectively.
σ
\sigma
σ is the sigmoid function, and
⊙
\odot
⊙ is the Hadamard product.
In a multilayer LSTM, the input x t ( l ) x^{(l)}_t xt(l) of the l l l -th layer ( l ≥ 2 l \ge 2 l≥2) is the hidden state h t ( l − 1 ) h^{(l-1)}_t ht(l−1) of the previous layer multiplied by dropout δ t ( l − 1 ) \delta^{(l-1)}_t δt(l−1) where each δ t ( l − 1 ) \delta^{(l-1)}_t δt(l−1) is a Bernoulli random variable which is 0 0 0 with probability d r o p o u t dropout dropout.
If proj_size > 0 is specified, LSTM with projections will be used. This changes the LSTM cell in the following way. First, the dimension of
h
t
h_t
ht will be changed from hidden_size to proj_size (dimensions of
W
h
i
W_{hi}
Whi will be changed accordingly). Second, the output hidden state of each layer will be multiplied by a learnable projection matrix:
h
t
=
W
h
r
h
t
h_t = W_{hr}h_t
ht=Whrht. Note that as a consequence of this, the output of LSTM network will be of different shape as well. See Inputs/Outputs sections below for exact dimensions of all variables. You can find more details in https://arxiv.org/abs/1402.1128.
3.1 构建双向 LSTM 模型
class BiLSTM(nn.Module):
    def __init__(self, input_size, hidden_size, num_layers, output_size):
        # input_size 是输入特征的维度,hidden_size 是LSTM隐藏层神经单元维度(或称为隐藏状态的大小),
        # num_layers 是LSTM网络层数,output_size 是输出维度
        super(BiLSTM, self).__init__()
        # 通过调用 super(BiLSTM, self).__init__() 初始化父类 nn.Module
        self.hidden_size = hidden_size
        self.num_layers = num_layers
        self.lstm = nn.LSTM(input_size, hidden_size, num_layers, batch_first=True, bidirectional=True)
        # 定义 LSTM 层,使用 batch_first=True 表示输入数据的形状是 [batch_size, seq_len(time_steps), input_size]
        # 使用 bidirectional=True 表示的是 bidirectional LSTM,即双向 LSTM
        self.fc = nn.Linear(hidden_size * 2, output_size)
        # 定义全连接层,将 LSTM 的最后一个隐藏状态映射到输出维度 output_size,双向LSTM的输出维度是隐藏层维度的两倍

    def forward(self, x):
        # 初始化隐藏状态(hidden state)和单元状态(cell state)为全零张量
        h0 = torch.zeros(self.num_layers * 2, x.size(0), self.hidden_size).to(x.device)  # 双向LSTM,所以是2倍
        c0 = torch.zeros(self.num_layers * 2, x.size(0), self.hidden_size).to(x.device)

        # LSTM输出, (output, (hn, cn))
        out, _ = self.lstm(x, (h0, c0))
        # out: tensor of shape (batch_size, seq_length(time_steps), hidden_size*2)

        # 取最后一个时间步的输出(或者对输出进行平均/最大池化等操作)
        # 这里我们选择最后一个时间步的输出
        out = self.fc(out[:, -1, :])
        return out
在时间序列模型中 seq_len 代表的就是时间步 time_steps
batch_first=True 表示输入数据的形状是 [batch_size, seq_len, input_size],输出数据形状是 [batch_size, seq_len, num_directions * hidden_size]
batch_first=False 表示输入数据的形状是 [seq_len, batch_size, input_size],输出数据形状是 [seq_len, batch_size, num_directions * hidden_size]
3.2 定义模型、损失函数与优化器
在神经网络中,模型通常指的是神经网络的架构,它定义了输入数据如何通过网络进行转换和计算,从而得到输出。在本案例中我们可以通过调用 BiLSTM 类来定义 Bi-directional Long Short-Term Memory。
损失函数(又称代价函数)是衡量模型预测值与真实值之间不一致性的指标。在训练神经网络时,我们的目标是找到一组网络参数,它使得损失函数的值最小化。损失函数的选择取决于问题的类型,例如,对于回归问题,常用的损失函数包括均方误差(MSE);对于分类问题,则常使用交叉熵损失等。在PyTorch中,可以使用torch.nn模块中的损失函数类,如nn.MSELoss用于回归问题,nn.CrossEntropyLoss用于分类问题
优化器的任务是通过更新网络的权重和偏置来最小化损失函数。这通常是通过反向传播算法完成的,该算法计算损失相对于每个参数的梯度,并使用梯度下降或其变体来更新参数。在PyTorch中,torch.optim模块提供了多种优化器实现,如随机梯度下降(SGD)、带动量的SGD(Momentum)、RMSProp、Adam等。这些优化器都是基于梯度下降算法进行改进的,旨在更有效地更新模型参数。
model = BiLSTM(input_size = 1, # 输入数据的特征数量 X_train.shape[2]
               hidden_size = 64,
               num_layers = 3,
               output_size = 1)
criterion = torch.nn.MSELoss() # 定义均方误差损失函数
optimizer = torch.optim.Adam(model.parameters(), lr=0.01) # 定义优化器
summary(model, (32, 60, 1)) # batch_size, seq_len(time_steps), input_size
==========================================================================================
Layer (type:depth-idx)                   Output Shape              Param #
==========================================================================================
BiLSTM                                   [32, 1]                   --
├─LSTM: 1-1                              [32, 60, 128]             232,960
├─Linear: 1-2                            [32, 1]                   129
==========================================================================================
Total params: 233,089
Trainable params: 233,089
Non-trainable params: 0
Total mult-adds (Units.MEGABYTES): 447.29
==========================================================================================
Input size (MB): 0.01
Forward/backward pass size (MB): 1.97
Params size (MB): 0.93
Estimated Total Size (MB): 2.91
==========================================================================================
4. 模型训练与可视化
4.1 训练过程
# 初始化列表来存储损失值
train_losses = []
test_losses = []

# 训练循环
num_epochs = 20  # 假设我们要训练 20个 epoch
for epoch in range(num_epochs):
    model.train()  # 设置模型为训练模式
    train_loss = 0.0

    # 使用tqdm来显示进度条
    with tqdm(total=len(train_loader), desc=f'Epoch {epoch+1}/{num_epochs}', unit='batch') as pbar:
        for data, target in train_loader:
            optimizer.zero_grad()
            output = model(data)
            loss = criterion(output, target)
            # 反向传播与优化
            loss.backward()
            optimizer.step()
            train_loss += loss.item() * data.size(0)
            pbar.update(1)  # 更新进度条

    train_loss = train_loss / len(train_loader.dataset)
    train_losses.append(train_loss)

    model.eval()  # 设置模型为评估模式
    with torch.no_grad():  # 不计算梯度以节省内存和计算资源
        test_loss = 0.0
        for data, target in test_loader:
            output = model(data)
            loss = criterion(output, target)
            test_loss += loss.item() * data.size(0)
        test_loss = test_loss / len(test_loader.dataset)
        test_losses.append(test_loss)
loss.item():loss是一个PyTorch的Tensor对象,而.item()方法用于从只包含一个元素的Tensor中提取Python数值(通常是浮点数)。由于损失通常是一个标量(scalar),因此我们可以安全地使用.item()来获取其数值。
data.size(0):这返回data这个Tensor在第一维度(通常是批次维度)的大小。在深度学习中,我们经常使用mini-batch梯度下降,这意味着我们将整个数据集分成较小的批次,并在每个批次上计算梯度并更新模型。data.size(0)就告诉我们当前批次中有多少个数据样本。
loss.item() * data.size(0):这实际上是在对损失进行“加权”。我们乘以批次大小是为了稍后能够计算平均损失(average loss)。这是因为在累积损失时,我们不仅要考虑损失的大小,还要考虑该损失是基于多少数据样本计算出来的。
train_loss += ...:最后,我们将加权后的损失累加到train_loss变量中。这样做是为了在整个训练循环结束时计算平均损失。
Epoch 1/20: 100%|███████████████████████████████████████████████████████████████████| 19/19 [00:01<00:00, 12.87batch/s]
Epoch 2/20: 100%|███████████████████████████████████████████████████████████████████| 19/19 [00:01<00:00, 14.08batch/s]
Epoch 3/20: 100%|███████████████████████████████████████████████████████████████████| 19/19 [00:01<00:00, 13.36batch/s]
Epoch 4/20: 100%|███████████████████████████████████████████████████████████████████| 19/19 [00:01<00:00, 13.81batch/s]
Epoch 5/20: 100%|███████████████████████████████████████████████████████████████████| 19/19 [00:01<00:00, 13.20batch/s]
Epoch 6/20: 100%|███████████████████████████████████████████████████████████████████| 19/19 [00:01<00:00, 14.13batch/s]
Epoch 7/20: 100%|███████████████████████████████████████████████████████████████████| 19/19 [00:01<00:00, 14.30batch/s]
Epoch 8/20: 100%|███████████████████████████████████████████████████████████████████| 19/19 [00:01<00:00, 14.37batch/s]
Epoch 9/20: 100%|███████████████████████████████████████████████████████████████████| 19/19 [00:01<00:00, 12.80batch/s]
Epoch 10/20: 100%|██████████████████████████████████████████████████████████████████| 19/19 [00:01<00:00, 13.98batch/s]
Epoch 11/20: 100%|██████████████████████████████████████████████████████████████████| 19/19 [00:01<00:00, 15.19batch/s]
Epoch 12/20: 100%|██████████████████████████████████████████████████████████████████| 19/19 [00:01<00:00, 14.47batch/s]
Epoch 13/20: 100%|██████████████████████████████████████████████████████████████████| 19/19 [00:01<00:00, 15.00batch/s]
Epoch 14/20: 100%|██████████████████████████████████████████████████████████████████| 19/19 [00:01<00:00, 13.07batch/s]
Epoch 15/20: 100%|██████████████████████████████████████████████████████████████████| 19/19 [00:01<00:00, 14.46batch/s]
Epoch 16/20: 100%|██████████████████████████████████████████████████████████████████| 19/19 [00:01<00:00, 13.97batch/s]
Epoch 17/20: 100%|██████████████████████████████████████████████████████████████████| 19/19 [00:01<00:00, 14.30batch/s]
Epoch 18/20: 100%|██████████████████████████████████████████████████████████████████| 19/19 [00:01<00:00, 14.14batch/s]
Epoch 19/20: 100%|██████████████████████████████████████████████████████████████████| 19/19 [00:01<00:00, 13.35batch/s]
Epoch 20/20: 100%|██████████████████████████████████████████████████████████████████| 19/19 [00:01<00:00, 15.19batch/s]
4.2 Loss 可视化
# 绘制损失图
plt.figure(figsize=(10, 5))
plt.plot(train_losses, label='Train Loss')
plt.plot(test_losses, label='Test Loss')
plt.title('Training and Test Loss')
plt.xlabel('Epoch')
plt.ylabel('Loss')
plt.legend()
plt.show()

5. 模型评估与可视化
# 初始化评估指标
total_loss = 0.0
total_mae = 0.0
total_rmse = 0.0
total_mape = 0.0
total_r2 = 0.0
num_samples = 0

# 自定义计算MAPE和R方值的函数
def calculate_mape(y_true, y_pred):
    return torch.mean(torch.abs((y_true - y_pred) / y_true)) * 100

def calculate_r2(y_true, y_pred):
    y_true_mean = torch.mean(y_true)
    ss_res = torch.sum((y_true - y_pred) ** 2)
    ss_tot = torch.sum((y_true - y_true_mean) ** 2)
    return 1 - (ss_res / ss_tot)

# 遍历数据加载器
with tqdm(total=len(test_loader), desc='Evaluating') as pbar:
    for inputs, targets in test_loader:
        # 将模型设置为评估模式
        model.eval()
        # 获取模型预测
        with torch.no_grad():
            outputs = model(inputs)

        # 计算损失(这是MSE损失)
        loss = nn.MSELoss()(outputs, targets)

        # 累积损失和评估指标
        total_loss += loss.item()
        mae = torch.mean(torch.abs(outputs - targets)).item()
        rmse = torch.sqrt(torch.mean((outputs - targets) ** 2)).item()
        mape = calculate_mape(targets, outputs).item()
        r2 = calculate_r2(targets, outputs).item()

        total_mae += mae
        total_rmse += rmse
        total_mape += mape
        total_r2 += r2
        num_samples += targets.size(0)

        pbar.update(1)
5.1 评估指标(MAE、RMSE、MAPE、R2)
# 计算平均评估指标
avg_loss = total_loss / len(test_loader)
avg_mae = total_mae / num_samples
avg_rmse = total_rmse / num_samples
avg_mape = total_mape / len(test_loader)
avg_r2 = total_r2 / len(test_loader)

# 打印评估结果
print(f"Average Loss: {avg_loss:.4f}")
print(f"Average MAE: {avg_mae:.4f}")
print(f"Average RMSE: {avg_rmse:.4f}")
print(f"Average MAPE: {avg_mape:.4f}%")
print(f"Average R^2: {avg_r2:.4f}")
Evaluating: 100%|████████████████████████████████████████████████████████████████████████| 3/3 [00:00<00:00, 50.00it/s]
Average Loss: 0.0010
Average MAE: 0.0008
Average RMSE: 0.0010
Average MAPE: 3.2648%
Average R^2: 0.6725
5.2 反归一化
.inverse_transform 将经过转换或缩放的数据转换回其原始形式或接近原始形式
# 反归一化预测结果
train_pred = scaler.inverse_transform(model(X_train_tensor).detach().numpy())
y_train = scaler.inverse_transform(y_train_tensor.detach().numpy())
test_pred = scaler.inverse_transform(model(X_test_tensor).detach().numpy())
y_test = scaler.inverse_transform(y_test_tensor.detach().numpy())

print(train_pred.shape, y_train.shape, test_pred.shape, y_test.shape)
(605, 1) (605, 1) (90, 1) (90, 1)
5.3 结果可视化
计算训练预测与测试预测的绘图数据
# shift train predictions for plotting
trainPredict = AAPL[window_size:X_train.shape[0]+X_train.shape[1]]
trainPredictPlot = trainPredict.assign(TrainPrediction=train_pred)

testPredict = AAPL[X_train.shape[0]+X_train.shape[1]:]
testPredictPlot = testPredict.assign(TestPrediction=test_pred)
绘制模型收盘价格的原始数据与预测数据
# Visualize the data
plt.figure(figsize=(18,6))
plt.title('BiLSTM Close Price Validation')
plt.plot(AAPL['Close'], color='blue', label='original')
plt.plot(trainPredictPlot['TrainPrediction'], color='orange',label='Train Prediction')
plt.plot(testPredictPlot['TestPrediction'], color='red', label='Test Prediction')
plt.legend()
plt.show()

6. 模型预测
6.1 转换最新时间步收盘价的数组为张量
# 假设latest_closes是一个包含最新window_size个收盘价的列表或数组
latest_closes = AAPL['Close'][-window_size:].values
latest_closes = latest_closes.reshape(-1, 1)
scaled_latest_closes = scaler.fit_transform(latest_closes)
tensor_latest_closes = torch.from_numpy(scaled_latest_closes).type(torch.Tensor).view(1, window_size, 1)
print(tensor_latest_closes.shape)
torch.Size([1, 60, 1])
6.2 预测下一个时间点的收盘价格
# 使用模型预测下一个时间点的收盘价
next_close_pred = model(tensor_latest_closes)
next_close_pred = scaler.inverse_transform(next_close_pred.detach().numpy())
next_close_pred
array([[166.8619]], dtype=float32)
参考链接
Correlation: What It Means in Finance and the Formula for Calculating It ↩︎