红酒Wine数据集
类别(13类属性):Alcohol,酒精;Malic acid,苹果酸
Ash,灰;Alcalinity of ash,灰的碱度;
Magnesium,镁;Total phenols,总酚;
Flavanoids,类黄酮;Nonflavanoid phenols,非黄酮酚;
Proanthocyanins,原花青素;Color intensity,色彩强度;
Hue,色调;OD280/OD315 of diluted wines,稀释酒的OD280/OD315;
Proline,脯氨酸。
Wine Data Set:{
	Alcohol,
	Malic acid,
	Ash,
	Alcalinity of ash,
	Magnesium,
	Total phenols,
	Flavanoids,
	Nonflavanoid phenols,
	Proanthocyanins,
	Color intensity,
	Hue,
	OD280/OD315 of diluted wines,
	Proline,
}

1.直接下载:wine数据集下载。
2.程序下载:pip install download
from download import download

# 下载红酒数据集
url = "https://ascend-professional-construction-dataset.obs.cn-north-4.myhuaweicloud.com:443/MachineLearning/wine.zip"
path = download(url, "./", kind="zip", replace=True)
读取Wine数据集wine.data,并查看部分数据

取三类样本(共178条),将数据集的13个属性作为自变量 𝑋 。将数据集的3个类别作为因变量 𝑌 。
import os
import csv
import numpy as np
import matplotlib.pyplot as plt

import mindspore as ms
from mindspore import nn, ops

ms.set_context(device_target="CPU")
X = np.array([[float(x) for x in s[1:]] for s in data[:178]], np.float32)
Y = np.array([s[0] for s in data[:178]], np.int32)

attrs = ['Alcohol', 'Malic acid', 'Ash', 'Alcalinity of ash', 'Magnesium', 'Total phenols',
         'Flavanoids', 'Nonflavanoid phenols', 'Proanthocyanins', 'Color intensity', 'Hue',
         'OD280/OD315 of diluted wines', 'Proline']
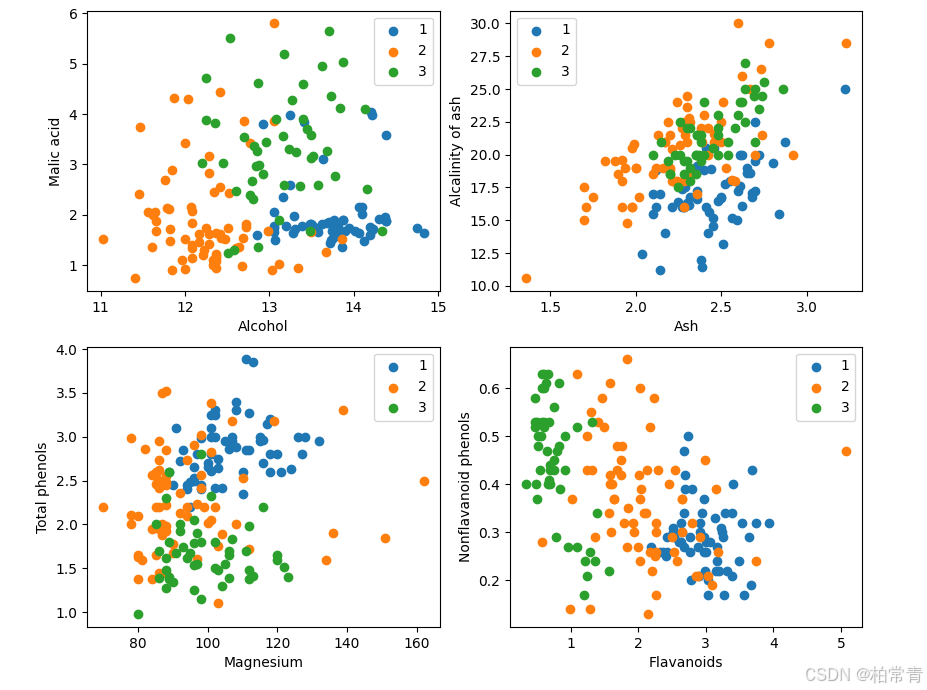
plt.figure(figsize=(10, 8))
for i in range(0, 4):
    plt.subplot(2, 2, i+1)
    a1, a2 = 2 * i, 2 * i + 1
    plt.scatter(X[:59, a1], X[:59, a2], label='1')
    plt.scatter(X[59:130, a1], X[59:130, a2], label='2')
    plt.scatter(X[130:, a1], X[130:, a2], label='3')
    plt.xlabel(attrs[a1])
    plt.ylabel(attrs[a2])
    plt.legend()
plt.show()

k临近算法:模型构建–计算距离
K近邻算法的基本原理是:对于一个新的输入实例,算法在训练数据集中找到与该实例最邻近的K个实例(即K个“邻居”),并基于这K个邻居的信息来进行预测。对于分类任务,通常采用多数表决的方式,即选择K个邻居中出现次数最多的类别作为预测结果;对于回归任务,则通常取K个邻居的实际值的平均值作为预测结果。
将数据集按128:50划分为训练集(已知类别样本)和验证集(待验证样本)
train_idx = np.random.choice(178, 128, replace=False)
test_idx = np.array(list(set(range(178)) - set(train_idx)))
X_train, Y_train = X[train_idx], Y[train_idx]
X_test, Y_test = X[test_idx], Y[test_idx]
利用MindSpore提供的tile, square, ReduceSum, sqrt, TopK等算子,通过矩阵运算的方式同时计算输入样本x和已明确分类的其他样本X_train的距离,并计算出top k近邻
class KnnNet(nn.Cell):
    def __init__(self, k):
        super(KnnNet, self).__init__()
        self.k = k

    def construct(self, x, X_train):
        #平铺输入x以匹配X_train中的样本数
        x_tile = ops.tile(x, (128, 1))
        square_diff = ops.square(x_tile - X_train)
        square_dist = ops.sum(square_diff, 1)
        dist = ops.sqrt(square_dist)
        #-dist表示值越大,样本就越接近
        values, indices = ops.topk(-dist, self.k)
        return indices

def knn(knn_net, x, X_train, Y_train):
    x, X_train = ms.Tensor(x), ms.Tensor(X_train)
    indices = knn_net(x, X_train)
    topk_cls = [0]*len(indices.asnumpy())
    for idx in indices.asnumpy():
        topk_cls[Y_train[idx]] += 1
    cls = np.argmax(topk_cls)
    return cls
模型预测
acc = 0
knn_net = KnnNet(5)
for x, y in zip(X_test, Y_test):
    pred = knn(knn_net, x, X_train, Y_train)
    acc += (pred == y)
    print('label: %d, prediction: %s' % (y, pred))
print('Validation accuracy is %f' % (acc/len(Y_test)))
输出:
label: 1, prediction: 1
label: 2, prediction: 2
label: 1, prediction: 3
label: 3, prediction: 3
label: 1, prediction: 1
label: 3, prediction: 3
label: 3, prediction: 1
label: 1, prediction: 3
label: 1, prediction: 1
label: 3, prediction: 2
label: 1, prediction: 3
label: 3, prediction: 3
label: 3, prediction: 3
label: 1, prediction: 1
label: 1, prediction: 1
label: 1, prediction: 1
label: 1, prediction: 1
label: 1, prediction: 1
label: 1, prediction: 1
label: 3, prediction: 3
label: 1, prediction: 3
label: 3, prediction: 3
label: 3, prediction: 3
label: 1, prediction: 1
label: 3, prediction: 2
label: 1, prediction: 1
label: 1, prediction: 1
label: 1, prediction: 1
label: 2, prediction: 3
label: 2, prediction: 2
label: 2, prediction: 2
label: 2, prediction: 1
label: 2, prediction: 2
label: 2, prediction: 2
label: 2, prediction: 2
label: 2, prediction: 3
label: 2, prediction: 2
label: 2, prediction: 3
label: 2, prediction: 2
label: 2, prediction: 2
label: 2, prediction: 2
label: 2, prediction: 2
label: 2, prediction: 2
label: 2, prediction: 2
label: 2, prediction: 2
label: 2, prediction: 2
label: 2, prediction: 2
label: 2, prediction: 2
label: 2, prediction: 2
label: 2, prediction: 2
Validation accuracy is 0.780000


