我们在Scikit-learn对K-means假设的调查中探索了揭示算法优势和局限性的场景。我们研究了K-means对不正确的聚类大小的敏感性,它在各向异性分布中面临的困难,它在不同的聚类方差中面临的困难,以及使用合成数据集的大小不均匀的聚类问题。我们希望这些假设的这种可视化表示将澄清K-means的适用性,并强调选择特定于数据特征的聚类算法的重要性。
K-Means聚类
一种称为K-means聚类的无监督机器学习技术用于根据数据中的相似性模式将数据集划分为离散的组或聚类。该方法包括迭代地将数据点分配到聚类中,并优化每个聚类的质心,以减少每个数据点与分配的质心之间的总平方距离。K-means是一种可扩展且有效的方法来发现数据中的底层结构,它被广泛用于分割和模式识别任务。K-means虽然简单,但对于一些具有复杂结构的数据集可能很困难,因为它对初始聚类质心很敏感,并且假设球形,大小相等的聚类。
K-Means聚类中的假设
在我们深入研究代码之前,让我们彻底解释K-Means聚类的几个基本假设:
- 球形和各向同性:K-means假设集群是球形和各向同性的,这意味着它们的半径在所有方向上近似相等。聚类中心被分配给算法根据聚类内数据点的平均值确定的均值。由于这种假设,K-means容易受到非球形或细长聚类的影响。
- 方差相等:所有聚类都被假设为具有相同的方差。这表明对于每个聚类,聚类中心周围的数据点分布大致相同。如果聚类的方差差异明显,则K-means可能无法很好地工作。
- 聚类大小:聚类大小相似性由K-means算法假设。具有更多数据点的聚类对聚类均值的影响更大,因为算法会将每个数据点分配给具有最接近均值的聚类。如果聚类的大小严重失衡,则算法可能无法正确描述底层数据分布。
- 各向异性分布数据:当K均值聚类中的数据点具有各向异性分布时,它们表示各个维度具有不同扩展的非球形细长聚类。因此,K-means的球形聚类假设被打破,这降低了准确性。对于这种复杂的数据结构,其他技术(如高斯混合模型)可能更合适。
在Scikit Learn中实现k-means假设的演示
导入库
# immporting Libraries
import numpy as np
import matplotlib.pyplot as plt
from sklearn.cluster import KMeans
from sklearn.datasets import make_blobs

plt.figure(figsize=(10, 10))

# Custom parameters
n_samples_custom = 1600
random_state_custom = 42
合成数据
# Generate blobs with different characteristics
X_custom, y_custom = make_blobs(
    n_samples=n_samples_custom, random_state=random_state_custom)
这段代码使用scikit-learn的make_blobs来创建一个包含1600个样本的合成数据集。然后对数据进行K均值聚类,其中n_clusters=3,聚类以散点图显示。为了重现性,参数random_state_custom和n_samples_custom调节数据集的大小和随机性。
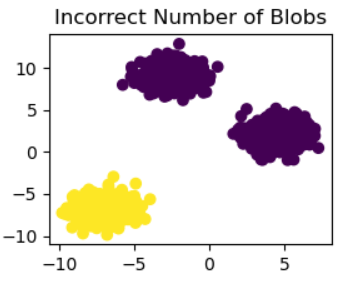
# Incorrect number of clusters
kmeans_1 = KMeans(n_clusters=2, random_state=random_state_custom)
y_pred_custom_1 = kmeans_1.fit_predict(X_custom)

plt.subplot(221)
plt.scatter(X_custom[:, 0], X_custom[:, 1], c=y_pred_custom_1)
plt.title("Incorrect Number of Blobs")

此代码将n_clusters=2的K-means聚类应用于合成数据集X_custom。接下来,使用plt.scatter,最终的聚类分配(y_pred_custom_1)显示在散点图中。“Incorrect Number of Blobs”子图是由子图(221)制成的较大图的一部分。
各向异性地分布簇
# Anisotropicly distributed data
transformation_custom = [[0.5, -0.8], [-0.3, 0.6]]
X_aniso_custom = np.dot(X_custom, transformation_custom)
kmeans_2 = KMeans(n_clusters=3, random_state=random_state_custom)
y_pred_custom_2 = kmeans_2.fit_predict(X_aniso_custom)

plt.subplot(222)
plt.scatter(X_aniso_custom[:, 0], X_aniso_custom[:, 1], c=y_pred_custom_2)
plt.title("Anisotropicly Distributed Blobs")

将线性变换(transformation_custom)应用于数据集的原始特征,此代码将向其添加各向异性。接下来,使用n clusters=3,
K-means对变换后的数据进行聚类(X_aniso_custom)。在名为“Anisotropically Distributed Blobs”的子图中包含的散点图中,将显示最终的聚类指定(y_pred_custom_2)。
不等方差
# Different variance
X_varied_custom, _ = make_blobs(n_samples=n_samples_custom, cluster_std=[
								1.0, 3.0, 0.5], random_state=random_state_custom)
kmeans_3 = KMeans(n_clusters=3, random_state=random_state_custom)
y_pred_custom_3 = kmeans_3.fit_predict(X_varied_custom)

plt.subplot(223)
plt.scatter(X_varied_custom[:, 0], X_varied_custom[:, 1], c=y_pred_custom_3)
plt.title("Unequal Variance")

此代码使用make_blobs函数创建具有不同聚类标准差的数据集(X_varied_custom)。接下来,将n_clusters=3的K均值聚类应用于数据集,并使用标题为“Unequal Variance”的散点图来可视化聚类分配(y_pred_custom_3)。
大小不一致的blobs
# Unevenly sized blobs
X_filtered_custom = np.vstack(
    (X_custom[y_custom == 0][:500], X_custom[y_custom == 1][:100], X_custom[y_custom == 2][:10]))
kmeans_4 = KMeans(n_clusters=3, random_state=random_state_custom)
y_pred_custom_4 = kmeans_4.fit_predict(X_filtered_custom)

plt.subplot(224)
plt.scatter(X_filtered_custom[:, 0],
            X_filtered_custom[:, 1], c=y_pred_custom_4)
plt.title("Unevenly Sized Blobs")

plt.show()

此代码获取原始数据集(X_custom),并从每个聚类中选择不同数量的样本,以创建大小不均匀的数据集(X_filtered_custom)。修改数据集后,应用n_clusters=3的K-means聚类。然后,在名为“Unevenly sized blobs”的子图中使用散点图显示产生(y_pred_custom_4)的聚类分配。plt.show()显示完整的图形。
结论
在Scikit-Learn对K-means假设的演示中,我们系统地研究了算法假设可能被打破的场景。当我们从大小不正确的聚类开始时,首次观察到K均值对聚类数量的敏感性。各向异性分布的引入突出了K-means在管理非球形聚类方面的局限性,因为该算法默认形成球形聚类。对具有不同方差的聚类的调查突出了K均值在处理不均匀分布的聚类时所面临的困难。最后,不同大小的blob显示了算法对集群大小变化的敏感程度。每个场景都显示了可能的危险,强调理解K-means假设并根据数据集的特征选择合适的聚类方法是多么重要。更可靠的解决方案可以通过替代技术提供,如高斯混合模型,用于各向异性或大小不均匀的簇等复杂结构。该演示强调了根据数据属性仔细选择算法的重要性,并为从业者导航聚类算法的微妙之处提供了有用的见解。


