echarts阶段仪表图 – 效率图
1、先上效果展示
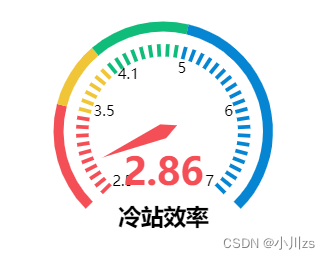
2、完整源码奉上
Vue2 + echarts 5
<template>
  <div ref="gaugeChart" style="width: 100%; height: 100%"></div>
</template>

<script>
import * as echarts from "echarts";
export default {
  name: "HomeGaugeChart",
  data() {
    return {
      gaugeChart: null,
    };
  },
  props:{
    value:{
      type:String,
      default:0
    }
  },
  methods: {
    //初始化方法
    initChart() {
      this.gaugeChart = echarts.init(this.$refs.gaugeChart);

      const option = {
        tooltip: {
          formatter: "{a} <br/>COP : {c}",
        },
        series: [
          {
            name: "冷站效率",
            type: "gauge",
            min: 2.5, //最小起始值
            max: 7, //最大值
            splitNumber: 45,
            axisLine: {
              show: true, // 是否显示仪表盘轴线(轮廓线),默认true
              lineStyle: {
                color: [ // 阶段范围对应不同颜色
                  [0.22, "#f44f56"],
                  [0.35, "#f0c537"],
                  [0.55, "#0fbc79"],
                  [1, "#0685d2"],
                ],
                width: 8,
              },
            },
            title: {
              fontWeight: "bolder",
              fontSize: 18,
              color: "#000",
              offsetCenter: [0, "80%"],
            },
            pointer: {
              itemStyle: {
                color: "auto",
              },
            },
            axisTick: {
              show: false,
              length: 1,
              splitNumber: 1,
              lineStyle: {
                color: "auto",
              },
            },
            splitLine: {
              show: true,
              length: 10,
              lineStyle: {
                color: "auto",
              },
            },
            axisLabel: {
              show: true, // 是否显示标签,默认 true。
              distance: 10, // 标签与刻度线的距离,默认 5。
              color: "#000", // 文字的颜色,默认 #fff。
              fontSize: 12, // 文字的字体大小,默认 5。
              formatter: function (value) { // 自定义渲染刻度值
                var arr = [2.5, 3.5, 4.1, 5, 6, 7];
                if (arr.indexOf(value) > -1) {
                  console.log(value);
                  return value;
                }
              },
            },
            detail: {
              valueAnimation: true,
              formatter: "{value}",
              color: "inherit",
            },
            data: [{ value: this.value, name: "冷站效率" }],  //数据
          },
        ],
      };

      this.gaugeChart.setOption(option);
    },
  },
  mounted() {
    this.initChart();
  },
};
</script>


