1.案例1
1.1代码
option = {
    "tooltip": {
        "trigger": "axis",
        "backgroundColor": "rgba(32, 33, 36,.7)",
        "borderColor": "rgba(32, 33, 36,0.20)",
        "borderWidth": 10,
        "textStyle": {
            "color": "#fff",
            "fontSize": "10"
        },
        "axisPointer": {
            "type": "cross",
            "label": {
                "backgroundColor": "#6a7985"
            }
        }
    },
    "legend": {
        "textStyle": {
            "color": "white"
        },
        "icon": "roundRect",
        "itemHeight": 2,
        "data": [
            "发电量"
        ]
    },
    "grid": {
        "top": "15%",
        "left": "6%",
        "right": "6%",
        "bottom": "19%",
        "containLabel": true
    },
    "xAxis": {
        "type": "category",
        "boundaryGap": false,
				         "axisLabel": {
        "color": "white"
    },
        "data": [
            "08:00",
            "09:00",
            "10:00",
            "11:00",
            "12:00",
            "13:00",
            "14:00",
            "15:00",
            "16:00",
            "17:00",
            "18:00",
            "19:00",
            "20:00"
        ]
    },
    "yAxis": {
        "type": "value",
        "splitLine": {
            "show": false
        },
        "axisLabel": {
            "show": false
        }
    },
    "series": [

        {
            "name": "发电量",
            "type": "line",
            "data": [
                100,
                170,
                300,
                1500,
                2700,
                3000,
                2400,
                1800,
                1400,
                800,
                400,
                150,
                80
            ],
            "smooth": 0.8,
            "color": "#FF5722"
        }
    ]
}
1.2.效果展示

2案例2
2.1代码
option = {
  title: {
    textStyle: {
      color: '#fff' // 标题文字颜色为白色
    }
  },
  tooltip: {
    trigger: 'axis',
    axisPointer: {
      type: 'cross',
      label: {
        backgroundColor: '#6a7985'
      }
    }
  },
  legend: {
    textStyle: {
      color: 'white'
    },
    top: -1,
    icon: 'roundRect',
    itemHeight: 2,
  },
  toolbox: {
    feature: {
      saveAsImage: false
    }
  },
  grid: {
    left: '3%',
    right: '4%',
    bottom: '10%',
    containLabel: true
  },
  xAxis: [
    {
      type: 'category',
      boundaryGap: false,
      data: ['17日', '18日', '19日', '20日', '21日', '22日', '23日', '24日', '25日', '26日', '27日', '28日', '29日', '30日', '31日', '1日'],
      axisLabel: {
        textStyle: {
          color: '#fff' // X轴文字颜色为白色
        }
      }
    }
  ],
  yAxis: [
    {
      type: 'value',
      splitLine: {
        show: false // 隐藏Y轴的横线
      },
      axisLabel: {
        textStyle: {
          color: '#fff' // Y轴文字颜色为白色
        }
      }
    }
  ],
  series: [
    {
      name: '水',
      type: 'line',
      stack: 'Total1',
      smooth: true,
      symbol: 'circle',
      symbolSize: 5,
      areaStyle: {
        opacity: 0.2
      },
      emphasis: {
        focus: 'series'
      },
      itemStyle: {
        color: '#00e5e7'
      },
      data: [2.7,2.9,2.8,2.7,2.8,2.7,2.6,2.8,2.8,2.8,2.5,2.6,2.5,2.4,2.5,2.6]
    },
    {
      name: '电力',
      type: 'line',
      stack: 'Total2',
      smooth: true,
      symbol: 'circle',
      symbolSize: 5,
      areaStyle: {
        opacity: 0.2
      },
      emphasis: {
        focus: 'series'
      },
      itemStyle: {
        color: '#ff5549'
      },
      data: [2.3,1.9,2.0,1.9,1.8,1.8,1.9,2.1,1.8,1.9,1.8,1.6,1.3,1.5,1.7,1.7]
    },
    {
      name: '天然气',
      type: 'line',
      stack: 'Total3',
      smooth: true,
      symbol: 'circle',
      symbolSize: 5,
      areaStyle: {
        opacity: 0.2
      },
      emphasis: {
        focus: 'series'
      },
      itemStyle: {
        color: '#0066ff'
      },
      data: [1.5,1.8,1.7,1.5,1.6,1.8,1.7,1.3,1.6,1.4,1.3,1.4,1.3,1.2,1.1,1.2]
    },
    {
      name: '氢气',
      type: 'line',
      stack: 'Total4',
      smooth: true,
      symbol: 'circle',
      symbolSize: 5,
      areaStyle: {
        opacity: 0.2
      },
      emphasis: {
        focus: 'series'
      },
      itemStyle: {
        color: '#f5b7da'
      },
      data: [1.5,1.6,1.5,1.7,1.5,1.8,1.5,1.6,1.6,1.5,1.6,1.6,1.5,1.5,1.6,1.5]
    }
  ]
}
2.2效果展示

3.案例3
3.1代码
option = {
  title: {
    textStyle: {
      color: '#fff' // 标题文字颜色为白色
    }
  },
  tooltip: {
    trigger: 'axis',
    axisPointer: {
      type: 'cross',
      label: {
        backgroundColor: '#6a7985'
      }
    }
  },
  legend: {
    textStyle: {
      color: 'white'
    },
    left:'5%',
    icon:'none',
  //  top: -1,
   // icon: 'rect',
 // itemHeight: 8, // 调整方块高度
 // itemWidth: 16, // 调整方块宽度

  },
  toolbox: {
    feature: {
      saveAsImage: false
    }
  },
  grid: {
	   top:'10%',
    left: '5%',
    right: '4%',
    bottom: '5%',
    containLabel: true
  },
  xAxis: [
    {
      type: 'category',
      boundaryGap: false,
      data: ['00:00', '03:00', '06:00', '09:00', '12:00', '15:00', '18:00', '21:00', '22:00'],
      axisLabel: {
        textStyle: {
          color: '#fff' // X轴文字颜色为白色
        }
      }
    }
  ],
  yAxis: [
    {
      type: 'value',
      splitLine: {
        show: false // 隐藏Y轴的横线
      },
      axisLabel: {
              show: false ,// 隐藏Y轴上的数值
        textStyle: {
          color: '#fff' // Y轴文字颜色为白色
        }
      },
    }
  ],
  series: [
    {
      name: '充电功率',
      type: 'line',
      stack: 'Total1',
			      areaStyle: {
        opacity: 0.1
      },
      smooth: true,
      symbol: 'circle',
      symbolSize: 5,
      emphasis: {
        focus: 'series'
      },
      itemStyle: {
        color: '#00e5e7'
      },
      data: [2.7,2.9,2.8,2.7,2.8,2.7,2.6,2.8,2.8,2.8,2.5,2.6,2.5,2.4,2.5,2.6]
    }
  ]
}
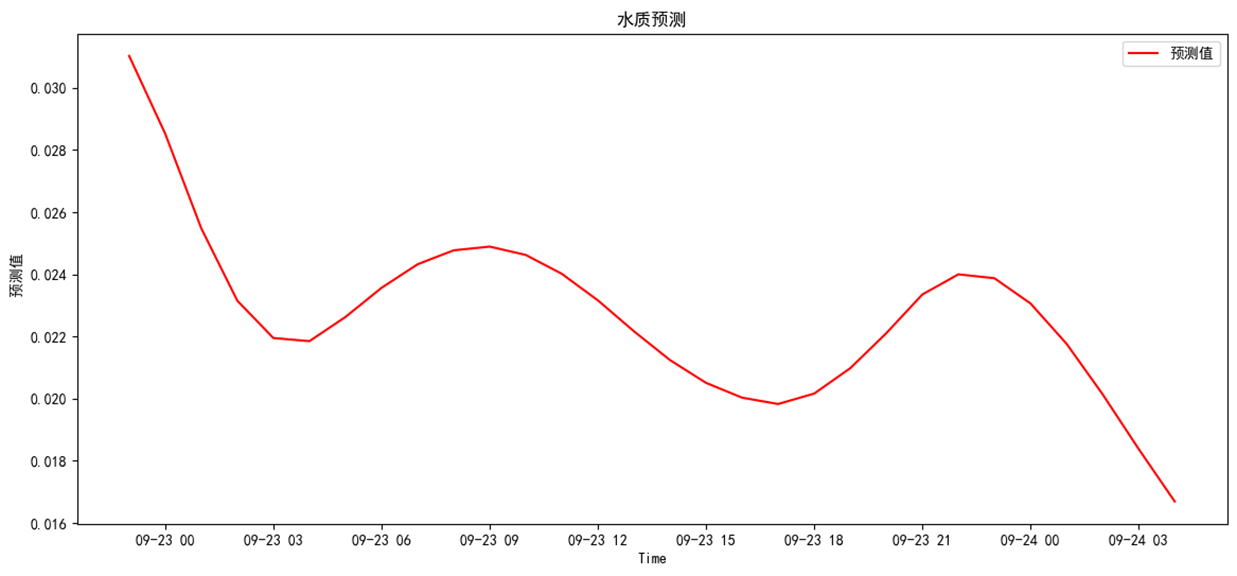
3.2效果展示


![[Leetcode 136][Easy]-只出现一次的数字](https://img-blog.csdnimg.cn/direct/9683f9b9cb97453e9b4a0ba9a726db96.png)
