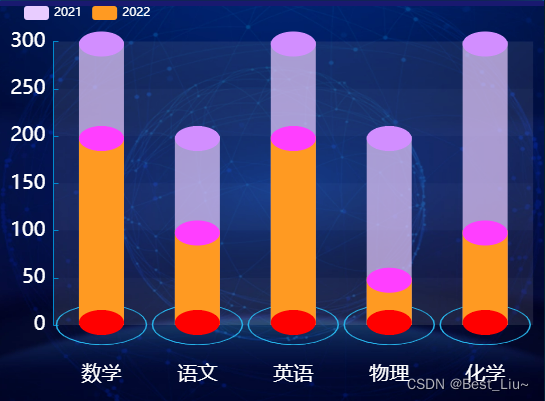
一、第一种效果
效果图
使用步骤
完整实例,copy就可直接使用
<template>
<div :class="className" :style="{height:height,width:width}" />
</template>
<script>
import echarts from 'echarts'
require('echarts/theme/macarons') // echarts theme
import resize from '@/views/dashboard/mixins/resize'
export default {
mixins: [resize],
props: {
className: {
type: String,
default: 'chart'
},
width: {
type: String,
default: '100%'
},
height: {
type: String,
default: '400px'
},
dataList: {
type: Array,
default: []
}
},
data() {
return {
chart: null,
xAxisData: ['数学', '语文', '英语', '物理', '化学'],
data1: [200, 100, 200, 50, 100],
data2: [300, 200, 300, 200, 300]
}
},
mounted() {
this.$nextTick(() => {
this.initChart()
})
},
beforeDestroy() {
if (!this.chart) {
return
}
this.chart.dispose()
this.chart = null
},
watch: {
dataList(val, oldVal) {//普通的watch监听
this.initChart()
}
},
methods: {
initChart() {
this.chart = echarts.init(this.$el, 'macarons')
this.chart.setOption(
{
tooltip: {
trigger: 'item'
},
grid: {
top: '10%',
bottom: '20%',
right: '2%',
left: '10%'
},
legend: {
data: ['2021', '2022'],
left: '20px',
textStyle: {
color: '#FFFFFF'
}
},
graphic: [
{
type: 'image', // 图形元素类型
id: 'logo', // 更新或删除图形元素时指定更新哪个图形元素,如果不需要用可以忽略。
right: 'center', // 根据父元素进行定位 (居中)
bottom: '0%', // 根据父元素进行定位 (0%), 如果bottom的值是 0,也可以删除该bottom属性值。
z: 0, // 层叠
bounding: 'all', // 决定此图形元素在定位时,对自身的包围盒计算方式
style: {
image:
'https://img0.baidu.com/it/u=3846011338,1538056540&fm=253&fmt=auto&app=138&f=PNG?w=889&h=500', // 这里一定要注意、注意,必须是https开头的图片路径地址
width: 800,
height: 400
}
}
],
xAxis: {
data: this.xAxisData,
axisTick: {
show: false
},
axisLine: {
show: false
},
axisLabel: {
interval: 0,
textStyle: {
color: '#fff',
fontSize: 20
},
margin: 40
}
},
yAxis: {
splitLine: {
show: false
},
axisTick: {
show: true,
alignWithLabel: true,
inside: true
},
axisLine: {
show: true
},
axisLabel: {
textStyle: {
color: '#fff',
fontSize: 20
}
}
},
series: [
// 底部的光晕
{
name: '',
type: 'pictorialBar',
tooltip: {
show: false
},
symbolSize: [90, 40],
symbolOffset: [0, 20],
z: 1,
itemStyle: {
normal: {
color: 'transparent',
borderColor: '#26B2E8',
borderType: 'solid',
borderWidth: 1
}
},
data: [1, 1, 1, 1, 1]
},
{
name: '2021',
type: 'bar',
barWidth: 45,
barGap: '-100%',
z: 0,
itemStyle: {
color: '#E8CCFF',
opacity: 0.7
},
data: this.data2
},
{
name: '2022',
type: 'bar',
barWidth: 45,
barGap: '-100%',
itemStyle: {
color: '#FF9A22'
},
data: this.data1
},
//头部、中部、尾部圆片
{
name: '2021', // 头部
type: 'pictorialBar',
symbolSize: [45, 25],
symbolOffset: [0, -10],
z: 12,
symbolPosition: 'end',
itemStyle: {
color: '#D28EFF',
opacity: 1
},
data: this.data2
},
{
name: '2022',//中部
type: 'pictorialBar',
symbolSize: [45, 25],
symbolOffset: [0, -10],
z: 12,
symbolPosition: 'end',
itemStyle: {
opacity: 1,
color: '#FF3EFF'
},
data: this.data1
},
{
//三个最低下的圆片
name: '',
type: 'pictorialBar',
symbolSize: [45, 25],
symbolOffset: [0, 10],
z: 12,
itemStyle: {
opacity: 1,
color: 'red'
},
data: this.data1
}
]
}
)
}
}
}
</script>itemStyle: {
normal: {
//这里是颜色
color: function (params) {
//注意,如果颜色太少的话,后面颜色不会自动循环,最好多定义几个颜色
var colorList = ['#00A3E0', '#FFA100', '#ffc0ca', '#CCCCCC', '#749f83', '#04A035', '#8729D9', '#c207c9', '#c90762', '#c90707'];
return colorList[params.dataIndex]
}
}
}附带网图背景

二、第二种效果
效果图

使用步骤
完整实例,copy就可直接使用
<template>
<div :class="className" :style="{height:height,width:width}" />
</template>
<script>
import echarts from 'echarts'
require('echarts/theme/macarons') // echarts theme
import resize from '@/views/dashboard/mixins/resize'
export default {
mixins: [resize],
props: {
className: {
type: String,
default: 'chart'
},
width: {
type: String,
default: '100%'
},
height: {
type: String,
default: '400px'
},
dataList: {
type: Array,
default: []
}
},
data() {
return {
chart: null,
xAxisData: ['区域1', '区域2', '区域3', '区域4', '区域5', '区域6', '区域7', '区域8', '区域9'],
colorArr: ['#0C628C', '#3887D5', '#2570BB'],
barWidth: 30,
data1: [6, 7, 3, 11, 33, 38, 22, 55, 66],
bottomData: [1, 1, 1, 1, 1, 1, 1, 1, 1],
topData: [100, 100, 100, 100, 100, 100, 100, 100, 100],
names: ["区域"]
}
},
mounted() {
this.$nextTick(() => {
this.initChart()
})
},
beforeDestroy() {
if (!this.chart) {
return
}
this.chart.dispose()
this.chart = null
},
watch: {
dataList(val, oldVal) {//普通的watch监听
this.initChart()
}
},
methods: {
initChart() {
var color = {
type: 'linear',
x: 0,
x2: 1,
y: 0,
y2: 0,
colorStops: [
{
offset: 0,
color: this.colorArr[0]
},
{
offset: 0.5,
color: this.colorArr[0]
},
{
offset: 0.5,
color: this.colorArr[1]
},
{
offset: 1,
color: this.colorArr[1]
}
]
}
this.chart = echarts.init(this.$el, 'macarons')
this.chart.setOption(
{
tooltip: {
trigger: 'axis',
formatter: function (params) {
var str = params[0].name + ':'
params.filter(function (item) {
if (item.componentSubType == 'bar' && item.seriesName === '数据') {
str += item.value
}
})
return str
}
},
grid: {
left: '0%',
right: '10%',
bottom: '3%',
containLabel: true
},
xAxis: [
{
type: 'category',
name: this.names[0],
data: this.xAxisData,
// 更改坐标轴颜色
axisLine: {
lineStyle: {
color: "#FFFFFF"
},
onZero: false
},
// x轴的字体样式
axisLabel: {
interval: 0,
textStyle: {
color: "#FFFFFF", // 更改坐标轴文字颜色
fontSize: 14, // 更改坐标轴文字大小
fontFamily: 'MicrosoftYaHei'
},
}
}
],
yAxis: [
{
type: 'value',
name: '得分',
axisLabel: {
formatter: '{value}',
textStyle: {
color: this.fontColorY, // 更改坐标轴文字颜色
fontSize: 12, // 更改坐标轴文字大小
fontFamily: 'MicrosoftYaHei'
}
},
// 更改坐标轴颜色
axisLine: {
lineStyle: {
color: "#FFFFFF"
}
},
// 网格线
splitLine: {
// 网格线
lineStyle: {
type: 'solid',
with: 0.5,
color: this.borderColor
}
}
}
],
series: [
// 数据低下的圆片
{
name: '',
type: 'pictorialBar',
symbolOffset: ['0%', '50%'],
symbolSize: [this.barWidth - 4, (10 * (this.barWidth - 4)) / this.barWidth],
z: 12,
symbol: 'diamond',
itemStyle: {
opacity: 1,
color: color
// color: 'transparent'
},
data: this.bottomData
},
// 数据的柱状图
{
name: '数据',
type: 'bar',
barWidth: this.barWidth,
itemStyle: {
// lenged文本
opacity: 1, // 这个是 透明度
color: color
},
data: this.data1
},
// 替代柱状图 默认不显示颜色,是最下方柱图的value值 - 20
{
type: 'bar',
symbol: 'diamond',
barWidth: this.barWidth + 2,
itemStyle: {
color: 'transparent'
},
data: this.data1
},
// 数据顶部的样式
{
name: '',
type: 'pictorialBar',
symbol: 'diamond',
symbolOffset: ['0%', '-50%'],
symbolSize: [this.barWidth, 10],
z: 12,
itemStyle: {
normal: {
opacity: 1,
color: this.colorArr[2],
label: {
show: true, // 开启显示
position: 'top', // 在上方显示
textStyle: {
// 数值样式
color: '#FFFFFF',
fontSize: 12,
top: 50
}
}
}
},
symbolPosition: 'end',
data: this.data1
},
// 阴影的顶部
{
name: '', // 头部
type: 'pictorialBar',
symbol: 'diamond',
symbolOffset: ['0%', '-50%'],
symbolSize: [this.barWidth, 10],
z: 12,
symbolPosition: 'end',
itemStyle: {
color: 'blue',
opacity: 0.3,
borderWidth: 1,
borderColor: 'rgba(18, 47, 133,1)'
},
data: this.topData
},
// 后面的背景
{
name: '',
type: 'bar',
barWidth: this.barWidth,
barGap: '-100%',
z: 0,
itemStyle: {
color: 'rgba(18, 47, 133,0.3)'
},
data: this.topData
}
]
}
)
}
}
}
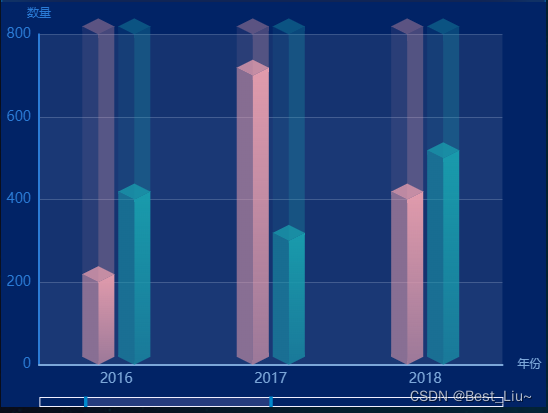
</script>三、第三种效果
效果图
使用步骤
完整实例,copy就可直接使用
<template>
<div :class="className" :style="{height:height,width:width}" />
</template>
<script>
import echarts from 'echarts'
require('echarts/theme/macarons') // echarts theme
import resize from '@/views/dashboard/mixins/resize'
export default {
mixins: [resize],
props: {
className: {
type: String,
default: 'chart'
},
width: {
type: String,
default: '100%'
},
height: {
type: String,
default: '400px'
},
dataList: {
type: Array,
default: []
}
},
data() {
return {
chart: null,
MAX: [800, 800, 800, 800, 800, 800, 800],
NAME: [2015, 2016, 2017, 2018, 2019, 2020, 2021],
VALUE: [200, 400, 300, 500, 700, 300, 100],
VALUE2: [500, 200, 700, 400, 300, 600, 400],
}
},
mounted() {
this.$nextTick(() => {
this.initChart()
})
},
beforeDestroy() {
if (!this.chart) {
return
}
this.chart.dispose()
this.chart = null
},
watch: {
dataList(val, oldVal) {//普通的watch监听
this.initChart()
}
},
methods: {
initChart() {
const offsetX = 16;
const offsetY = 8;
[-18, 18].forEach((customOffset, index) => {
const CubeLeft = echarts.graphic.extendShape({
shape: {
x: 0,
y: 0,
},
buildPath: function (ctx, shape) {
const xAxisPoint = shape.xAxisPoint;
const c0 = [shape.x - customOffset, shape.y];
const c1 = [shape.x - offsetX - customOffset, shape.y - offsetY];
const c2 = [xAxisPoint[0] - offsetX - customOffset, xAxisPoint[1] - offsetY];
const c3 = [xAxisPoint[0] - customOffset, xAxisPoint[1]];
ctx.moveTo(c0[0], c0[1]).lineTo(c1[0], c1[1]).lineTo(c2[0], c2[1]).lineTo(c3[0], c3[1]).closePath();
},
});
const CubeRight = echarts.graphic.extendShape({
shape: {
x: 0,
y: 0,
},
buildPath: function (ctx, shape) {
const xAxisPoint = shape.xAxisPoint;
const c1 = [shape.x - customOffset, shape.y];
const c2 = [xAxisPoint[0] - customOffset, xAxisPoint[1]];
const c3 = [xAxisPoint[0] + offsetX - customOffset, xAxisPoint[1] - offsetY];
const c4 = [shape.x + offsetX - customOffset, shape.y - offsetY];
ctx.moveTo(c1[0], c1[1]).lineTo(c2[0], c2[1]).lineTo(c3[0], c3[1]).lineTo(c4[0], c4[1]).closePath();
},
});
const CubeTop = echarts.graphic.extendShape({
shape: {
x: 0,
y: 0,
},
buildPath: function (ctx, shape) {
const c1 = [shape.x - customOffset, shape.y];
const c2 = [shape.x + offsetX - customOffset, shape.y - offsetY];
const c3 = [shape.x - customOffset, shape.y - offsetX];
const c4 = [shape.x - offsetX - customOffset, shape.y - offsetY];
ctx.moveTo(c1[0], c1[1]).lineTo(c2[0], c2[1]).lineTo(c3[0], c3[1]).lineTo(c4[0], c4[1]).closePath();
},
});
echarts.graphic.registerShape('CubeLeft' + index, CubeLeft);
echarts.graphic.registerShape('CubeRight' + index, CubeRight);
echarts.graphic.registerShape('CubeTop' + index, CubeTop);
});
this.chart = echarts.init(this.$el, 'macarons')
this.chart.setOption(
{
backgroundColor: '#012366',
grid: {
left: '1%',
right: '8%',
bottom: '5%',
top: '8%',
containLabel: true,
},
tooltip: {
trigger: 'axis',
axisPointer: { // 坐标轴指示器,坐标轴触发有效
type: 'shadow' // 默认为直线,可选为:'line' | 'shadow'
},
formatter: function (e) {
var str =
e[2].axisValue +
"<br>" +
"<span style='display:inline-block;margin-right:5px;border-radius:10px;width:10px;height:10px;background-color:" +
"rgba(225,155,172, 1)" +
";'></span>" +
"课程数量 : " +
e[2].value +
"<br>" +
"<span style='display:inline-block;margin-right:5px;border-radius:10px;width:10px;height:10px;background-color:" +
"rgba(25,155,172, 1)" +
";'></span>" +
"完成数量 : " +
e[3].value;
return str;
},
},
legend: {
orient: 'vertical',
x: 'right',
y: 'center',
data: ['课程数量', '完成数量',]
},
xAxis: {
type: 'category',
data: this.NAME,
name:"年份",
axisLine: {
show: true,
lineStyle: {
width: 2,
color: '#7ca7d9',
},
},
axisTick: {
show: false,
},
axisLabel: {
fontSize: 14,
},
},
yAxis: {
type: 'value',
name:"数量",
minInterval: 1,
axisLine: {
show: true,
lineStyle: {
width: 2,
color: '#2B7BD6',
},
},
splitLine: {
show: true,
lineStyle: {
color: 'rgba(201,217,241,0.23)',
},
},
axisTick: {
show: false,
},
axisLabel: {
fontSize: 14,
},
},
dataZoom: [{
show: true,
height: 10,
xAxisIndex: [
0
],
bottom: 0,
start: 10,
end: 50,
handleIcon: 'path://M306.1,413c0,2.2-1.8,4-4,4h-59.8c-2.2,0-4-1.8-4-4V200.8c0-2.2,1.8-4,4-4h59.8c2.2,0,4,1.8,4,4V413z',
handleSize: '110%',
handleStyle: {
color: "#d3dee5",
},
textStyle: {
color: "#fff"
},
borderColor: "#90979c"
}, {
type: "inside",
show: true,
height: 15,
start: 1,
end: 10
}],
series: [
{
// 最大高度
type: 'custom',
renderItem: function (params, api) {
const location = api.coord([api.value(0), api.value(1)])
return {
type: 'group',
children: [{
type: 'CubeLeft0',
shape: {
api,
x: location[0],
y: location[1],
xAxisPoint: api.coord([api.value(0), 0])
},
style: {
fill: `rgba(25,155,172, .1)`
}
}, {
type: 'CubeRight0',
shape: {
api,
x: location[0],
y: location[1],
xAxisPoint: api.coord([api.value(0), 0])
},
style: {
fill: `rgba(25,155,172, .3)`
}
}, {
type: 'CubeTop0',
shape: {
api,
x: location[0],
y: location[1],
xAxisPoint: api.coord([api.value(0), 0])
},
style: {
fill: `rgba(25,155,172, .4)`
}
}]
}
},
data: this.MAX
},
{
// 最大高度
type: 'custom',
renderItem: function (params, api) {
const location = api.coord([api.value(0), api.value(1)])
return {
type: 'group',
children: [{
type: 'CubeLeft1',
shape: {
api,
x: location[0],
y: location[1],
xAxisPoint: api.coord([api.value(0), 0])
},
style: {
fill: `rgba(225,155,172, .1)`
}
}, {
type: 'CubeRight1',
shape: {
api,
x: location[0],
y: location[1],
xAxisPoint: api.coord([api.value(0), 0])
},
style: {
fill: `rgba(225,155,172, .3)`
}
}, {
type: 'CubeTop1',
shape: {
api,
x: location[0],
y: location[1],
xAxisPoint: api.coord([api.value(0), 0])
},
style: {
fill: `rgba(225,155,172, .4)`
}
}]
}
},
data: this.MAX
},
{
type: 'custom',
renderItem: (params, api) => {
const location = api.coord([api.value(0), api.value(1)]);
return {
type: 'group',
children: [
{
type: 'CubeLeft0',
shape: {
api,
xValue: api.value(0),
yValue: api.value(1),
x: location[0] - 0,
y: location[1],
xAxisPoint: api.coord([api.value(0), 0]),
},
style: {
fill: new echarts.graphic.LinearGradient(0, 0, 0, 1, [
{
offset: 0,
color: 'rgba(25,155,172, .5)',
},
{
offset: 1,
color: 'rgba(25,155,172, .5)',
},
]),
},
},
{
type: 'CubeRight0',
shape: {
api,
xValue: api.value(0),
yValue: api.value(1),
x: location[0] - 0,
y: location[1],
xAxisPoint: api.coord([api.value(0), 0]),
},
style: {
fill: new echarts.graphic.LinearGradient(0, 0, 0, 1, [
{
offset: 0,
color: 'rgba(25,155,172, 1)',
},
{
offset: 1,
color: 'rgba(25,155,172, .5)',
},
]),
},
},
{
type: 'CubeTop0',
shape: {
api,
xValue: api.value(0),
yValue: api.value(1),
x: location[0] - 0,
y: location[1],
xAxisPoint: api.coord([api.value(0), 0]),
},
style: {
fill: new echarts.graphic.LinearGradient(0, 0, 0, 1, [
{
offset: 0,
color: 'rgba(25,155,172, .8)',
},
{
offset: 1,
color: 'rgba(25,155,172, .8)',
},
]),
},
},
],
};
},
data: this.VALUE,
},
{
type: 'custom',
renderItem: (params, api) => {
const location = api.coord([api.value(0), api.value(1)]);
return {
type: 'group',
children: [
{
type: 'CubeLeft1',
shape: {
api,
xValue: api.value(0),
yValue: api.value(1),
x: location[0] - 0,
y: location[1],
xAxisPoint: api.coord([api.value(0), 0]),
},
style: {
fill: new echarts.graphic.LinearGradient(0, 0, 0, 1, [
{
offset: 0,
color: 'rgba(225,155,172, .5)',
},
{
offset: 1,
color: 'rgba(225,155,172, .5)',
},
]),
},
},
{
type: 'CubeRight1',
shape: {
api,
xValue: api.value(0),
yValue: api.value(1),
x: location[0] - 0,
y: location[1],
xAxisPoint: api.coord([api.value(0), 0]),
},
style: {
fill: new echarts.graphic.LinearGradient(0, 0, 0, 1, [
{
offset: 0,
color: 'rgba(225,155,172, 1)',
},
{
offset: 1,
color: 'rgba(225,155,172, .5)',
},
]),
},
},
{
type: 'CubeTop1',
shape: {
api,
xValue: api.value(0),
yValue: api.value(1),
x: location[0] - 0,
y: location[1],
xAxisPoint: api.coord([api.value(0), 0]),
},
style: {
fill: new echarts.graphic.LinearGradient(0, 0, 0, 1, [
{
offset: 0,
color: 'rgba(225,155,172, .8)',
},
{
offset: 1,
color: 'rgba(225,155,172, .8)',
},
]),
},
},
],
};
},
data: this.VALUE2,
},
],
}
)
}
}
}
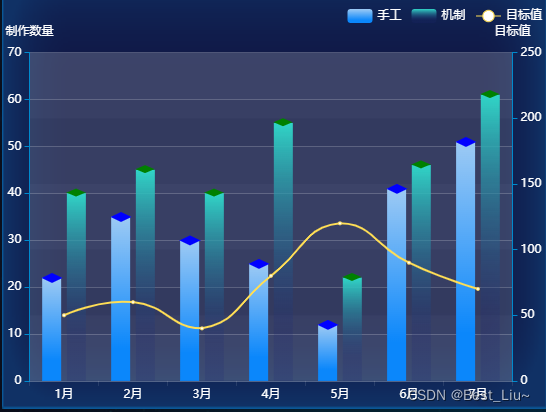
</script>四、第四种效果
效果图
使用步骤
完整实例,copy就可直接使用
<template>
<div :class="className" :style="{height:height,width:width}" />
</template>
<script>
import echarts from 'echarts'
require('echarts/theme/macarons') // echarts theme
import resize from '@/views/dashboard/mixins/resize'
export default {
mixins: [resize],
props: {
className: {
type: String,
default: 'chart'
},
width: {
type: String,
default: '100%'
},
height: {
type: String,
default: '400px'
},
dataList: {
type: Array,
default: []
}
},
data() {
return {
chart: null,
targetData: [50, 60, 40, 80, 120, 90, 70],
manualData: [22, 35, 30, 25, 12, 41, 51],
mechanismData: [40, 45, 40, 55, 22, 46, 61],
xData:['1月', '2月', '3月', '4月', '5月', '6月', '7月'],
names:['手工', '机制', '目标值']
}
},
mounted() {
this.$nextTick(() => {
this.initChart()
})
},
beforeDestroy() {
if (!this.chart) {
return
}
this.chart.dispose()
this.chart = null
},
watch: {
dataList(val, oldVal) {//普通的watch监听
this.initChart()
}
},
methods: {
initChart() {
const color1 = {
type: 'linear',
x: 1,
y: 0,
x2: 1,
y2: 1,
colorStops: [
{
offset: 0,
color: '#9DCAF4'
},
{
offset: 0.8,
color: '#0B87FB'
}
]
};
const color2 = {
type: 'linear',
x: 1,
y: 0,
x2: 1,
y2: 1,
colorStops: [
{
offset: 0,
color: '#31D5C7'
},
{
offset: 0.8,
color: 'rgba(29, 39, 115,0.2)'
}
]
};
this.chart = echarts.init(this.$el, 'macarons')
this.chart.setOption(
{
legend: {
data: this.names,
x: 'right',
textStyle: {
// 图例文字大小颜色
fontSize: 12,
color: '#ffffff'
}
},
tooltip: {
trigger: 'axis',
axisPointer: {
type: 'shadow' // 'shadow' as default; can also be 'line' or 'shadow'
}
},
grid: {
left: '1%',
right: '1%',
bottom: '2%',
top: '12%',
containLabel: true
},
xAxis: {
type: 'category',
data: this.xData,
axisLabel: {
color: '#fff'
},
axisLine: {
show: true,
lineStyle: {
color: 'rgba(255, 255, 2555, 0.1)'
}
}
},
yAxis: [
{
type: 'value',
name: '制作数量',
axisLabel: {
color: '#fff',
axisLabel: {
color: '#fff',
//y轴文字的配置
textStyle: {
color: "#fff",
},
},
},
splitLine: {
show: true,
lineStyle: {
color: 'rgba(255,255,255,0.2)'
}
},
nameTextStyle: {
//y轴上方单位的颜色
color: "#fff",
},
},
{
type: 'value',
name: '目标值',
min: 0,
max: 250,
interval: 50,
axisLabel: {
color: '#fff',
//y轴文字的配置
textStyle: {
color: "#fff",
},
},
splitLine: {
show: false,
lineStyle: {
color: 'rgba(255,255,255,0.2)'
}
},
nameTextStyle: {
//y轴上方单位的颜色
color: "#fff",
},
}
],
series: [
{
itemStyle: {
normal: {
// 这里是用一个柱子,从左到右的渐变。也可以用两个柱子做从上往下的渐变,和上面的透明渐变一样用法
color: color1
}
},
data: this.manualData,
type: 'bar',
barWidth: 19,
z: 2,
name: this.names[0]
},
{
z: 3,
name: this.names[0],
type: 'pictorialBar',
// 柱子顶部
symbolPosition: 'end',
data: this.manualData,
symbol: 'diamond',
symbolOffset: ['-12', -11],
symbolRotate: 90,
symbolSize: [10, 21],
itemStyle: {
normal: {
borderWidth: 1,
color: 'blue'
}
},
tooltip: {
show: false
}
},
{
itemStyle: {
normal: {
// 这里是用一个柱子,从左到右的渐变。也可以用两个柱子做从上往下的渐变,和上面的透明渐变一样用法
color: color2
}
},
data: this.mechanismData,
type: 'bar',
barWidth: 19,
z: 2,
name: this.names[1]
},
{
z: 3,
name: this.names[1],
type: 'pictorialBar',
// 柱子顶部
symbolPosition: 'end',
data: this.mechanismData,
symbol: 'diamond',
symbolOffset: [12, -11],
symbolRotate: 90,
symbolSize: [8, 19],
itemStyle: {
normal: {
borderWidth: 1,
color: 'green'
}
},
tooltip: {
show: false
}
},
{
name: this.names[2],
type: 'line',
yAxisIndex: 1,
data: this.targetData,
itemStyle: {
normal: {
color: '#FFDE55', //圈圈的颜色
lineStyle: {
color: '#FFDE55' //线的颜色
}
}
}
}
]
}
)
}
}
}
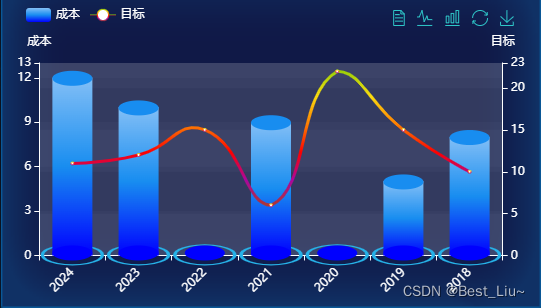
</script>五、第五种效果
效果图
使用步骤
完整实例,copy就可直接使用
<template>
  <div :class="className" :style="{height:height,width:width}" />
</template>

<script>
  import echarts from 'echarts'
  require('echarts/theme/macarons') // echarts theme
  import resize from '@/views/dashboard/mixins/resize'

  export default {
    mixins: [resize],
    props: {
      className: {
        type: String,
        default: 'chart'
      },
      width: {
        type: String,
        default: '100%'
      },
      height: {
        type: String,
        default: '400px'
      },
      dataList: {
        type: Array,
        default: []
      },
      titleName: {
        type: String,
        default: 'echarts'
      },
      names: {
        type: Array,
        default: ['成本', '目标']
      }
    },
    data() {
      return {
        chart: null,
        sourceList: [],
        listData1: [],
        dataBottom: [],
        listData2: [],
        max: 0,
        maxDate1: 0,
        maxDate2: 0,
      }
    },
    mounted() {
      this.$nextTick(() => {
        this.initChart()
      })
    },
    beforeDestroy() {
      if (!this.chart) {
        return
      }
      this.chart.dispose()
      this.chart = null
    },
    watch: {
      dataList(val, oldVal) {//普通的watch监听
        this.initChart()
      }
    },
    methods: {
      initChart() {
        this.chart = echarts.init(this.$el, 'macarons')
        this.sourceList = []
        this.listData1 = []
        this.listData2 = []
        for (let i = 0; i < this.dataList.length; i++) {
          this.sourceList.push(this.dataList[i].techName)
          this.listData1.push((this.dataList[i].oneNum))
          this.dataBottom.push(1)
          this.listData2.push(this.dataList[i].twoNum)
        }
        this.sourceList = ["2024","2023","2022","2021","2020","2019","2018"]
          this.listData1 = [12,10,0,9,0,5,8]
          this.dataBottom = [1,1,1,1,1,1,1]
          this.listData2 = [11,12,15,6,22,15,10]
        //获取纵坐标最大值--start
        this.maxDate1 = this.listData1[0];
        for (let i = 0; i < this.listData1.length; i++) {
          let item = this.listData1[i];
          item > this.maxDate1 ? this.maxDate1 = item : this.maxDate1 = this.maxDate1;
        }
        this.maxDate2 = this.listData2[0];
        for (let i = 0; i < this.listData2.length; i++) {
          let item = this.listData2[i];
          item > this.maxDate2 ? this.maxDate2 = item : this.maxDate2 = this.maxDate2;
        }
        this.maxDate1 = this.maxDate1 + 1
        this.maxDate2 = this.maxDate2 + 1
        //获取纵坐标最大值--end
        this.chart.setOption({
          tooltip: {
            trigger: 'axis',
            axisPointer: {
              type: 'cross',
              label: {
                backgroundColor: '#6a7985'
              }
            },
            formatter: function (params) {
              var str = '<div style=" font-size: 16px;color:#FFFFFF">'
              str = str + params[0].name + '<br>'
              params.filter(function (item) {
                if (item.componentSubType === 'bar' || item.componentSubType === 'line') {
                  str = str + item.seriesName + ':' + item.data + '<br>'
                }
              })
              str = str + '</div>'
              return str;
            }
          },
          toolbox: {
            feature: {
              dataView: { show: true, readOnly: true },
              magicType: { show: true, type: ['line', 'bar'] },
              restore: { show: true },
              saveAsImage: { show: true, backgroundColor: '#79B9F5', name: this.titleName }
            },
            right: '20px',
          },
          grid: {
            left: '3%',
            right: '3%',
            bottom: '3%',
            containLabel: true
          },
          legend: {
            data: this.names,
            left: '20px',
            textStyle: {
              color: '#FFFFFF'
            }
          },
          xAxis: [
            {
              type: 'category',
              data: this.sourceList,
              axisLine: {
                //x轴线的颜色以及宽度
                show: true,
                lineStyle: {
                  color: "#FFFFFF",
                  type: "solid",
                },
              },
              axisPointer: {
                type: 'shadow'
              },
              axisLabel: {
                show: true,
                rotate: 45,    // 设置x轴标签旋转角度
                margin: 15
              }
            }
          ],
          yAxis: [
            {
              type: 'value',
              name: this.names[0],
              axisLabel: {
                //y轴文字的配置
                textStyle: {
                  color: "#fff",
                },
              },
              axisLine: {
                //y轴线的颜色以及宽度
                show: true,
                lineStyle: {
                  color: "#fff",
                  width: 1,
                  type: "solid",
                },
              },
              splitLine: {
                //分割线配置
                show: false,
                lineStyle: {
                  color: "#fff",
                },
              },
              nameTextStyle: {
                //y轴上方单位的颜色
                color: "#fff",
              },
              max: this.maxDate1
            },
            {
              type: 'value',
              name: this.names[1],
              axisLabel: {
                //y轴文字的配置
                textStyle: {
                  color: "#fff",
                },
              },
              axisLine: {
                //y轴线的颜色以及宽度
                show: true,
                lineStyle: {
                  color: "#fff",
                  width: 1,
                  type: "solid",
                },
              },
              splitLine: {
                //分割线配置
                show: false,
                lineStyle: {
                  color: "#fff",
                },
              },
              nameTextStyle: {
                //y轴上方单位的颜色
                color: "#fff",
              },
              //设置纵坐标最大值
              max: this.maxDate2
            },
          ],
          series: [
            {
              itemStyle: {
                normal: {
                  // 这里是用一个柱子,从左到右的渐变。也可以用两个柱子做从上往下的渐变,和上面的透明渐变一样用法
                  color: {
                    type: 'linear',
                    x: 1,
                    y: 0,
                    x2: 1,
                    y2: 1,
                    colorStops: [
                      { offset: 0, color: '#83bff6' },
                      { offset: 0.5, color: '#188df0' },
                      { offset: 1, color: 'blue' }
                    ]
                  }
                }
              },
              data: this.listData1,
              type: 'bar',
              barWidth: 40,
              tooltip: {
                valueFormatter: function (value) {
                  return value;
                }
              },
              z: 2,
              name: this.names[0]
            },
            // 底部的光晕
            {
              name: this.names[0],
              type: 'pictorialBar',
              tooltip: {
                show: false
              },
              symbolSize: [60, 20],
              symbolOffset: [0, 10],
              z: 1,
              itemStyle: {
                normal: {
                  color: 'transparent',
                  borderColor: '#26B2E8',
                  borderType: 'solid',
                  borderWidth: 2
                }
              },
              data: this.dataBottom
            },
            {
              //底部圆片
              name: this.names[0],
              type: 'pictorialBar',
              symbolSize: [40, 15],
              symbolOffset: [0, 5],
              z: 12,
              itemStyle: {
                opacity: 1,
                color: 'blue',
                borderColor: '#03529A'
              },
              data: this.dataBottom
            },
            //头部圆片
            {
              name: this.names[0], // 头部
              type: 'pictorialBar',
              symbolSize: [40, 15],
              symbolOffset: [0, -7],
              z: 3,
              symbolPosition: 'end',
              itemStyle: {
                color: '#188df0',
                opacity: 1
              },
              data: this.listData1
            },
            {
              name: this.names[1],
              type: 'line',
              z: 12,
              yAxisIndex: 1,
              tooltip: {
                valueFormatter: function (value) {
                  return value;
                }
              },
              lineStyle: {
                normal: {
                  width: 3 //折线宽度
                },
              },
              itemStyle: {
                color: new echarts.graphic.LinearGradient(0, 0, 0, 1, [
                  { offset: 0, color: '#93CE07' },
                  { offset: 0.2, color: '#FBDB0F' },
                  { offset: 0.4, color: '#FC7D02' },
                  { offset: 0.6, color: '#FD0100' },
                  { offset: 0.8, color: '#AA069F' },
                  { offset: 1, color: '#AC3B2A' }
                ])
              },
              data: this.listData2
            }
          ]
        })
      }
    }
  }
</script>
六、3D饼图实现
vue中如何使用echarts和echarts-gl实现3D饼图环形饼图_echarts 3d饼图-CSDN博客
七、Echarts:象形柱图实现水塔水位的动画、水球图和液位柱子图
Echarts:象形柱图实现水塔水位的动画、水球图和液位柱子图_echarts html 液位柱子图-CSDN博客
八、3D折线图实现
vue中如何使用echarts和echarts-gl实现三维折线图-CSDN博客
resize.js
import { debounce } from '@/utils'

export default {
  data() {
    return {
      $_sidebarElm: null,
      $_resizeHandler: null
    }
  },
  mounted() {
    this.initListener()
  },
  activated() {
    if (!this.$_resizeHandler) {
      // avoid duplication init
      this.initListener()
    }

    // when keep-alive chart activated, auto resize
    this.resize()
  },
  beforeDestroy() {
    this.destroyListener()
  },
  deactivated() {
    this.destroyListener()
  },
  methods: {
    // use $_ for mixins properties
    // https://vuejs.org/v2/style-guide/index.html#Private-property-names-essential
    $_sidebarResizeHandler(e) {
      if (e.propertyName === 'width') {
        this.$_resizeHandler()
      }
    },
    initListener() {
      this.$_resizeHandler = debounce(() => {
        this.resize()
      }, 100)
      window.addEventListener('resize', this.$_resizeHandler)

      this.$_sidebarElm = document.getElementsByClassName('sidebar-container')[0]
      this.$_sidebarElm && this.$_sidebarElm.addEventListener('transitionend', this.$_sidebarResizeHandler)
    },
    destroyListener() {
      window.removeEventListener('resize', this.$_resizeHandler)
      this.$_resizeHandler = null

      this.$_sidebarElm && this.$_sidebarElm.removeEventListener('transitionend', this.$_sidebarResizeHandler)
    },
    resize() {
      const { chart } = this
      chart && chart.resize()
    }
  }
}
防抖函数
/**
 * @param {Function} fn 防抖函数
 * @param {Number} delay 延迟时间
 */
export function debounce(fn, delay) {
  var timer;
  return function () {
    var context = this;
    var args = arguments;
    clearTimeout(timer);
    timer = setTimeout(function () {
      fn.apply(context, args);
    }, delay);
  };
}