系列完结篇,直奔主题

电子车间能源监控看板展示视频
1、渐变色环形进度条

在进度条下方直接加svg实现,中间的字体则先隐藏环形进度条默认的文字:show-text="false",再用绝对定位来写进去
                  <div class="ball_bg">
                    <el-progress type="circle" :width="100" :stroke-width="8" :show-text="false" :percentage="loadRate" class="progress"></el-progress>
                    <svg width="100%" height="100%">
                      <defs>
                        <linearGradient id="blue" x1="0%" y1="0%" x2="100%" y2="0%">
                          <stop offset="0%" style="stop-color:rgba(0, 126, 250, 1)" stop-opacity="1" />
                          <stop offset="100%" style="stop-color:rgba(4, 205, 230, 1)" stop-opacity="1" />
                        </linearGradient>
                      </defs>
                    </svg>
                    <div class="value_box">
                      <div class="value">
                        <span>{{ loadRate }}</span>%
                      </div>
                      <div>负荷率</div>
                    </div>
                  </div>
2、折线图表与按钮控制展示项与flex布局

折线图和flex布局这个在系列第二期讲过,就不多赘述。
主要来讲解用按钮来控制折线图显示哪一项的折线,原理是给按钮组赋值一个数组,激活的按钮就给数组push它的name,然后绘制图表时,使用includes来判断某一项是否展示,若展示,则给图表的series用push添加该项的配置内容。
HTML:
<div class="line_monitor">
            <groupPlate :title="`${singleMeterName}能耗监控`">
              <div class="content">
                <div class="dimension_box">
                  <div :class="groudDimension.includes('usageAmount')? 'active btn': 'btn'" @click="Setsigledimension('usageAmount', 'groud')">能耗</div>
                  <div :class="groudDimension.includes('output') ? 'active btn' : 'btn'" @click="Setsigledimension('output', 'groud')">产量</div>
                  <div :class="groudDimension.includes('single') ? 'active btn' : 'btn'" @click="Setsigledimension('single', 'groud')">单耗</div>
                  <div :class="`btn ${unitDimension == 'day'?'active':''}`" @click="Setsigledimension('day', 'dimension')">日</div>
                  <div :class="`btn ${unitDimension == 'month'?'active':''}`" @click="Setsigledimension('month', 'dimension')">月</div>
                  <div :class="`btn ${unitDimension == 'year'?'active':''}`" @click="Setsigledimension('year', 'dimension')">年</div>
                </div>
                <groupChart :options="lineOption"></groupChart>
              </div>
            </groupPlate>
          </div>
CSS:
            .line_monitor {
                .content {
                    height: 427px;
                    position: relative;

                    .dimension_box {
                        width: 350px;

                        .btn {
                            width: 50px;
                        }
                    }

                    .group_chart {
                        height: 100%;
                    }
                }
            }

            .active {
                box-shadow: inset 0px 0px 8px 0px #3191cf;
                border-radius: 2px;
            }
JS:
    Setsigledimension(type, groud) {
      if (groud == "groud") {
        if (this.groudDimension.includes(type)) {
          let arr = [];
          this.groudDimension.forEach((item) => {
            if (item != type) {
              arr.push(item);
            }
          });
          this.groudDimension = arr;
          this.setOptionLine();
        } else {
          this.groudDimension.push(type);
        }
        this.getGrouddata();
      } else if (groud == "dimension") {
        this.unitDimension = type;
        this.getGrouddata();
      }
    },
    getGrouddata() {
      if (!this.rankData.length) return;
      let params = {
        dimension: this.unitDimension,
        energyType: 1,
        isOrgData: this.level == 1 ? true : false,
        condition: this.groudDimension,
        meterGroupId: this.meterGroupId || null,

      };
      params.date = moment(new Date()).format("YYYY-MM-DD HH:mm:ss");
      params.endDate = moment(new Date()).format("YYYY-MM-DD HH:mm:ss");
      let self = this;
      axios.cancel("ogetMeterStationResp");
      if (this.unitDimension == "month") {
        let paramList = [
          params,
          {
            ...params,
            date: moment(new Date())
              .add(-1, "month")
              .format("YYYY-MM-DD HH:mm:ss"),
            endDate: moment(new Date())
              .add(-1, "month")
              .format("YYYY-MM-DD HH:mm:ss"),
          },
        ];
        let leng =
          moment(new Date()).add(-1, "month").endOf("month").format("DD") - 1 >=
            29
            ? 29
            : 28;
        let toleng = moment(new Date()).format("DD") - 0;
        Promise.all(
          paramList.map((i) => {
            return axios.ogetMeterStationResp(i);
          })
        ).then((reslist) => {
          if (reslist[0].data) {
            let arr = [];
            reslist[0].data.body.forEach((item, index) => {
              let item1 = reslist[1].data.body[index];
              let obj = {
                ...item,
                gwYDate: [
                  ...item1.gwYDate.slice(-(leng - toleng + 1)),
                  ...item.gwYDate.slice(0, toleng),
                ],
                outputDate: item1.outputDate && item.outputDate ? [
                  ...item1.outputDate.slice(-(leng - toleng + 1)),
                  ...item.outputDate.slice(0, toleng),
                ] : null,
                singleDate: item1.singleDate && item.singleDate ? [
                  ...item1.singleDate.slice(-(leng - toleng + 1)),
                  ...item.singleDate.slice(0, toleng),
                ] : null,
                xdate: [
                  ...item1.xdate.slice(-(leng - toleng + 1)),
                  ...item.xdate.slice(0, toleng),
                ],
              };
              arr.push(obj);
            });
            self.respData = [...arr];
            self.setOptionLine();
          }
        });
      } else {
        axios.ogetMeterStationResp({ ...params, isInjection: 0 }).then((res) => {
          if (res.data && res.data.body && res.data.body.length) {
            self.respData = res.data.body;
            self.setOptionLine();
          } else {
            this.singleChart_groud ? this.singleChart_groud.clear() : "";
          }
        });
      }
    },
    setOptionLine() {
      let self = this;
      if (!self.groudDimension.length) {
        self.lineOption = {};
        return;
      }
      let series = [];
      if (self.groudDimension.includes("usageAmount")) {
        let gwYDate = self.respData[self.importantIndex].gwYDate ? self.respData[self.importantIndex].gwYDate.map(x => x.toFixed(2)) : [];
        series.push({
          ydata: gwYDate,
          name: "能耗",
          type: 'line',
          color: 'rgb(173, 255, 47)',
        });
      }
      if (self.groudDimension.includes("single")) {
        let singleDate = self.respData[self.importantIndex].singleDate ? self.respData[self.importantIndex].singleDate.map(x => x.toFixed(2)) : [];
        series.push({
          ydata: singleDate,
          name: "单耗",
          type: 'line',
          color: 'rgb(244, 164, 96)',
        });
      }
      if (self.groudDimension.includes("output")) {
        let outputDate = self.respData[self.importantIndex].outputDate ? self.respData[self.importantIndex].outputDate.map(x => x.toFixed(2)) : [];
        series.push({
          ydata: outputDate,
          name: "产量",
          type: 'line',
          color: 'rgb(2, 126, 247)',
        });
      }
      let option = {
        grid: {
          top: '20%',
          right: '5%',
          bottom: '10%',
          left: '10%',
        },
        xAxis: self.respData[self.importantIndex].xdate,
        series: series,
        legend: {
          textStyle: {
            color: '#C0D7FE'
          },
          left: 'right',
          padding: [20, 20, 0, 0]
        },
        tooltip: {
          trigger: 'axis',
          axisPointer: {
            type: 'shadow',
            label: {
              backgroundColor: '#6a7985'
            }
          },
        },
      };
      self.singleMeterName = self.respData[self.importantIndex].meterGroupName == '全厂' ? '整体' : self.respData[self.importantIndex].meterGroupName;
      self.lineOption = option
      //   self.setSingleLine(data, "singleChart_groud");
    },
3、表格设计与单击双击事件
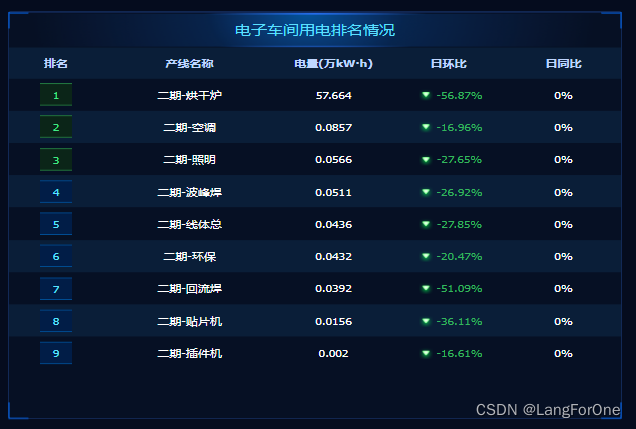
左边一列的排名在columns里使用render加工:
        {
            title: "排名",
            type: "render",
            prop: "title",
            minWidth: 80,
            render: (h, params) => {
                return h(
                    "div",
                    {
                        style: {
                            display: 'flex',
                            justifyContent: 'center',
                            alignItems: 'center',

                        },
                    },
                    [
                        h('div', {
                            style: {
                                color: params.index < 3 ? "#42EA86" : '#5CE2FF',
                                whiteSpace: "nowrap",
                                background: params.index < 3 ? '#0B2518' : '#011D47',
                                width: '32px',
                                height: '26px',
                                borderTop: params.index < 3 ? '1px solid #2A904C' : '1px solid #0058A4',
                                borderBottom: params.index < 3 ? '1px solid #2A904C' : '1px solid #0058A4',
                            },
                        },
                            params.index + 1),
                    ]

                );
            },
        },
单击事件@rowClick是显示该工厂的数据图表,双击事件@rowDblclick是进入该工厂的下一层子级工厂,需要结合完整代码一并理解,就直接放下面吧
完整代码:
<template>
<Home :isFullScreen="true">
<div class="kanban_home_electric" v-loading="loading" element-loading-text="loading..." element-loading-background="rgba(0, 0, 0, 0.5)">
<div class="kanban__body">
<!-- 左侧 -->
<div class="body_left">
<div class="whole_monitor">
<groupPlate :title="`电子车间整体监控`">
<div class="content">
<div class="card_bg">
<div class="ball_bg">
<el-progress type="circle" :width="100" :stroke-width="8" :show-text="false" :percentage="loadRate" class="progress"></el-progress>
<svg width="100%" height="100%">
<defs>
<linearGradient id="blue" x1="0%" y1="0%" x2="100%" y2="0%">
<stop offset="0%" style="stop-color:rgba(0, 126, 250, 1)" stop-opacity="1" />
<stop offset="100%" style="stop-color:rgba(4, 205, 230, 1)" stop-opacity="1" />
</linearGradient>
</defs>
</svg>
<div class="value_box">
<div class="value">
<span>{{ loadRate }}</span>%
</div>
<div>负荷率</div>
</div>
</div>
<div class="content_left">
<div class="content_box" v-for="(item,index) in monitorData.slice(0,3)" :key="index">
<img :src="item.img" />
<div class="name">{{ item.name }}</div>
<div class="value">{{ item.value }}</div>
</div>
</div>
<div class="content_right">
<div class="content_box" v-for="(item,index) in monitorData.slice(3,6)" :key="index">
<img :src="item.img" />
<div class="name">{{ item.name }}</div>
<div class="value" :style="`color:${item.color || '#fff'}`">{{ item.value }}</div>
</div>
</div>
</div>
</div>
</groupPlate>
</div>
<div class="whole_trend">
<groupPlate :title="`电子车间整体用电趋势`">
<div class="content">
<div class="dimension_box">
<div :class="`btn ${trendDimension == 'day'?'active':''}`" @click="changeTrend('day')">日</div>
<div :class="`btn ${trendDimension == 'month'?'active':''}`" @click="changeTrend('month')">月</div>
<div :class="`btn ${trendDimension == 'year'?'active':''}`" @click="changeTrend('year')">年</div>
</div>
<groupChart :options="trendOption"></groupChart>
</div>
</groupPlate>
</div>
<div class="whole_alarm">
<groupPlate :title="`电子车间报警分析`">
<div class="content">
<groupTable :columns="alarmColumns" :Serialnumber="false" :data="alarmList" stripe></groupTable>
</div>
</groupPlate>
</div>
</div>
<!-- 中间 -->
<div class="body_center">
<div class="line_monitor">
<groupPlate :title="`${singleMeterName}能耗监控`">
<div class="content">
<div class="dimension_box">
<div :class="groudDimension.includes('usageAmount')? 'active btn': 'btn'" @click="Setsigledimension('usageAmount', 'groud')">能耗</div>
<div :class="groudDimension.includes('output') ? 'active btn' : 'btn'" @click="Setsigledimension('output', 'groud')">产量</div>
<div :class="groudDimension.includes('single') ? 'active btn' : 'btn'" @click="Setsigledimension('single', 'groud')">单耗</div>
<div :class="`btn ${unitDimension == 'day'?'active':''}`" @click="Setsigledimension('day', 'dimension')">日</div>
<div :class="`btn ${unitDimension == 'month'?'active':''}`" @click="Setsigledimension('month', 'dimension')">月</div>
<div :class="`btn ${unitDimension == 'year'?'active':''}`" @click="Setsigledimension('year', 'dimension')">年</div>
</div>
<groupChart :options="lineOption"></groupChart>
</div>
</groupPlate>
</div>
<div class="line_waste">
<groupPlate :title="`线体用能浪费监控`">
<div class="content">
<div class="dimension_box">
<div :class="`btn ${wasteDimension == 'day'?'active':''}`" @click="changeWaste('day')">日</div>
<div :class="`btn ${wasteDimension == 'month'?'active':''}`" @click="changeWaste('month')">月</div>
<div :class="`btn ${wasteDimension == 'year'?'active':''}`" @click="changeWaste('year')">年</div>
</div>
<div class="waste_box" v-for="(item,index) in wasteData" :key="index">
<div class="name">{{ item.meterGroupName }}</div>
<div class="value">
{{ item.wasteUsage }}
<span>kwh</span>
</div>
</div>
</div>
</groupPlate>
</div>
</div>
<!-- 右侧 -->
<div class="body_right">
<div class="whole_rank">
<groupPlate :title="`电子车间用电排名情况`">
<div class="content">
<groupTable :columns="rankColumns" :Serialnumber="false" :data="rankData" stripe @rowClick="rowclick" @rowDblclick="rowDblclick"></groupTable>
<div class="reset" v-if="this.level != 1" @click="handlerReset()">返回</div>
</div>
</groupPlate>
</div>
<div class="main_monitor">
<groupPlate :title="`重点设备能耗监控`">
<div class="content">
<groupTable :columns="mainColumns" :Serialnumber="false" :data="wasteData" stripe></groupTable>
</div>
</groupPlate>
</div>
</div>
</div>
</div>
</Home>
</template>
<script>
import ResizeObserver from "resize-observer-polyfill";
import * as echarts from "echarts";
import moment from "moment";
import axios from "../../api/index";
import groupPlate from '../kanban_group/components/group_plate';
import groupChart from '../kanban_group/components/group_chart';
import groupTable from "../kanban_group/components/group_table.vue";
import columns from "./components/columns";
import "moment/locale/zh-cn";
export default {
name: "kanban_home_electric",
components: {
groupPlate,
groupChart,
groupTable,
},
data() {
return {
loading: false,
searchTime: null,
// 左侧
monitorData: [
{
img: require('../../assets/homeElectric/icon_link.png'),
name: '设备接入数',
value: 335,
},
{
img: require('../../assets/homeElectric/icon_online.png'),
name: '在线总数',
value: 329,
},
{
img: require('../../assets/homeElectric/icon_offline.png'),
name: '离线总数',
value: 5,
},
{
img: require('../../assets/homeElectric/icon_alarm.png'),
name: '预警数',
value: 1,
color: '#E76746',
},
{
img: require('../../assets/homeElectric/icon_done.png'),
name: '已处理',
value: 1,
color: '#35B45E',
},
{
img: require('../../assets/homeElectric/icon_notyet.png'),
name: '待处理',
value: 0,
},
],
loadRate: 0,
trendDimension: 'day',
meterGroupId: null,
meterGroupName: null,
trendOption: {},
alarmList: [],
// 中间
groudDimension: ["single", "usageAmount", "output"],
unitDimension: 'day',
respData: [],
singleMeterName: "",
lineOption: {},
wasteData: [],
wasteDimension: 'day',
// 右侧
arrow_up: require('../../assets/businessMonitoring/arrow_up.png'),
arrow_down: require('../../assets/businessMonitoring/arrow_down.png'),
mainMeterGroupId: null,
importantIndex: 0,
rankData: [],
level: 1,
rowclickTime: null,
};
},
computed: {
alarmColumns() {
return columns.alarmColumns;
},
mainColumns() {
return columns.mainColumns;
},
rankColumns() {
return columns.rankColumns;
}
},
methods: {
// 每5分钟自动更新
searchAuto() {
clearTimeout(this.searchTime);
this.search();
let self = this;
this.searchTime = setTimeout(function () {
self.searchAuto();
}, 1000 * 60 * 5);
},
search() {
this.getGroupData();
this.getMeterGroup();
},
getGroupData() {
axios.getGroupData({ dictLetter: '总负荷' }).then((res) => {
if (res.data && res.data.body) {
this.monitorData[0].value = res.data.body.totalCount;
this.monitorData[1].value = res.data.body.onLineCount;
this.monitorData[2].value = res.data.body.offLineCount;
this.monitorData[3].value = res.data.body.alarmsTotal;
this.monitorData[4].value = res.data.body.handledCount;
this.monitorData[5].value = res.data.body.unHandledCount;
this.loadRate = res.data.body.loadRate > 100 ? 100 : res.data.body.loadRate;
this.alarmList = res.data.body.alarmList;
}
})
},
getMeterGroup() {
axios.getMeterGroup({ dictLetter: '总负荷' }).then((res) => {
if (res.data && res.data.body && res.data.body.length) {
this.meterGroupId = res.data.body[0].id;
this.mainMeterGroupId = res.data.body[0].id;
this.meterGroupName = res.data.body[0].name;
this.changeTrend(this.trendDimension);
this.changeWaste(this.wasteDimension);
this.getRankData(this.meterGroupId);
}
})
},
changeTrend(dimension) {
this.trendDimension = dimension;
let params = {
energyType: 1,
condition: ["usageAmount"],
meterGroupId: this.meterGroupId,
isOrgData: true,
isInjection: 0
}
let paramList = [
{
...params,
dimension,
date: moment(new Date()).format("YYYY-MM-DD HH:mm:ss"),
endDate: moment(new Date()).format("YYYY-MM-DD HH:mm:ss"),
},
{
...params,
dimension,
date: moment(new Date()).add(-1, dimension).format("YYYY-MM-DD HH:mm:ss"),
endDate: moment(new Date()).add(-1, dimension).format("YYYY-MM-DD HH:mm:ss"),
},
];
Promise.all(
paramList.map((i) => {
return axios.ogetMeterStationResp(i);
})
).then((reslist) => {
let xAxis = reslist[0].data.body[0].xdate.map(x => { return x.slice(-2) })
let option = {
grid: {
top: '27%',
right: '3%',
bottom: '15%',
left: '13%',
},
legend: {
textStyle: {
color: '#C0D7FE'
},
left: 'right',
padding: [20, 20, 0, 0]
},
xAxis: xAxis,
series: [
{
name: dimension == 'day' ? '本日' : dimension == 'month' ? '本月' : '本年',
ydata: reslist[0].data.body[0].gwYDate,
type: 'line',
color: '#0CC8E6',
areaColor: new echarts.graphic.LinearGradient(0, 0, 0, 1, [
{
offset: 0,
color: '#043953'
},
{
offset: 1,
color: 'rgba(7, 17, 38, 0)'
}
])
},
{
name: dimension == 'day' ? '昨日' : dimension == 'month' ? '上月' : '去年',
ydata: reslist[1].data.body[0].gwYDate,
type: 'line',
color: '#08BA57',
areaColor: new echarts.graphic.LinearGradient(0, 0, 0, 1, [
{
offset: 0,
color: '#04392f'
},
{
offset: 1,
color: 'rgba(7, 17, 38, 0)'
}
])
},
],
}
this.trendOption = option;
})
},
changeWaste(dimension) {
this.wasteDimension = dimension;
axios.getWasteEnergyData({ parentId: this.meterGroupId, dimension }).then((res) => {
let arr = [];
if (res.data && res.data.body && res.data.body.length) {
arr = res.data.body.map(item => {
return {
...item,
// usageAmount: Math.floor(item.usageAmount * 100) / 100
usageAmount: item.usageAmount.toFixed(2)
}
})
}
this.wasteData = arr;
})
},
getRankData(meterGroupId) {
let date = moment(new Date()).format("YYYY-MM-DD");
let params = {
date: date,
dimension: "day",
dimensionType: "nature",
energyType: 1,
groupType: 1,
level: -1,
nodeType: "meterGroup",
parentId: meterGroupId,
};
axios.meterGroupRankDayUsage({ params }).then((res) => {
if (res.data) {
this.rankData = res.data;
this.getGrouddata();
}
});
},
Setsigledimension(type, groud) {
if (groud == "groud") {
if (this.groudDimension.includes(type)) {
let arr = [];
this.groudDimension.forEach((item) => {
if (item != type) {
arr.push(item);
}
});
this.groudDimension = arr;
this.setOptionLine();
} else {
this.groudDimension.push(type);
}
this.getGrouddata();
} else if (groud == "dimension") {
this.unitDimension = type;
this.getGrouddata();
}
},
getGrouddata() {
if (!this.rankData.length) return;
let params = {
dimension: this.unitDimension,
energyType: 1,
isOrgData: this.level == 1 ? true : false,
condition: this.groudDimension,
meterGroupId: this.meterGroupId || null,
};
params.date = moment(new Date()).format("YYYY-MM-DD HH:mm:ss");
params.endDate = moment(new Date()).format("YYYY-MM-DD HH:mm:ss");
let self = this;
axios.cancel("ogetMeterStationResp");
if (this.unitDimension == "month") {
let paramList = [
params,
{
...params,
date: moment(new Date())
.add(-1, "month")
.format("YYYY-MM-DD HH:mm:ss"),
endDate: moment(new Date())
.add(-1, "month")
.format("YYYY-MM-DD HH:mm:ss"),
},
];
let leng =
moment(new Date()).add(-1, "month").endOf("month").format("DD") - 1 >=
29
? 29
: 28;
let toleng = moment(new Date()).format("DD") - 0;
Promise.all(
paramList.map((i) => {
return axios.ogetMeterStationResp(i);
})
).then((reslist) => {
if (reslist[0].data) {
let arr = [];
reslist[0].data.body.forEach((item, index) => {
let item1 = reslist[1].data.body[index];
let obj = {
...item,
gwYDate: [
...item1.gwYDate.slice(-(leng - toleng + 1)),
...item.gwYDate.slice(0, toleng),
],
outputDate: item1.outputDate && item.outputDate ? [
...item1.outputDate.slice(-(leng - toleng + 1)),
...item.outputDate.slice(0, toleng),
] : null,
singleDate: item1.singleDate && item.singleDate ? [
...item1.singleDate.slice(-(leng - toleng + 1)),
...item.singleDate.slice(0, toleng),
] : null,
xdate: [
...item1.xdate.slice(-(leng - toleng + 1)),
...item.xdate.slice(0, toleng),
],
};
arr.push(obj);
});
self.respData = [...arr];
self.setOptionLine();
}
});
} else {
axios.ogetMeterStationResp({ ...params, isInjection: 0 }).then((res) => {
if (res.data && res.data.body && res.data.body.length) {
self.respData = res.data.body;
self.setOptionLine();
} else {
this.singleChart_groud ? this.singleChart_groud.clear() : "";
}
});
}
},
setOptionLine() {
let self = this;
if (!self.groudDimension.length) {
self.lineOption = {};
return;
}
let series = [];
if (self.groudDimension.includes("usageAmount")) {
let gwYDate = self.respData[self.importantIndex].gwYDate ? self.respData[self.importantIndex].gwYDate.map(x => x.toFixed(2)) : [];
series.push({
ydata: gwYDate,
name: "能耗",
type: 'line',
color: 'rgb(173, 255, 47)',
});
}
if (self.groudDimension.includes("single")) {
let singleDate = self.respData[self.importantIndex].singleDate ? self.respData[self.importantIndex].singleDate.map(x => x.toFixed(2)) : [];
series.push({
ydata: singleDate,
name: "单耗",
type: 'line',
color: 'rgb(244, 164, 96)',
});
}
if (self.groudDimension.includes("output")) {
let outputDate = self.respData[self.importantIndex].outputDate ? self.respData[self.importantIndex].outputDate.map(x => x.toFixed(2)) : [];
series.push({
ydata: outputDate,
name: "产量",
type: 'line',
color: 'rgb(2, 126, 247)',
});
}
let option = {
grid: {
top: '20%',
right: '5%',
bottom: '10%',
left: '10%',
},
xAxis: self.respData[self.importantIndex].xdate,
series: series,
legend: {
textStyle: {
color: '#C0D7FE'
},
left: 'right',
padding: [20, 20, 0, 0]
},
tooltip: {
trigger: 'axis',
axisPointer: {
type: 'shadow',
label: {
backgroundColor: '#6a7985'
}
},
},
};
self.singleMeterName = self.respData[self.importantIndex].meterGroupName == '全厂' ? '整体' : self.respData[self.importantIndex].meterGroupName;
self.lineOption = option
// self.setSingleLine(data, "singleChart_groud");
},
rowclick(row) {
clearTimeout(this.rowclickTime);
let self = this;
this.rowclickTime = setTimeout(() => {
self.respData.forEach((item, index) => {
if (item.meterGroupId == row.nodeId) {
self.importantIndex = index;
self.setOptionLine();
}
});
}, 200);
},
rowDblclick(row) {
clearTimeout(this.rowclickTime);
this.level = -1;
this.meterGroupId = row.nodeId;
this.importantIndex = 0;
this.getRankData(this.meterGroupId);
},
handlerReset() {
this.level = 1;
this.meterGroupId = this.mainMeterGroupId;
this.importantIndex = 0;
this.getRankData(this.mainMeterGroupId);
}
},
mounted() {
let self = this;
this.$handleSize();
this.$store.state.femsStore.kanban_name = "电子车间能源监控看板";
this.$eventbus.$on("fems_up_orgid", () => {
this.$nextTick(() => {
self.searchAuto();
});
});
const viewElem = document.body;
const resizeObserver = new ResizeObserver(() => {
this.$handleSize();
});
resizeObserver.observe(viewElem);
},
beforeDestroy() {
this.$eventbus.$off("fems_up_orgid");
clearTimeout(this.searchTime);
clearTimeout(this.rowclickTime);
},
};
</script>
<style lang="less">
@import './index.less';
</style>
全体样式index.less
.kanban_home_electric {
    height: 1080px;
    width: 1920px;

    .kanban__body {
        width: 100%;
        height: 100%;
        display: flex;
        justify-content: space-between;
        padding: 105px 24px 0;

        .dimension_box {
            position: absolute;
            height: 40px;
            width: 160px;
            top: 8px;
            left: 16px;
            display: flex;
            justify-content: space-around;
            align-items: center;
            z-index: 1000;

            .btn {
                width: 40px;
                height: 28px;
                line-height: 28px;
                text-align: center;
                color: #81e0ff;
                cursor: pointer;
            }

            .active {
                box-shadow: inset 0px 0px 8px 0px #3191cf;
                border-radius: 2px;
            }
        }

        .body_left {
            width: 614px;
            height: 100%;

            .whole_monitor {
                .content {
                    height: 204px;
                    padding: 16px;

                    .card_bg {
                        width: 582px;
                        height: 170px;
                        background-repeat: no-repeat;
                        background-size: 100% 100%;
                        background-image: url(../../assets/homeElectric/card_bg.png);
                        position: relative;

                        .ball_bg {
                            width: 181px;
                            height: 186px;
                            background-repeat: no-repeat;
                            background-size: 100% 100%;
                            background-image: url(../../assets/homeElectric/ball_bg.png);
                            position: absolute;
                            top: 9px;
                            left: 212px;

                            .progress {
                                position: absolute;
                                top: 26px;
                                left: 26px;

                                .el-progress-circle__track {
                                    stroke: #042d5c !important;
                                }

                                svg>path:nth-child(2) {
                                    stroke: url(#blue);
                                }
                            }

                            .value_box {
                                position: absolute;
                                width: 85%;
                                top: 54px;
                                text-align: center;
                                font-size: 14px;

                                .value {
                                    span {
                                        font-size: 22px;
                                    }
                                }
                            }
                        }

                        .content_left {
                            position: absolute;
                            top: 15px;
                            left: 18px;
                            height: 143px;
                            display: flex;
                            flex-direction: column;
                            justify-content: space-between;
                        }

                        .content_right {
                            position: absolute;
                            top: 15px;
                            left: 397px;
                            height: 143px;
                            display: flex;
                            flex-direction: column;
                            justify-content: space-between;
                        }

                        .content_box {
                            display: flex;
                            align-items: center;
                            height: 44px;

                            img {
                                height: 44px;
                                width: 44px;
                            }

                            .name {
                                width: 85px;
                                margin-left: 10px;
                                text-align: left;
                                color: rgba(255, 255, 255, 0.8);
                            }

                            .value {
                                width: 50px;
                                text-align: left;
                                font-weight: bold;
                            }
                        }
                    }
                }
            }

            .whole_trend {
                .content {
                    height: 262px;
                    position: relative;

                    .group_chart {
                        height: 100%;
                    }
                }
            }

            .whole_alarm {
                .content {
                    height: 330px;
                }
            }
        }

        .body_center {
            width: 614px;
            height: 100%;

            .line_monitor {
                .content {
                    height: 427px;
                    position: relative;

                    .dimension_box {
                        width: 350px;

                        .btn {
                            width: 50px;
                        }
                    }

                    .group_chart {
                        height: 100%;
                    }
                }
            }

            .line_waste {
                .content {
                    height: 427px;
                    position: relative;
                    padding-top: 60px;
                    //   overflow: hidden;
                    overflow-y: scroll;
                    display: flex;
                    flex-wrap: wrap;
                    align-content: flex-start;

                    .waste_box {
                        width: 182px;
                        height: 106px;
                        margin: 0 0 16px 15px;
                        background-repeat: no-repeat;
                        background-size: 100% 100%;
                        background-image: url(../../assets/homeElectric/waste_bg.png);

                        .name {
                            margin: 22px 0 16px 0;
                            font-size: 16px;
                            text-align: center;
                        }

                        .value {
                            color: #0cc8e6;
                            font-size: 22px;
                            text-align: center;
                            white-space: nowrap;
                            text-overflow: ellipsis;
                            overflow: hidden;

                            span {
                                font-size: 16px;
                            }
                        }
                    }
                }
            }
        }

        .body_right {
            width: 614px;
            height: 100%;

            .whole_rank {
                .content {
                    height: 427px;
                    position: relative;

                    .reset {
                        position: absolute;
                        width: 40px;
                        height: 28px;
                        top: -36px;
                        right: 38px;
                        line-height: 28px;
                        text-align: center;
                        color: #81e0ff;
                        border-radius: 3px;
                        cursor: pointer;
                        z-index: 11;
                        border: 1px solid #3191cf;
                        background-color: rgba(22, 45, 85, 0.1);

                        &:hover {
                            color: #0094ff;
                            border: 1px solid #0094ff;
                        }
                    }
                }
            }

            .main_monitor {
                .content {
                    height: 427px;
                }
            }
        }
    }
}
group_plate组件:
<template>
  <div class="plate">
    <div class="group_title">{{title}}</div>
    <div class="plate_cont">
      <slot></slot>
    </div>
    <div class="shape shape-top-left"></div>
    <div class="shape shape-top-right"></div>
    <div class="shape shape-bottom-left"></div>
    <div class="shape shape-bottom-right"></div>
  </div>
</template>
  <script>
export default {
  name: "plate",
  props: {
    title: {
      type: String,
      default: () => "",
    },
  },
};
  </script>
  <style lang="less">
.plate {
  position: relative;
  margin-bottom: 16px;
  margin-top: 0 !important;
  // font-size: 1.4vh;
  .group_title {
    font-size: 16px;
    text-align: center;
    color: #5bdfff;
    width: 100%;
    height: 40px;
    line-height: 40px;
    background-image: url(./../../../assets/businessMonitoring/panel_title.png);
    background-repeat: no-repeat;
    background-size: 100% 100%;
  }
}
</style>
group_chart组件
<template>
  <div class="group_chart" ref="group_chart"></div>
</template>
  <script>
import * as echarts from 'echarts';

export default {
  name: 'group_chart',
  props: {
    options: {
      type: Object,
      default: () => ({
        xAxis: [],
        yAxisName: '',
        series: [],
      }),
    },
  },
  data() {
    return {
      group_chart: null,
    };
  },
  methods: {
    // 绘制电用能折线图
    getOption() {
      if (this.group_chart) {
        this.group_chart.dispose();
        this.group_chart.clear();
      }
      if (!this.options.series || !this.options.series.length) return;
      let series = [];
      this.options.series.forEach(item => {
        if (item.type == 'line') {
          let obj = {
            name: item.name,
            data: item.ydata || [],
            type: item.type,
            symbolSize: 6,
            smooth: true,
            itemStyle: {
              normal: {
                color: item.color || "#0CC8E6",
              },
            },
            lineStyle: {
              normal: {
                width: 2,
                color: item.color || "#0CC8E6",
              },
            },
            areaStyle: item.areaColor ? {
              normal: {
                //右,下,左,上
                color: item.areaColor || new echarts.graphic.LinearGradient(0, 0, 0, 1, [
                  {
                    offset: 0,
                    color: '#043953'
                  },
                  {
                    offset: 1,
                    color: 'rgba(7, 17, 38, 0)'
                  }
                ])
              }
            } : null,
          };
          series.push(obj);
        } else if (item.type == 'bar') {
          let obj = {
            name: item.name,
            data: item.ydata || [],
            type: item.type,
            barWidth: 10,
            itemStyle: {
              barBorderRadius: 10,
              color: item.areaColor || new echarts.graphic.LinearGradient(0, 0, 1, 0, [{
                offset: 0, color: '#007EFA'
              }, {
                offset: 1, color: '#04CDE6'
              }])
            }
          };
          series.push(obj);
        }
      });

      let options = {
        grid: this.options.grid || {
          top: '15%',
          right: '3%',
          bottom: '15%',
          left: '10%',
        },
        legend: this.options.legend || {
          textStyle: {
            color: '#C0D7FE'
          },
          padding: [15, 0, 0, 0]
        },
        tooltip: this.options.tooltip || {
          trigger: 'axis',
          axisPointer: {
            type: 'shadow',
            label: {
              backgroundColor: '#6a7985'
            }
          },
          formatter: function (params) {
            if (params.length == 2) {
              return params[0].name + '<br>' + params[0].marker + `${params[0].seriesName}:` + params[0].data + '<br>' + params[1].marker + `${params[1].seriesName}:` + params[1].data;
            } else if (params.length == 1) {
              return params[0].name + '<br>' + params[0].marker + `${params[0].seriesName}:` + params[0].data
            } else {
              return null;
            }
          }
        },
        xAxis: {
          type: 'category',
          boundaryGap: ['2%', '2%'],
          axisTick: {
            alignWithLabel: true
          },
          axisLine: {
            onZero: false,
            lineStyle: { color: '#2D4866' }
          },
          axisLabel: {
            color: '#A8BADA',
          },
          data: this.options.xAxis,
        },
        yAxis: {
          type: 'value',
          name: this.options.yAxisName || '',
          nameTextStyle: {
            padding: [0, 0, 0, -20],
            color: '#A8BADA',

          },
          axisLabel: {
            color: '#A8BADA'
          },
          splitLine: {
            lineStyle: { color: '#061e3f', type: 'solid' }
          },
        },
        series,
      };

      this.group_chart = echarts.init(this.$refs.group_chart);
      this.group_chart.setOption(options, true);
    },
  },
  mounted() {
    this.getOption();
  },
  watch: {
    options: {
      handler() {
        this.getOption();
      },
      deep: true,
    },
  },
};

  </script>
  <style lang="less">
.group_chart {
  width: 100%;
  height: 90%;
}
</style>
group_table组件
<template>
  <div class="vexTable" ref="vexTable">
    <el-table
      :data="tableData"
      style="width: 100%"
      size="mini"
      @select="onSelect"
      :span-method="SpanMethod"
      border
      :stripe="stripe"
      :show-overflow-tooltip="true"
      :height="height || tableheight"
      ref="multipleTable"
      @row-click="rowClick"
      @row-dblclick="rowDblclick"
      :show-summary="showSummary"
    >
      <el-table-column type="selection" width="55" v-if="selection" fixed="left" :resizable="false" :selectable="selectable"></el-table-column>
      <el-table-column type="selection" width="55" v-if="showchoice" fixed="left" :resizable="false">
        <template slot-scope="scope">
          <div style="text-align: center">
            <span class="choice" :style="`background:${
                  choice.id && scope.row.id == choice.id
                    ? 'rgb(79, 165, 255)'
                    : ''
                }`"></span>
          </div>
        </template>
      </el-table-column>
      <el-table-column type="index" width="55" v-if="Serialnumber" fixed="left" :resizable="false"></el-table-column>
      <el-table-column
        :prop="item.prop"
        :width="item.width || colums_width || ''"
        :label="item.label || item.title"
        :show-overflow-tooltip="item.tooltip"
        :min-width="item.minWidth"
        :resizable="item.resizable || false"
        v-for="(item, index) in columns"
        :key="index"
        :fixed="item.fixed || winFixed || false"
      >
        <template slot-scope="scope">
          <div style="overflow: hidden">
            <renderFunction v-if="item.type == 'render'" :render="item.render" :row="scope.row" :index="scope.$index" :column="item"></renderFunction>
            <div v-else-if="item.type === 'index'">{{ scope.$index + 1 }}</div>
            <div v-else-if="item.type === 'input'">
              <el-input v-model="scope.row[item.prop]" size="mini"></el-input>
            </div>
            <div v-else-if="item.type === 'searchMore'">
              <el-input v-model="scope.row[item.prop]" type="input" size="mini" v-if="item.type == 'searchMore'" :disabled="item.disabled" style="margintop: 6px">
                <el-button slot="append" icon="el-icon-search" @click="searchMore(scope.row[item.key], scope.$index)"></el-button>
              </el-input>
            </div>
            <el-tooltip v-else-if="item.type === 'tooltip'" class="item" effect="dark" :content="item.content(scope.row[item.prop])" placement="top-start">
              <!-- <div>{{scope.row[item.prop]}}</div> -->
              <renderFunction :render="item.render" :row="scope.row" :index="scope.$index" :column="item"></renderFunction>
            </el-tooltip>
            <div v-else style="text-align: center">{{ scope.row[item.prop] }}</div>
          </div>
        </template>
        <el-table-column
          :prop="items.prop"
          :width="items.width || colums_width || ''"
          :label="items.label || items.title"
          :show-overflow-tooltip="items.tooltip"
          :min-width="items.minWidth"
          :resizable="items.resizable || false"
          v-for="(items, index) in item.children"
          :key="index"
          :fixed="items.fixed || winFixed || false"
        >
          <template slot-scope="scope">
            <div style="overflow: hidden">
              <renderFunction v-if="items.type == 'render'" :render="items.render" :row="scope.row" :index="scope.$index" :column="items"></renderFunction>
              <div v-else-if="items.type === 'index'">{{ scope.$index + 1 }}</div>
              <div v-else-if="items.type === 'input'">
                <el-input v-model="scope.row[items.prop]" size="mini"></el-input>
              </div>
              <div v-else-if="items.type === 'searchMore'">
                <el-input v-model="scope.row[items.prop]" type="input" size="mini" v-if="items.type == 'searchMore'" :disabled="items.disabled" style="margintop: 6px">
                  <el-button slot="append" icon="el-icon-search" @click="searchMore(scope.row[items.key], scope.$index)"></el-button>
                </el-input>
              </div>
              <div v-else style="text-align: center">{{ scope.row[items.prop] }}</div>
            </div>
          </template>
        </el-table-column>
      </el-table-column>
    </el-table>
  </div>
</template>
  <script>
import renderFunction from "../../../components/renderFunction";
import ResizeObserver from "resize-observer-polyfill";

export default {
  components: { renderFunction },
  props: {
    Serialnumber: {
      type: Boolean,
      default: () => true,
    },
    columns: {
      type: Array,
      default: () => [],
    },
    data: {
      type: Array,
      default: () => [],
    },
    colums_width: {
      type: Number,
      default: () => 0,
    },
    selection: {
      type: Boolean,
      default: () => false,
    },
    showchoice: {
      type: Boolean,
      default: () => false,
    },
    ruleForm: {
      type: Object,
      default: () => ({}),
    },
    options: {
      type: Object,
      default: () => ({}),
    },
    height: {
      type: Number,
      default: () => 0,
    },
    winFixed: {
      type: String,
      default: () => "",
    },
    columnIndex: {
      type: Number,
      default: () => 1,
    },
    selectable: {
      type: Function,
      default: (row, index) => {
        return true;
      },
    },
    stripe: {
      type: Boolean,
      default: () => false,
    },
    showSummary: {
      type: Boolean,
      default: () => false,
    },
  },
  data() {
    return {
      tableData: [],
      choice: {},
      newcolumns: [],
      tableWidth: 100,
      tableheight: 0,
    };
  },
  watch: {
    data: {
      handler() {
        this.setData();
      },
      deep: true,
    },
    columns: {
      handler() {
        this.newcolumns = [];
        this.setnewcolumns(this.columns);
      },
      deep: true,
    },
    newcolumns: {
      handler() {
        this.setData();
      },
      deep: true,
    },
    $route: {
      handler() {
        this.setData();
      },
      deep: true,
    },
  },
  mounted() {
    this.setnewcolumns(this.columns);
    this.setData();
    let self = this;
    let resizeFinsh = true;
    const viewElem = this.$refs.vexTable;
    const resizeObserver = new ResizeObserver(() => {
      if (resizeFinsh) {
        setTimeout(function () {
          if (
            self.$refs.vexTable &&
            (self.$refs.vexTable.offsetWidth != self.tableWidth ||
              self.$refs.vexTable.offsetHeight != self.offsetHeight)
          ) {
            self.tableWidth = self.$refs.vexTable.offsetWidth;
            self.tableheight = self.$refs.vexTable.offsetHeight;
            self.setData();
          }
          resizeFinsh = true;
        }, 50);
        resizeFinsh = false;
      }
    });
    resizeObserver.observe(viewElem);
  },
  methods: {
    setData() {
      // this.tableData = JSON.parse(JSON.stringify(this.data));
      this.tableData = this.data;
      this.$refs.multipleTable.doLayout();
    },
    setnewcolumns(list) {
      list.forEach((item) => {
        if (!item.children || !item.children.length) {
          this.newcolumns.push(item);
        } else {
          this.setnewcolumns(item.children);
        }
      });
    },
    addComit(row, item) {
      this.$emit("addComit", row, item);
    },
    onSelect(data) {
      this.$emit("onSelect", data);
    },
    SpanMethod({ row, columnIndex }) {
      const thisColumn = this.newcolumns[columnIndex - this.columnIndex];
      if (thisColumn && thisColumn.merge) {
        return {
          rowspan: row[thisColumn.rowspan],
          colspan: 1,
        };
      }
      return {
        rowspan: 1,
        colspan: 1,
      };
    },
    handler(row, item, index, rowIndex) {
      this.$emit("handlerAdd", {
        row,
        item,
        index,
        rowIndex,
      });
    },
    searchMore(item, index, rowIndex) {
      this.$emit("searchMore", { item, index, rowIndex });
    },
    selectChange(item, option, row) {
      if (item.labelProp) {
        const arr = option.filter((i) => i.paramValue === row[item.prop]);
        if (arr.length) {
          row[item.labelProp] = arr[0].paramDesc;
        }
      }
      this.$emit("selectChange", { item, option, row });
    },
    emitTable() {
      return this.tableData;
    },
    rowClick(data, row) {
      this.$emit("rowClick", data);
      if (this.showchoice) {
        this.choice = data;
        this.$refs.multipleTable.clearSelection();
        this.$emit("onSelect", data);
      }
    },
    rowDblclick(data) {
      if (this.showchoice) {
        this.choice = data;
        this.$refs.multipleTable.clearSelection();
      }
      this.$emit("rowDblclick", data);
    },
    clearSelection() {
      this.$refs.multipleTable.clearSelection();
      this.$emit("onSelect", {});
    },
  },
};
  </script>
  <style lang="less">
// .fems-layout .vexTable .el-table--mini td,
// .fems-wuxi-layout .vexTable .el-table--mini td,
// .fems-layout .vexTable .el-table--mini th,
// .fems-wuxi-layout .vexTable .el-table--mini th {
//   padding: 0.45vh 0 !important;
// }
.vexTable {
  width: 100%;
  height: 100%;

  .el-table__header .cell {
    text-align: center;
  }
  .choice {
    display: inline-block;
    width: 15px;
    height: 15px;
    border: 1px solid #ccc;
  }
  .el-table__body-wrapper,
  .el-textarea__inner {
    // &::-webkit-scrollbar-thumb {
    // background: blue;
    // }
    &::-webkit-scrollbar-thumb:hover {
      background: rgb(24, 144, 255);
    }
    &::-webkit-scrollbar {
      width: 6px;
      height: 6px;
    }
  }
  .col_add {
    height: 100%;
    .el-icon-plus {
      border: 1px solid #ccc;
      cursor: pointer;
    }
  }
  .areaMore {
    display: flex;
    .btn {
      width: 30px;
      text-align: center;
      .el-icon-s-order {
        display: inline-block;
        width: 20px;
        height: 20px;
        border: 1px solid #ccc;
        border-radius: 5px;
        color: #ccc;
        line-height: 20px;
        &:hover {
          color: blue;
          border: 1px solid blue;
        }
      }
    }
    .area {
      flex: 1;
    }
  }
}
.newKanbanTable {
  .el-table__header .cell {
    text-align: center;
  }
  .choice {
    display: inline-block;
    width: 15px;
    height: 15px;
    border: 1px solid #ccc;
  }
  .el-table__body-wrapper,
  .el-textarea__inner {
    &::-webkit-scrollbar-thumb {
      background-color: rgb(14, 44, 82);
    }
    &::-webkit-scrollbar-track-piece {
      background-color: rgb(5, 13, 43);
    }
    &::-webkit-scrollbar-thumb:hover {
      background: rgb(24, 144, 255);
    }
    &::-webkit-scrollbar {
      width: 0.5vh;
      height: 0.5vh;
    }
  }

  .el-table,
  .el-table__expanded-cell,
  .el-table th,
  .el-table tr {
    background: none;
    border: none;
    font-size: 16px;
    .cell {
      font-size: 1.2vh;
      padding: 0 5px 0 5px;
      white-space: nowrap;
      text-align: center;
      cursor: pointer;
    }
  }
  .el-table--mini td,
  .el-table--mini th {
    padding: 0.6vh 0;
  }
  .el-table th .cell {
    color: #fff;
    line-height: 2.6vh;
  }
  .el-table__cell {
    border: none;
  }
  .el-table td {
    border: none;
    .cell {
      line-height: 2.6vh;
      color: rgba(255, 255, 255, 0.7);
    }
  }
  .el-table::before,
  .el-table::after {
    background: none;
  }
  .el-table--enable-row-hover .el-table__body tr:hover > td {
    background-color: rgb(17, 40, 83);
  }
  .el-table .el-table__body .el-table__row--striped td {
    background: rgb(10, 30, 56);
  }
  .el-table .el-table__body .hover-row td {
    background: rgb(10, 30, 56);
  }
  .el-table .el-table__fixed-right::before {
    background-color: rgba(0, 0, 0, 0);
  }
  .el-table--striped .el-table__body tr.el-table__row--striped.current-row td,
  .el-table__body tr.current-row > td {
    background-color: rgb(8, 40, 83);
  }
  .has-gutter {
    background-color: rgb(10, 30, 56);
    th .cell {
      color: #bfd6ff;
    }
  }
  .el-table__fixed-right-patch {
    background-color: rgba(0, 0, 0, 0);
    border-color: rgba(0, 0, 0, 0);
  }
  .el-table--border th.gutter:last-of-type {
    border-bottom: 1px solid #16347b;
    border-bottom-width: 1px;
  }
}
</style>
为了减少单文件代码行数而单独封装的columns.js文件
let arrow_up = require('../../../assets/businessMonitoring/arrow_up.png');
let arrow_down = require('../../../assets/businessMonitoring/arrow_down.png');
const columns = {
alarmColumns: [
{
title: "节点名称",
type: "render",
prop: "title",
minWidth: 150,
render: (h, params) => {
return h(
"div",
{
style: {
color: "#fff",
whiteSpace: "nowrap",
},
},
params.row.meterName
);
},
},
{
title: "报警类型",
type: "render",
prop: "title",
minWidth: 100,
render: (h, params) => {
return h(
"div",
{
style: {
color: "#fff",
whiteSpace: "nowrap",
},
},
params.row.alarmTypeName
);
},
},
{
title: "日期",
type: "render",
prop: "title",
minWidth: 130,
render: (h, params) => {
return h(
"div",
{
style: {
color: "#fff",
whiteSpace: "nowrap",
},
},
params.row.startTime.slice(0, 10)
);
},
},
{
title: "责任人",
type: "render",
prop: "title",
minWidth: 80,
render: (h, params) => {
return h(
"div",
{
style: {
color: "#fff",
whiteSpace: "nowrap",
},
},
params.row.userMipName
);
},
},
{
title: "状态",
type: "render",
prop: "title",
minWidth: 80,
render: (h, params) => {
return h(
"div",
{
style: {
color: params.row.handleStatus ? '#35B45E' : '#E76746',
whiteSpace: "nowrap",
},
},
params.row.handleStatus ? '已处理' : '未处理'
);
},
},
],
mainColumns: [
{
title: "排名",
type: "render",
prop: "title",
minWidth: 80,
render: (h, params) => {
return h(
"div",
{
style: {
display: 'flex',
justifyContent: 'center',
alignItems: 'center',
},
},
[
h('div', {
style: {
color: params.index < 3 ? "#42EA86" : '#5CE2FF',
whiteSpace: "nowrap",
background: params.index < 3 ? '#0B2518' : '#011D47',
width: '32px',
height: '26px',
borderTop: params.index < 3 ? '1px solid #2A904C' : '1px solid #0058A4',
borderBottom: params.index < 3 ? '1px solid #2A904C' : '1px solid #0058A4',
},
},
params.index + 1),
]
);
},
},
{
title: "设备名称",
type: "render",
prop: "title",
minWidth: 150,
render: (h, params) => {
return h(
"div",
{
style: {
color: "#fff",
whiteSpace: "nowrap",
},
},
params.row.meterGroupName
);
},
},
{
title: "开工用能",
type: "render",
prop: "title",
minWidth: 100,
render: (h, params) => {
return h(
"div",
{
style: {
color: "#fff",
whiteSpace: "nowrap",
},
},
params.row.usageAmount
);
},
},
{
title: "闲时用能",
type: "render",
prop: "title",
minWidth: 100,
render: (h, params) => {
return h(
"div",
{
style: {
color: "#fff",
whiteSpace: "nowrap",
},
},
params.row.wasteUsage
);
},
},
{
title: "闲时用能占比",
type: "render",
prop: "title",
minWidth: 100,
render: (h, params) => {
return h(
"div",
{
style: {
color: params.row.usageRate < 0 ? '#35B45E' : '#E76746',
whiteSpace: "nowrap",
},
},
params.row.usageRate + '%'
);
},
},
],
rankColumns: [
{
title: "排名",
type: "render",
prop: "title",
minWidth: 80,
render: (h, params) => {
return h(
"div",
{
style: {
display: 'flex',
justifyContent: 'center',
alignItems: 'center',
},
},
[
h('div', {
style: {
color: params.index < 3 ? "#42EA86" : '#5CE2FF',
whiteSpace: "nowrap",
background: params.index < 3 ? '#0B2518' : '#011D47',
width: '32px',
height: '26px',
borderTop: params.index < 3 ? '1px solid #2A904C' : '1px solid #0058A4',
borderBottom: params.index < 3 ? '1px solid #2A904C' : '1px solid #0058A4',
},
},
params.index + 1),
]
);
},
},
{
title: "产线名称",
type: "render",
prop: "title",
minWidth: 150,
render: (h, params) => {
return h(
"div",
{
style: {
color: "#fff",
whiteSpace: "nowrap",
},
},
params.row.deviceName
);
},
},
{
title: "电量(万kW·h)",
type: "render",
prop: "title",
minWidth: 100,
render: (h, params) => {
return h(
"div",
{
style: {
color: "#fff",
whiteSpace: "nowrap",
},
},
(params.row.electricity * 10000).toFixed(0) / 10000
);
},
},
{
title: "日环比",
type: "render",
prop: "title",
minWidth: 100,
render: (h, params) => {
if (params.row.momData) {
return h(
"div", {
style: {
display: 'flex',
justifyContent: 'center',
alignItems: 'center',
}
},
[h('img', {
domProps: {
align: 'center',
src: params.row.momData > 0
? arrow_up
: arrow_down,
},
style: {
width: '14px',
height: '14px',
margin: '0 4px',
}
})
, h('span', {
style: {
color:
params.row.momData > 0
? "#E76746"
: "#35B45E",
},
},
params.row.momData + "%"),
]
);
} else {
return h(
"div", {
style: {
color: "#fff",
}
},
'0%'
);
}
},
},
{
title: "日同比",
type: "render",
prop: "title",
minWidth: 100,
render: (h, params) => {
if (params.row.yoyData) {
return h(
"div", {
style: {
display: 'flex',
justifyContent: 'center',
alignItems: 'center',
}
},
[h('img', {
domProps: {
align: 'center',
src: params.row.yoyData > 0
? arrow_up
: arrow_down,
},
style: {
width: '14px',
height: '14px',
margin: '0 4px',
}
})
, h('span', {
style: {
color:
params.row.yoyData > 0
? "#E76746"
: "#35B45E",
},
},
params.row.yoyData + "%"),
]
);
} else {
return h(
"div", {
style: {
color: "#fff",
}
},
'0%'
);
}
},
},
],
}
export default columns;
那么总算是赶在离职前的最后一天把项目看板开发经验系列肝完了,希望其中的思路能帮助到接触看板开发的你~
之后随缘更新番外篇吧,感谢支持,THX


