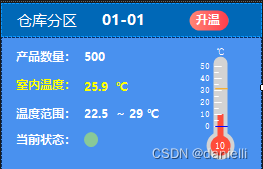
1.实现效果图
2.对数据库进行迁移
python manage.py makemigrations
python manage.py migrate
3.登录页面
{% load static%}
<!DOCTYPE html>
<html lang="en">
<head>
<meta charset="UTF-8">
<meta name="viewport" content="width=device-width, initial-scale=1.0">
<title>登录</title>
<style>
/* 清除浏览器默认边距,
使边框和内边距的值包含在元素的width和height内 */
* {
margin: 0;
padding: 0;
box-sizing: border-box;
}
/* 使用flex布局,让内容垂直和水平居中 */
section {
/* 相对定位 */
position: relative;
overflow: hidden;
display: flex;
justify-content: center;
align-items: center;
min-height: 100vh;
/* linear-gradient() 函数用于创建一个表示两种或多种颜色线性渐变的图片 */
background: linear-gradient(to bottom, #f1f4f9, #dff1ff);
}
/* 背景颜色 */
section .color {
/* 绝对定位 */
position: absolute;
/* 使用filter(滤镜) 属性,给图像设置高斯模糊*/
filter: blur(200px);
}
/* :nth-child(n) 选择器匹配父元素中的第 n 个子元素 */
section .color:nth-child(1) {
top: -350px;
width: 600px;
height: 600px;
background: #ff359b;
}
section .color:nth-child(2) {
bottom: -150px;
left: 100px;
width: 500px;
height: 500px;
background: #fffd87;
}
section .color:nth-child(3) {
bottom: 50px;
right: 100px;
width: 500px;
height: 500px;
background: #00d2ff;
}
.box {
position: relative;
}
/* 背景圆样式 */
.box .circle {
position: absolute;
background: rgba(255, 255, 255, 0.1);
backdrop-filter: blur(5px);
box-shadow: 0 25px 45px rgba(0, 0, 0, 0.1);
border: 1px solid rgba(255, 255, 255, 0.5);
border-right: 1px solid rgba(255, 255, 255, 0.2);
border-bottom: 1px solid rgba(255, 255, 255, 0.2);
border-radius: 50%;
animation-delay: calc(var(--x) * -1s);
}
@keyframes animate {
0%, 100%, {
transform: translateY(-50px);
}
50% {
transform: translateY(50px);
}
}
.box .circle:nth-child(1) {
top: -50px;
right: -60px;
width: 100px;
height: 100px;
}
.box .circle:nth-child(2) {
top: 150px;
left: -100px;
width: 120px;
height: 120px;
z-index: 2;
}
.box .circle:nth-child(3) {
bottom: 50px;
right: -60px;
width: 80px;
height: 80px;
z-index: 2;
}
.box .circle:nth-child(4) {
bottom: -80px;
left: 100px;
width: 60px;
height: 60px;
}
.box .circle:nth-child(5) {
top: -80px;
left: 140px;
width: 60px;
height: 60px;
}
/* 登录框样式 */
.container {
position: relative;
width: 400px;
min-height: 400px;
background: rgba(255, 255, 255, 0.1);
display: flex;
justify-content: center;
align-items: center;
backdrop-filter: blur(5px);
box-shadow: 0 25px 45px rgba(0, 0, 0, 0.1);
border: 1px solid rgba(255, 255, 255, 0.5);
border-right: 1px solid rgba(255, 255, 255, 0.2);
border-bottom: 1px solid rgba(255, 255, 255, 0.2);
}
.form {
position: relative;
width: 100%;
height: 100%;
padding: 50px;
}
.form h2 {
position: relative;
color: #fff;
font-size: 24px;
font-weight: 600;
letter-spacing: 5px;
margin-bottom: 30px;
cursor: pointer;
}
/* 登录标题的下划线样式 */
.form h2::before {
content: "";
position: absolute;
left: 0;
bottom: -10px;
width: 0px;
height: 3px;
background: #fff;
transition: 0.5s;
}
.form h2:hover:before {
width: 53px;
}
.form .inputBox {
width: 100%;
margin-top: 20px;
}
.form .inputBox input {
width: 100%;
padding: 10px 20px;
background: rgba(255, 255, 255, 0.2);
outline: none;
border: none;
border-radius: 30px;
border: 1px solid rgba(255, 255, 255, 0.5);
border-right: 1px solid rgba(255, 255, 255, 0.2);
border-bottom: 1px solid rgba(255, 255, 255, 0.2);
font-size: 16px;
letter-spacing: 1px;
color: #fff;
box-shadow: 0 5px 15px rgba(0, 0, 0, 0.05);
}
.form .inputBox input::placeholder {
color: #fff;
}
.form .inputBox input[type="submit"] {
background: #fff;
color: #666;
max-width: 100px;
margin-bottom: 20px;
font-weight: 600;
cursor: pointer;
}
.forget {
margin-top: 6px;
color: #fff;
letter-spacing: 1px;
}
.forget a {
color: #fff;
font-weight: 600;
text-decoration: none;
}
</style>
</head>
<body>
<section>
<div class="color"></div>
<div class="color"></div>
<div class="color"></div>
<div class="box">
<div class="circle" style="--x:0"></div>
<div class="circle" style="--x:1"></div>
<div class="circle" style="--x:2"></div>
<div class="circle" style="--x:3"></div>
<div class="circle" style="--x:4"></div>
<div class="container">
<div class="form">
<h2>登录页面</h2>
<form action="{% url 'pic:login' %}" method="post">
{% csrf_token %}
<div class="inputBox">
<input type="text" placeholder="姓名" name="username">
</div>
<div class="inputBox">
<input type="password" placeholder="密码" name="password">
</div>
<div class="inputBox">
<input type="submit" value="登录">
</div>
</form>
</div>
</div>
</div>
</section>
</body>
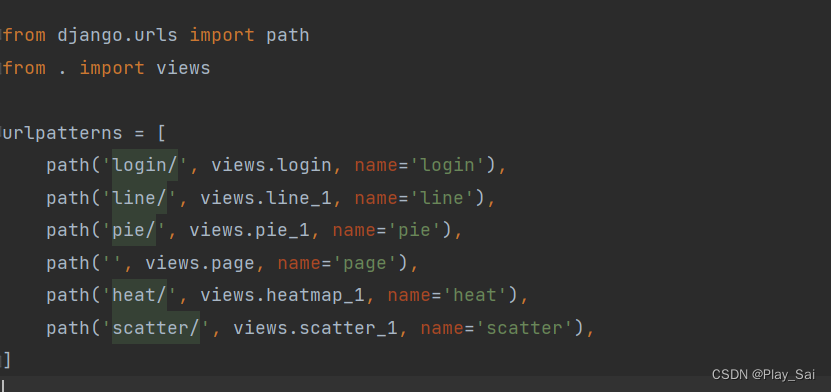
</html>4.设置路由
主路由
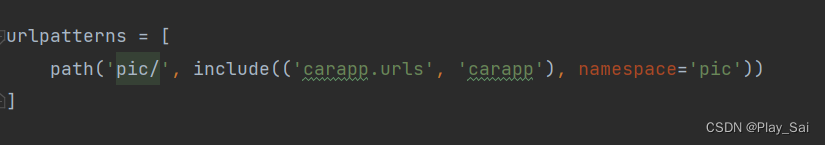
子路由
5.登录接口完整代码
def login(request):
    if request.method == "GET":
        return render(request, 'login.html')

    if request.method == "POST":
        username = request.POST.get("username")
        password = request.POST.get("password")
        print(username, password)
        try:
            # 使用 Django 自带的 authenticate 方法验证用户身份
            user = authenticate(request, username=username, password=password)
            if user:
                request.session["user"] = user.pk
                return redirect('pic:page')
            else:
                return redirect('pic:login')

        except User.DoesNotExist:
            messages.add_message(request, messages.WARNING, "用户名或密码错误!")
            return render(request, "login.html", {})
6.其他接口的完整代码
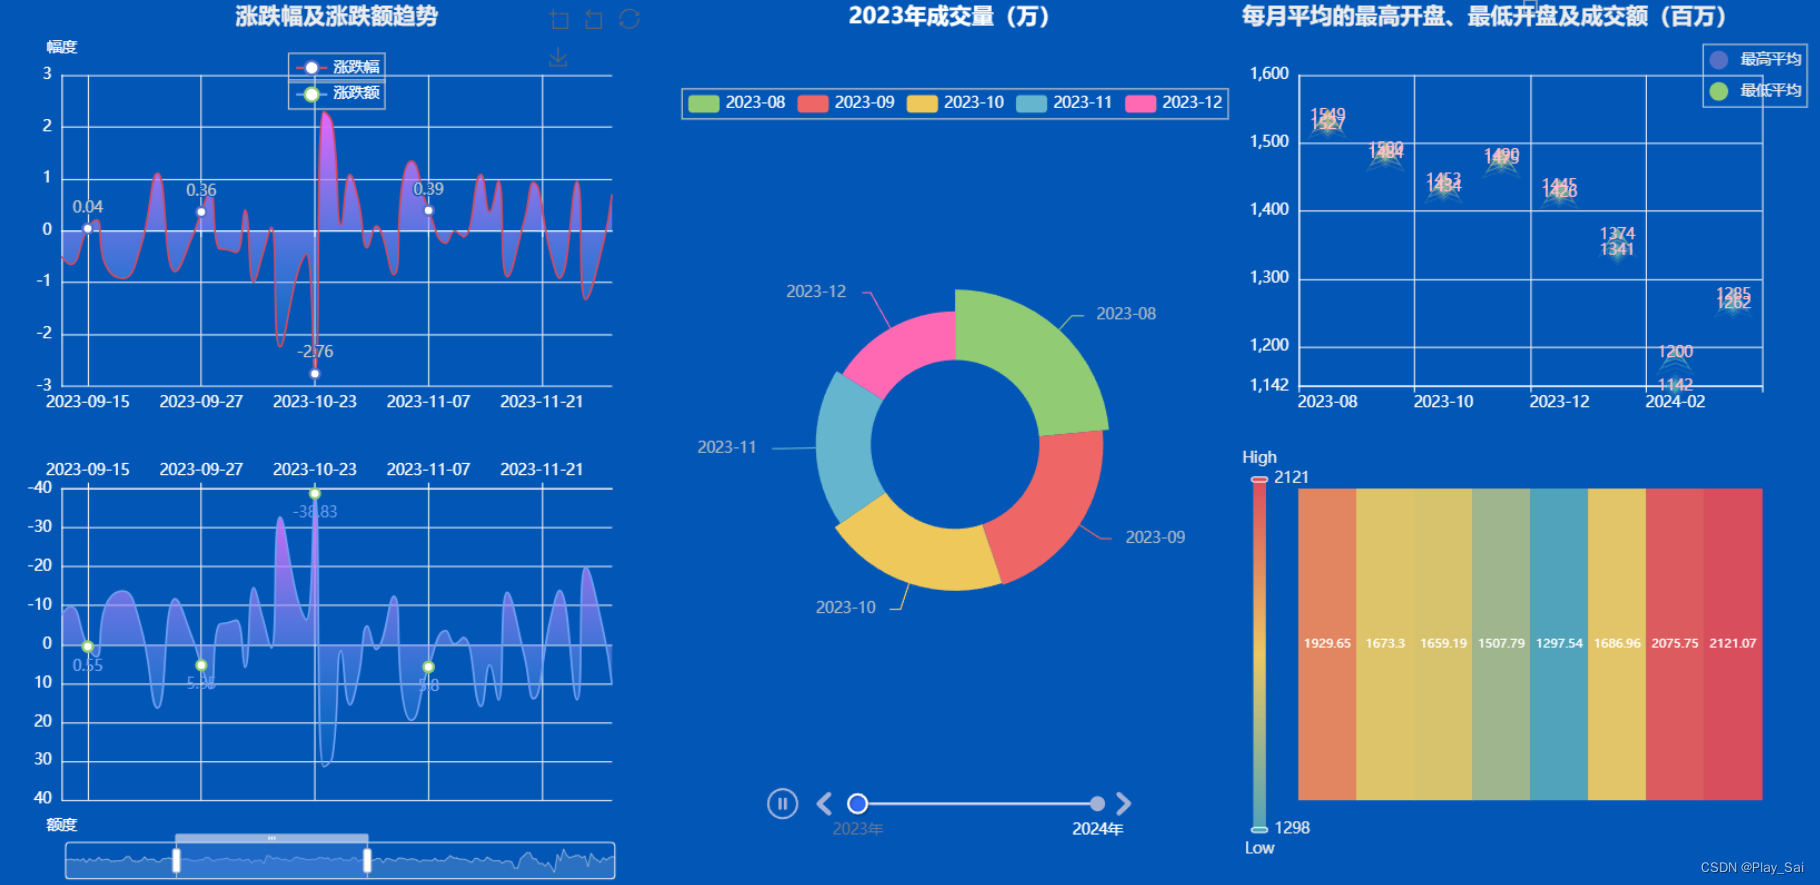
def line_1(request):
    area_color_js = (
        "new echarts.graphic.LinearGradient(0, 0, 0, 1, "
        "[{offset: 0, color: '#eb64fb'}, {offset: 1, color: '#3fbbff0d'}], false)"
    )
    l1 = (
        Line()
            .add_xaxis(xaxis_data=data['日期'].dt.strftime('%Y-%m-%d').tolist())
            .add_yaxis(
            series_name="涨跌幅",
            y_axis=data['涨跌幅'].tolist(),
            symbol_size=8,
            is_hover_animation=False,
            label_opts=opts.LabelOpts(is_show=True),
            linestyle_opts=opts.LineStyleOpts(width=1.5, color='#D14A61'),
            is_smooth=True,
            areastyle_opts=opts.AreaStyleOpts(color=JsCode(area_color_js), opacity=1),
        )
            .set_global_opts(
            title_opts=opts.TitleOpts(
                title="涨跌幅及涨跌额趋势", pos_left="center",
                title_textstyle_opts=opts.TextStyleOpts(color='#ededed')
            ),
            tooltip_opts=opts.TooltipOpts(trigger="axis"),
            axispointer_opts=opts.AxisPointerOpts(
                is_show=True, link=[{"xAxisIndex": "all"}]
            ),
            datazoom_opts=[
                opts.DataZoomOpts(
                    is_show=True,
                    is_realtime=True,
                    start_value=30,
                    end_value=70,
                    xaxis_index=[0, 1],
                )
            ],
            xaxis_opts=opts.AxisOpts(
                type_="category",
                boundary_gap=False,
                axisline_opts=opts.AxisLineOpts(is_on_zero=True, linestyle_opts=opts.LineStyleOpts(color='#FFF')),
                axislabel_opts=opts.LabelOpts(color='#FFF')
            ),
            yaxis_opts=opts.AxisOpts(name="幅度", axislabel_opts=opts.LabelOpts(color='#FFF'),
                                     axisline_opts=opts.AxisLineOpts(linestyle_opts=opts.LineStyleOpts(color='#fff'))),
            legend_opts=opts.LegendOpts(pos_left="center", pos_top='6%', orient='horizontal', is_show=True,
                                        textstyle_opts=opts.TextStyleOpts(color='#ffffff')),
            toolbox_opts=opts.ToolboxOpts(
                is_show=True,
                feature={
                    "dataZoom": {"yAxisIndex": "none"},
                    "restore": {},
                    "saveAsImage": {},
                },
            ),
        )
    )

    l2 = (
        Line()
            .add_xaxis(xaxis_data=data['日期'].dt.strftime('%Y-%m-%d').tolist())
            .add_yaxis(
            series_name="涨跌额",
            y_axis=data['涨跌额'].tolist(),
            xaxis_index=1,
            yaxis_index=1,
            symbol_size=8,
            is_hover_animation=False,
            label_opts=opts.LabelOpts(is_show=True, color="#6E9EF1", position='bottom'),
            linestyle_opts=opts.LineStyleOpts(width=1.5, color="#6E9EF1"),
            is_smooth=True,
            areastyle_opts=opts.AreaStyleOpts(color=JsCode(area_color_js), opacity=1),
        )
            .set_global_opts(
            axispointer_opts=opts.AxisPointerOpts(
                is_show=True, link=[{"xAxisIndex": "all"}]
            ),
            tooltip_opts=opts.TooltipOpts(trigger="axis"),
            xaxis_opts=opts.AxisOpts(
                grid_index=1,
                type_="category",
                boundary_gap=False,
                axisline_opts=opts.AxisLineOpts(is_on_zero=True, linestyle_opts=opts.LineStyleOpts(color='#FFF')),
                position="top",
                axislabel_opts=opts.LabelOpts(color='#FFF'),
            ),
            datazoom_opts=[
                opts.DataZoomOpts(
                    is_realtime=True,
                    type_="inside",
                    start_value=30,
                    end_value=70,
                    xaxis_index=[0, 1],
                )
            ],
            yaxis_opts=opts.AxisOpts(is_inverse=True, name="额度", axislabel_opts=opts.LabelOpts(color='#FFF'),
                                     axisline_opts=opts.AxisLineOpts(linestyle_opts=opts.LineStyleOpts(color='#fff'))),
            legend_opts=opts.LegendOpts(pos_left="center", pos_top='9%',
                                        textstyle_opts=opts.TextStyleOpts(color='#ffffff')),
        )
    )
    c = (
        Grid(init_opts=opts.InitOpts(width="540px", height="710px", bg_color='#0256B6'))
            .add(chart=l1, grid_opts=opts.GridOpts(pos_left=50, pos_right=50, height="35%"))
            .add(
            chart=l2,
            grid_opts=opts.GridOpts(pos_left=50, pos_right=50, pos_top="55%", height="35%")

        )
    )
    # return HttpResponse(c.render_embed())
    return c


def pie_1(request):
    # 转换日期列为日期时间格式并排序
    data['日期'] = pd.to_datetime(data['日期'])
    data.sort_values(by='日期', inplace=True)

    # 将日期列转换为年月格式
    data['年月'] = data['日期'].dt.to_period('M').astype(str)

    # 将成交量列除以10000
    data['成交量'] = round(data['成交量'] / 10000, 2)

    # 按年月分组,并计算平均成交量
    grouped_data = data.groupby('年月', as_index=False).agg({'成交量': 'mean'})

    tl = Timeline(init_opts=opts.InitOpts(width='450px', height='710px', bg_color='#0256B6'))
    for year in range(2023, 2025):
        # 获取当前年份的数据
        current_year_data = grouped_data[grouped_data['年月'].str.startswith(str(year))]

        pie = (
            Pie(init_opts=opts.InitOpts(bg_color='#0256B6'))
                .add(
                "商家A",
                [list(z) for z in zip(current_year_data['年月'], current_year_data['成交量'].round(2))],
                rosetype="radius",
                radius=["30%", "55%"],
            )
                .set_global_opts(title_opts=opts.TitleOpts(title="{}年成交量(万)".format(year),
                                                           title_textstyle_opts=opts.TextStyleOpts(color='#FFF'),
                                                           pos_top='top', pos_right='center'),
                                 legend_opts=opts.LegendOpts(pos_top='10%',
                                                             textstyle_opts=opts.TextStyleOpts(color='#FFF')))
        )
        pie.set_colors(
            ["#91CC75", "#EE6666", "#EEC85B", "#64B5CD", "#FF69B4", "#BA55D3", "#CD5C5C", "#FFA500",
             "#40E0D0"])
        tl.add_schema(
            play_interval=1500,  # 表示播放的速度(跳动的间隔),单位毫秒(ms)
            is_auto_play=True,  # 设置自动播放
            # is_timeline_show=False,  # 不展示时间组件的轴
            pos_bottom='5%',
            is_loop_play=True,  # 是否循环播放
            width='300px',
            pos_left='center',
            label_opts=opts.LabelOpts(color='#FFF'),
        )
        tl.add(pie, "{}年".format(year))

    return tl


def heatmap_1(request):
    # 转换日期列为日期时间格式并排序
    data['日期'] = pd.to_datetime(data['日期'])
    data.sort_values(by='日期', inplace=True)
    # 创建年月列
    data['年月'] = data['日期'].dt.to_period('M').astype(str)  # 这将把日期转换为年月格式,例如 2024-03
    # 按年月分组
    grouped_data = data.groupby('年月')

    # 计算每个月的平均交易量(除以1000000以便缩小范围)
    avg = round(grouped_data['成交额'].mean() / 10000000, 2)
    value = [[i, j, avg[i]] for i in range(len(grouped_data['年月'])) for j in range(1)]
    # 创建热力图
    heatmap = (
        HeatMap(init_opts=opts.InitOpts(height='200px', width='300px', bg_color='#0256B6'))
            .add_xaxis(avg.index.tolist())
            .add_yaxis("", [''], value,
                       label_opts=opts.LabelOpts(is_show=True, color='#FFF', position='inside', font_size=10))
            .set_global_opts(
            visualmap_opts=opts.VisualMapOpts(
                min_=min(avg.values.tolist()),
                max_=max(avg.values.tolist()),
                range_text=["High", "Low"],
                textstyle_opts=opts.TextStyleOpts(color='#EDEDED'),
                orient="vertical",
                pos_left="left",
                item_height=280,
                item_width=10,
                pos_bottom='20px'
            ),
            xaxis_opts=opts.AxisOpts(axislabel_opts=opts.LabelOpts(color='#FFF'), is_show=False),
            yaxis_opts=opts.AxisOpts(axislabel_opts=opts.LabelOpts(color='#FFF'), is_show=False),

        )
    )
    return heatmap


def scatter_1(request):
    # 转换日期列为日期时间格式并排序
    data['日期'] = pd.to_datetime(data['日期'])
    data.sort_values(by='日期', inplace=True)
    # 创建年月列
    data['年月'] = data['日期'].dt.to_period('M').astype(str)  # 这将把日期转换为年月格式,例如 2024-03
    # 按年月分组并计算每月的最高和最低平均值
    grouped_data = data.groupby('年月', as_index=False).agg({'最高': 'mean', '最低': 'mean'})
    # 将平均值转换为万美元
    grouped_data['最高平均'] = round(grouped_data['最高'] / 1, 0)
    grouped_data['最低平均'] = round(grouped_data['最低'] / 1, 0)

    # 获取最低值和最高值
    min_value = grouped_data['最低平均'].min()

    s = (
        EffectScatter(init_opts=opts.InitOpts(width='430px'))
            .add_xaxis(grouped_data['年月'].tolist())
            .add_yaxis("最高平均", grouped_data['最高平均'].tolist(), symbol=SymbolType.ARROW)
            .add_yaxis("最低平均", grouped_data['最低平均'].tolist(), symbol=SymbolType.DIAMOND)
            .set_global_opts(
            title_opts=opts.TitleOpts(title="每月平均的最高开盘、最低开盘及成交额(百万)",
                                      title_textstyle_opts=opts.TextStyleOpts(color='#ededed')),
            # visualmap_opts=opts.VisualMapOpts(max_=2100, min_=1000, is_show=True),
            yaxis_opts=opts.AxisOpts(min_=1600, max_=min_value, axislabel_opts=opts.LabelOpts(interval=100),
                                     axisline_opts=opts.AxisLineOpts(linestyle_opts=opts.LineStyleOpts(color='#fff')),
                                     splitline_opts=opts.SplitLineOpts(is_show=True)),
            legend_opts=opts.LegendOpts(orient='vertical', pos_right='3%', legend_icon='pin', pos_top='5%',
                                        textstyle_opts=opts.TextStyleOpts(color='#ededed')),
            xaxis_opts=opts.AxisOpts(axisline_opts=opts.AxisLineOpts(linestyle_opts=opts.LineStyleOpts(color='#FFF'))),
        )
            .set_series_opts(label_opts=opts.LabelOpts(color='pink'))
    )
    c = (
        Grid(init_opts=opts.InitOpts(width="470px", height="710px", bg_color='#0256B6'))
            .add(chart=s, grid_opts=opts.GridOpts(pos_left=50, pos_right=50, height="35%"))
            .add(
            chart=heatmap_1(request),
            grid_opts=opts.GridOpts(pos_left=50, pos_right=50, pos_top="55%", height="35%")

        )
    )

    return c


def page(request):
    page2 = Page(layout=Page.SimplePageLayout)
    page2.add(
        line_1(request),
        pie_1(request),
        scatter_1(request),
    )
    return HttpResponse(page2.render_embed())
7.排版(将可视化图表的位置进行排版)
{% load static %}
<!DOCTYPE html>
<html lang="en">
<head>
    <meta charset="UTF-8">
    <title>Title</title>
    <style>
        #currentTime {
            position: fixed;
            bottom: 25px;
            left: 20px;
            color: white;
            font-size: 15px;
            z-index: 999;
        }

        body {
            overflow-y: hidden;
        }
    </style>
</head>
<body style="background-color: #0D325F">
<div style="display: flex; justify-content: space-between;">
    <span id="currentTime"></span>

    <div style="width:calc(25%); height: 900px; margin-top: 20px">
        <iframe src="{% url 'pic:line' %}" width="100%" height="72%" frameborder="0" scrolling="no"
                style="background-color: rgba(128, 128, 128, 0.2);"></iframe>
    </div>


    <div style="width:calc(50%); height: 900px; display: flex; flex-direction: column; justify-content: center; align-items: center;">
{#        <iframe src="{% url 'pic:' %}" width="100%" height="100%" frameborder="0" scrolling="no"></iframe>#}
        <iframe src="{% url 'pic:polar' %}" width="100%" height="100%" frameborder="0" scrolling="no"
                style="margin-left: 28%"
        ></iframe>
    </div>


    <div style="width:calc(25%); height: 800px; display: flex; justify-content: center; flex-direction: column; align-items: center;">
        <iframe src="{% url 'pic:heat' %}" width="100%" height="100%" frameborder="0" scrolling="no"
                style="background-color: rgba(128, 128, 128, 0);"></iframe>
        <iframe src="{% url 'pic:graph' %}" width="100%" height="100%" frameborder="0" scrolling="no"
                style=" background-color: rgba(128, 128, 128, 0); margin-top: 10%"></iframe>
    </div>

</div>


<script>
    function updateTime() {
        var now = new Date();
        var weekdays = ["日", "一", "二", "三", "四", "五", "六"]; // 中文星期
        var year = now.getFullYear();
        var month = now.getMonth() + 1; // getMonth() returns 0-based month
        var day = now.getDate();
        var dayOfWeek = weekdays[now.getDay()];
        var hours = now.getHours();
        var minutes = now.getMinutes();
        var seconds = now.getSeconds();

        // Add leading zero if the number is less than 10
        month = month < 10 ? '0' + month : month;
        day = day < 10 ? '0' + day : day;
        hours = hours < 10 ? '0' + hours : hours;
        minutes = minutes < 10 ? '0' + minutes : minutes;
        seconds = seconds < 10 ? '0' + seconds : seconds;

        var currentTimeString = year + '-' + month + '-' + day + ' 星期' + dayOfWeek + ' ' + hours + ':' + minutes + ':' + seconds;
        document.getElementById('currentTime').textContent = currentTimeString;
    }

    updateTime(); // Call the function initially to display time without delay

    // Update time every second
    setInterval(updateTime, 1000);
</script>

</body>
</html>