目录
- 前言
- 实用代码示例
- Interaction Example
- Item Demo
- Advanced Axes Demo
- Financial Chart Demo
- 结语
所有文章除特别声明外,均采用 CC BY-NC-SA 4.0 许可协议。转载请注明来自 nixgnauhcuy’s blog!
如需转载,请标明出处!
完整代码我已经上传到 Github 上了,可前往 https://github.com/nixgnauhcuy/QCustomPlot_Pyqt_Study 获取。
完整文章路径:
- Pyqt QCustomPlot 简介、安装与实用代码示例(一) | nixgnauhcuy
- Pyqt QCustomPlot 简介、安装与实用代码示例(二) | nixgnauhcuy
- Pyqt QCustomPlot 简介、安装与实用代码示例(三) | nixgnauhcuy
- Pyqt QCustomPlot 简介、安装与实用代码示例(四) | nixgnauhcuy
前言
继上文,继续补充官方示例 demo 实现~
实用代码示例
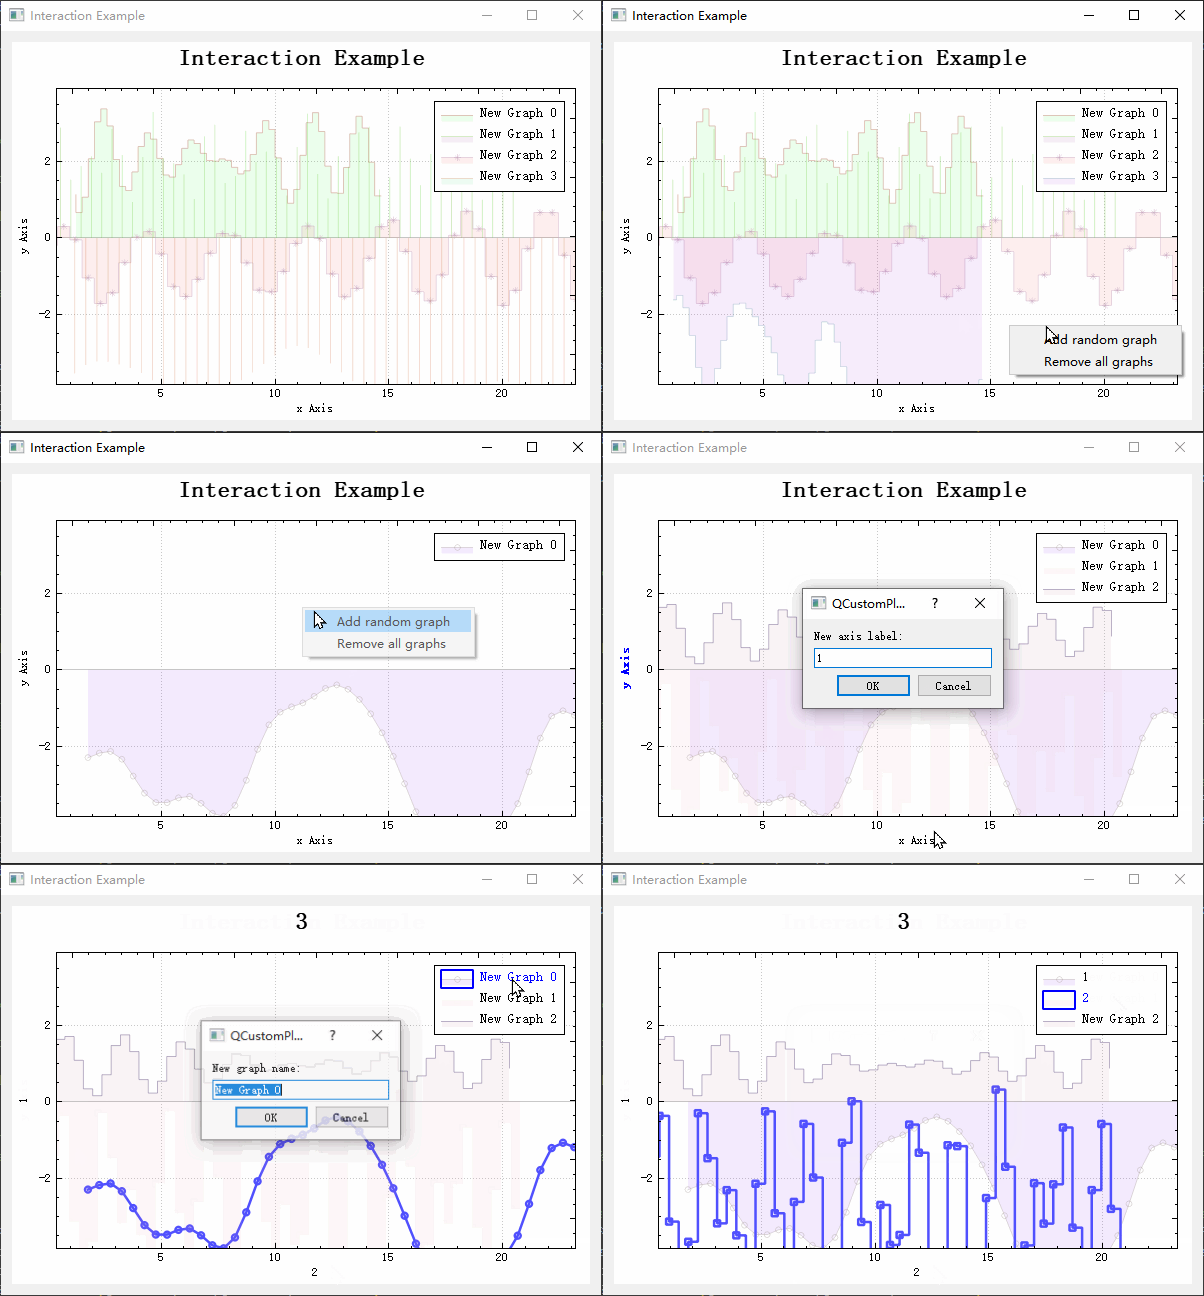
Interaction Example
The interaction example showing the user selection of graphs
import sys, math, random

from PyQt5.QtWidgets import QApplication, QGridLayout, QWidget, QMenu, QLineEdit, QInputDialog
from PyQt5.QtGui import QPen, QFont, QColor
from PyQt5.QtCore import Qt
from QCustomPlot_PyQt5 import QCustomPlot, QCP, QCPScatterStyle, QCPGraph, QCPAxis
from QCustomPlot_PyQt5 import QCPTextElement, QCPLegend, QCPDataSelection
class MainForm(QWidget):

    def __init__(self) -> None:
        super().__init__()

        self.setWindowTitle("Interaction Example")
        self.resize(600,400)

        self.mousePos = 0
        self.customPlot = QCustomPlot(self)
        self.gridLayout = QGridLayout(self).addWidget(self.customPlot)

        self.customPlot.setInteractions(QCP.Interactions(QCP.iRangeDrag | QCP.iRangeZoom | QCP.iSelectAxes | QCP.iSelectLegend | QCP.iSelectPlottables))
        self.customPlot.xAxis.setRange(-8, 8)
        self.customPlot.yAxis.setRange(-5, 5)
        self.customPlot.axisRect().setupFullAxesBox()

        self.customPlot.plotLayout().insertRow(0)
        self.title = QCPTextElement(self.customPlot, "Interaction Example", QFont("sans", 17, QFont.Bold))
        self.customPlot.plotLayout().addElement(0, 0, self.title)

        self.customPlot.xAxis.setLabel("x Axis")
        self.customPlot.yAxis.setLabel("y Axis")
        self.customPlot.legend.setVisible(True)
        legendFont = QFont()
        legendFont.setPointSize(10)
        self.customPlot.legend.setFont(legendFont)
        self.customPlot.legend.setSelectedFont(legendFont)
        self.customPlot.legend.setSelectableParts(QCPLegend.spItems) # legend box shall not be selectable, only legend items

        self.addRandomGraph()
        self.addRandomGraph()
        self.addRandomGraph()
        self.addRandomGraph()
        self.customPlot.rescaleAxes()

        # connect slot that ties some axis selections together (especially opposite axes):
        self.customPlot.selectionChangedByUser.connect(self.selectionChanged)
        # connect slots that takes care that when an axis is selected, only that direction can be dragged and zoomed:
        self.customPlot.mousePress.connect(self.mousePressCb)
        self.customPlot.mouseWheel.connect(self.mouseWheelCb)

        # make bottom and left axes transfer their ranges to top and right axes:
        self.customPlot.xAxis.rangeChanged.connect(lambda: self.customPlot.xAxis2.setRange(self.customPlot.xAxis2.range()))
        self.customPlot.yAxis.rangeChanged.connect(lambda: self.customPlot.yAxis2.setRange(self.customPlot.yAxis2.range()))

        # connect some interaction slots:
        self.customPlot.axisDoubleClick.connect(self.axisLabelDoubleClick)
        self.customPlot.legendDoubleClick.connect(self.legendDoubleClick)
        self.title.doubleClicked.connect(self.titleDoubleClick)

        # connect slot that shows a message in the status bar when a graph is clicked:
        self.customPlot.plottableClick.connect(self.graphClicked)

        # setup policy and connect slot for context menu popup:
        self.customPlot.setContextMenuPolicy(Qt.CustomContextMenu)
        self.customPlot.customContextMenuRequested.connect(self.contextMenuRequest)

    def addRandomGraph(self):
        n = 50 # number of points in graph
        xScale = (random.random() + 0.5)*2
        yScale = (random.random() + 0.5)*2
        xOffset = (random.random() - 0.5)*4
        yOffset = (random.random() - 0.5)*10
        r1 = (random.random() - 0.5)*2
        r2 = (random.random() - 0.5)*2
        r3 = (random.random() - 0.5)*2
        r4 = (random.random() - 0.5)*2
        x = [i/(n-0.5)*10.0*xScale + xOffset for i in range(n)]
        y = [(math.sin(x[i]*r1*5)*math.sin(math.cos(x[i]*r2)*r4*3)+r3*math.cos(math.sin(x[i])*r4*2))*yScale + yOffset for i in range(n)]
        self.customPlot.addGraph()
        self.customPlot.graph().setName(f"New Graph {self.customPlot.graphCount()-1}")
        self.customPlot.graph().setData(x, y)

        self.customPlot.graph().setLineStyle((QCPGraph.LineStyle)(math.floor(random.random()*5)+1))
        if (math.floor(random.random()*100) > 50):
            self.customPlot.graph().setScatterStyle(QCPScatterStyle((QCPScatterStyle.ScatterShape)(math.floor(random.random()*14)+1)))

        graphPen = QPen()
        graphPen.setColor(QColor(math.floor(random.random()*245+10), math.floor(random.random()*245+10), math.floor(random.random()*245+10)))
        graphPen.setWidthF(random.random()/(random.random()*2+1))
        self.customPlot.graph().setPen(graphPen)
        self.customPlot.graph().setBrush(QColor(int(random.random()*255), int(random.random()*255), int(random.random()*255), 20))
        self.customPlot.replot()


    def selectionChanged(self):
        # normally, axis base line, axis tick labels and axis labels are selectable separately, but we want
        # the user only to be able to select the axis as a whole, so we tie the selected states of the tick labels
        # and the axis base line together. However, the axis label shall be selectable individually.

        # The selection state of the left and right axes shall be synchronized as well as the state of the
        # bottom and top axes.

        # Further, we want to synchronize the selection of the graphs with the selection state of the respective
        # legend item belonging to that graph. So the user can select a graph by either clicking on the graph itself
        # or on its legend item.

        # make top and bottom axes be selected synchronously, and handle axis and tick labels as one selectable object:
        if (self.customPlot.xAxis.getPartAt(self.mousePos) == QCPAxis.spAxis or self.customPlot.xAxis.getPartAt(self.mousePos) == QCPAxis.spTickLabels or
            self.customPlot.xAxis2.getPartAt(self.mousePos) == QCPAxis.spAxis or self.customPlot.xAxis2.getPartAt(self.mousePos) == QCPAxis.spTickLabels):
            self.customPlot.xAxis2.setSelectedParts(QCPAxis.spAxis|QCPAxis.spTickLabels)
            self.customPlot.xAxis.setSelectedParts(QCPAxis.spAxis|QCPAxis.spTickLabels)

        # make left and right axes be selected synchronously, and handle axis and tick labels as one selectable object:
        if (self.customPlot.yAxis.getPartAt(self.mousePos) == QCPAxis.spAxis or self.customPlot.yAxis.getPartAt(self.mousePos) == QCPAxis.spTickLabels or
            self.customPlot.yAxis2.getPartAt(self.mousePos) == QCPAxis.spAxis or self.customPlot.yAxis2.getPartAt(self.mousePos) == QCPAxis.spTickLabels):
            self.customPlot.yAxis2.setSelectedParts(QCPAxis.spAxis|QCPAxis.spTickLabels)
            self.customPlot.yAxis.setSelectedParts(QCPAxis.spAxis|QCPAxis.spTickLabels)

        # synchronize selection of graphs with selection of corresponding legend items:
        for i in range(self.customPlot.graphCount()):
            graph = self.customPlot.graph(i)
            item = self.customPlot.legend.itemWithPlottable(graph)
            if (item.selected() or graph.selected()):
                item.setSelected(True)
                graph.setSelection(QCPDataSelection(graph.data().dataRange()))

    def mousePressCb(self, event):
        # if an axis is selected, only allow the direction of that axis to be dragged
        # if no axis is selected, both directions may be dragged

        self.mousePos = event.pos()

        if self.customPlot.xAxis.getPartAt(event.pos()) == QCPAxis.spAxis:
            self.customPlot.axisRect().setRangeDrag(self.customPlot.xAxis.orientation())
        elif self.customPlot.yAxis.getPartAt(event.pos()) == QCPAxis.spAxis:
            self.customPlot.axisRect().setRangeDrag(self.customPlot.yAxis.orientation())
        else:
            self.customPlot.axisRect().setRangeDrag(Qt.Horizontal|Qt.Vertical)

    def mouseWheelCb(self, event):
        # if an axis is selected, only allow the direction of that axis to be zoomed
        # if no axis is selected, both directions may be zoomed

        if self.customPlot.xAxis.getPartAt(event.pos())  == QCPAxis.spAxis:
            self.customPlot.axisRect().setRangeZoom(self.customPlot.xAxis.orientation())
        elif self.customPlot.yAxis.getPartAt(event.pos())  == QCPAxis.spAxis:
            self.customPlot.axisRect().setRangeZoom(self.customPlot.yAxis.orientation())
        else:
            self.customPlot.axisRect().setRangeZoom(Qt.Horizontal|Qt.Vertical)


    def removeSelectedGraph(self):
        if len(self.customPlot.selectedGraphs()) > 0:
            self.customPlot.removeGraph(self.customPlot.selectedGraphs()[0])
            self.customPlot.replot()

    def removeAllGraphs(self):
        self.customPlot.clearGraphs()
        self.customPlot.replot()

    def moveLegend(self, alignment):
        self.customPlot.axisRect().insetLayout().setInsetAlignment(0, alignment)
        self.customPlot.replot()


    def contextMenuRequest(self, pos):
        menu = QMenu(self)
        menu.setAttribute(Qt.WA_DeleteOnClose)
        if self.customPlot.legend.selectTest(pos, False) >= 0: # context menu on legend requested
            menu.addAction("Move to top left", lambda: self.moveLegend(Qt.AlignTop|Qt.AlignLeft))
            menu.addAction("Move to top center", lambda: self.moveLegend(Qt.AlignTop|Qt.AlignHCenter))
            menu.addAction("Move to top right", lambda: self.moveLegend(Qt.AlignTop|Qt.AlignRight))
            menu.addAction("Move to bottom right", lambda: self.moveLegend(Qt.AlignBottom|Qt.AlignRight))
            menu.addAction("Move to bottom left", lambda: self.moveLegend(Qt.AlignBottom|Qt.AlignLeft))
        else: # general context menu on graphs requested
            menu.addAction("Add random graph", self.addRandomGraph)
            if len(self.customPlot.selectedGraphs()) > 0:
                menu.addAction("Remove selected graph", self.removeSelectedGraph)
            if self.customPlot.graphCount() > 0:
                menu.addAction("Remove all graphs", self.removeAllGraphs)
        menu.popup(self.customPlot.mapToGlobal(pos))

    def axisLabelDoubleClick(self, axis, part):
        # Set an axis label by double clicking on it
        if part == QCPAxis.spAxisLabel: # only react when the actual axis label is clicked, not tick label or axis backbone
            newLabel, ok = QInputDialog.getText(self, "QCustomPlot example", "New axis label:", QLineEdit.Normal, axis.label())
            if ok:
                axis.setLabel(newLabel)
                self.customPlot.replot()

    def legendDoubleClick(self, legend, item):
        # Rename a graph by double clicking on its legend item
        if item: # only react if item was clicked (user could have clicked on border padding of legend where there is no item, then item is 0)
            plItem = item.plottable()
            newName, ok = QInputDialog.getText(self, "QCustomPlot example", "New graph name:", QLineEdit.Normal, plItem.name())
            if ok:
                plItem.setName(newName)
                self.customPlot.replot()

    def titleDoubleClick(self, event):
        # Set the plot title by double clicking on it
        newTitle, ok = QInputDialog.getText(self, "QCustomPlot example", "New plot title:", QLineEdit.Normal, self.title.text())
        if ok:
            self.title.setText(newTitle)
            self.customPlot.replot()

    def graphClicked(self, plottable, dataIndex):
        # since we know we only have QCPGraphs in the plot, we can immediately access interface1D()
        # usually it's better to first check whether interface1D() returns non-zero, and only then use it.
        dataValue = plottable.interface1D().dataMainValue(dataIndex)
        message = f"Clicked on graph '{plottable.name()}' at data point #{dataIndex} with value {dataValue}."
        print(message)


if __name__ == '__main__':
    app = QApplication(sys.argv)
    mainForm = MainForm()
    mainForm.show()
    sys.exit(app.exec())
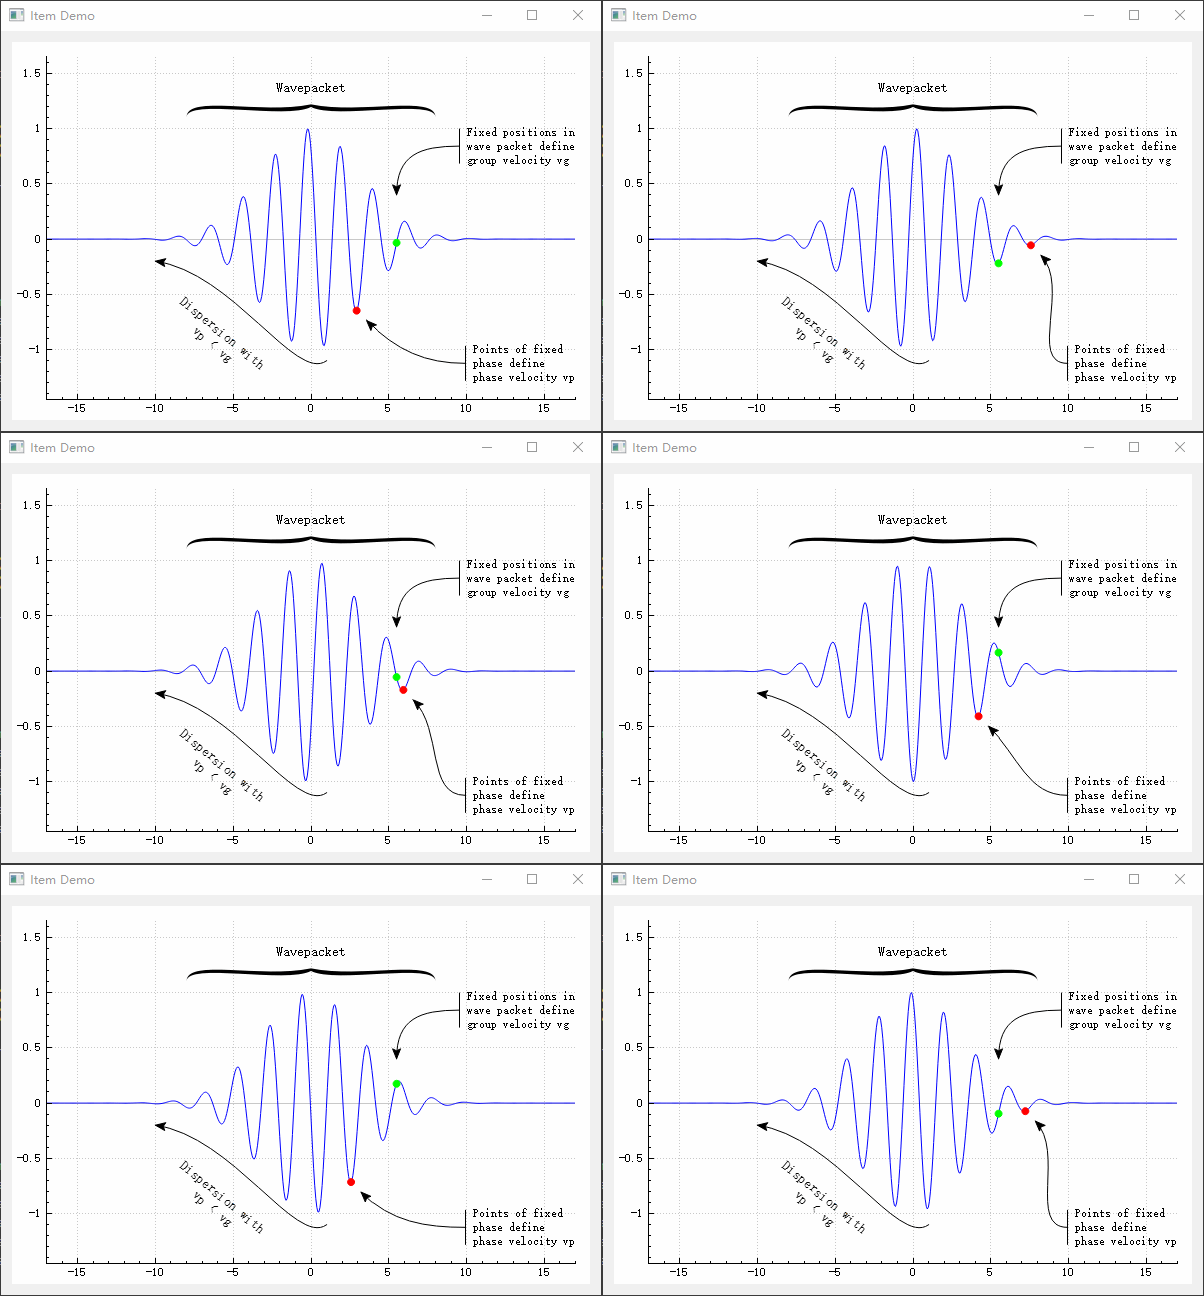
Item Demo
Using items like text labels, arrows and a bracket. This is actually animated, see examples project
import sys, math

from PyQt5.QtWidgets import QApplication, QGridLayout, QWidget
from PyQt5.QtGui import QPen, QFont
from PyQt5.QtCore import Qt, QMargins, QTimer, QTime
from QCustomPlot_PyQt5 import QCustomPlot, QCP, QCPItemTracer, QCPItemPosition
from QCustomPlot_PyQt5 import QCPItemBracket, QCPItemText, QCPItemCurve, QCPLineEnding
class MainForm(QWidget):

    def __init__(self) -> None:
        super().__init__()

        self.setWindowTitle("Item Demo")
        self.resize(600,400)

        self.customPlot = QCustomPlot(self)
        self.gridLayout = QGridLayout(self).addWidget(self.customPlot)

        self.customPlot.setInteractions(QCP.Interactions(QCP.iRangeDrag | QCP.iRangeZoom))
        self.customPlot.addGraph()
        n = 500
        phase = 0
        k = 3
        x = [i/(n-1)*34 - 17 for i in range(n)]
        y = [math.exp(-x[i]**2/20.0)*math.sin(k*x[i]+phase) for i in range(n)]
        self.customPlot.graph(0).setData(x, y)
        self.customPlot.graph(0).setPen(QPen(Qt.blue))
        self.customPlot.graph(0).rescaleKeyAxis()
        self.customPlot.yAxis.setRange(-1.45, 1.65)
        self.customPlot.xAxis.grid().setZeroLinePen(QPen(Qt.PenStyle.NoPen))

        # add the bracket at the top:
        self.bracket = QCPItemBracket(self.customPlot)
        self.bracket.left.setCoords(-8, 1.1)
        self.bracket.right.setCoords(8, 1.1)
        self.bracket.setLength(13)

        # add the text label at the top:
        self.wavePacketText = QCPItemText(self.customPlot)
        self.wavePacketText.position.setParentAnchor(self.bracket.center)
        self.wavePacketText.position.setCoords(0, -10) # move 10 pixels to the top from bracket center anchor
        self.wavePacketText.setPositionAlignment(Qt.AlignBottom|Qt.AlignHCenter)
        self.wavePacketText.setText("Wavepacket")
        self.wavePacketText.setFont(QFont(self.font().family(), 10))

        # add the phase tracer (red circle) which sticks to the graph data (and gets updated in bracketDataSlot by timer event):
        self.phaseTracer = QCPItemTracer(self.customPlot)
        self.itemDemoPhaseTracer = self.phaseTracer # so we can access it later in the bracketDataSlot for animation
        self.phaseTracer.setGraph(self.customPlot.graph(0))
        self.phaseTracer.setGraphKey((math.pi*1.5-phase)/k)
        self.phaseTracer.setInterpolating(True)
        self.phaseTracer.setStyle(QCPItemTracer.tsCircle)
        self.phaseTracer.setPen(QPen(Qt.red))
        self.phaseTracer.setBrush(Qt.red)
        self.phaseTracer.setSize(7)

        # add label for phase tracer:
        self.phaseTracerText = QCPItemText(self.customPlot)
        self.phaseTracerText.position.setType(QCPItemPosition.ptAxisRectRatio)
        self.phaseTracerText.setPositionAlignment(Qt.AlignRight|Qt.AlignBottom)
        self.phaseTracerText.position.setCoords(1.0, 0.95) # lower right corner of axis rect
        self.phaseTracerText.setText("Points of fixed\nphase define\nphase velocity vp")
        self.phaseTracerText.setTextAlignment(Qt.AlignLeft)
        self.phaseTracerText.setFont(QFont(self.font().family(), 9))
        self.phaseTracerText.setPadding(QMargins(8, 0, 0, 0))

        # add arrow pointing at phase tracer, coming from label:
        self.phaseTracerArrow = QCPItemCurve(self.customPlot)
        self.phaseTracerArrow.start.setParentAnchor(self.phaseTracerText.left)
        self.phaseTracerArrow.startDir.setParentAnchor(self.phaseTracerArrow.start)
        self.phaseTracerArrow.startDir.setCoords(-40, 0) # direction 30 pixels to the left of parent anchor (tracerArrow->start)
        self.phaseTracerArrow.end.setParentAnchor(self.phaseTracer.position)
        self.phaseTracerArrow.end.setCoords(10, 10)
        self.phaseTracerArrow.endDir.setParentAnchor(self.phaseTracerArrow.end)
        self.phaseTracerArrow.endDir.setCoords(30, 30)
        self.phaseTracerArrow.setHead(QCPLineEnding(QCPLineEnding.esSpikeArrow))
        self.phaseTracerArrow.setTail(QCPLineEnding(QCPLineEnding.esBar, (self.phaseTracerText.bottom.pixelPosition().y()-self.phaseTracerText.top.pixelPosition().y())*0.85))

        # add the group velocity tracer (green circle):
        self.groupTracer = QCPItemTracer(self.customPlot)
        self.groupTracer.setGraph(self.customPlot.graph(0))
        self.groupTracer.setGraphKey(5.5)
        self.groupTracer.setInterpolating(True)
        self.groupTracer.setStyle(QCPItemTracer.tsCircle)
        self.groupTracer.setPen(QPen(Qt.green))
        self.groupTracer.setBrush(Qt.green)
        self.groupTracer.setSize(7)

        # add label for group tracer:
        self.groupTracerText = QCPItemText(self.customPlot)
        self.groupTracerText.position.setType(QCPItemPosition.ptAxisRectRatio)
        self.groupTracerText.setPositionAlignment(Qt.AlignRight|Qt.AlignTop)
        self.groupTracerText.position.setCoords(1.0, 0.20) # lower right corner of axis rect
        self.groupTracerText.setText("Fixed positions in\nwave packet define\ngroup velocity vg")
        self.groupTracerText.setTextAlignment(Qt.AlignLeft)
        self.groupTracerText.setFont(QFont(self.font().family(), 9))
        self.groupTracerText.setPadding(QMargins(8, 0, 0, 0))

        # add arrow pointing at group tracer, coming from label:
        self.groupTracerArrow = QCPItemCurve(self.customPlot)
        self.groupTracerArrow.start.setParentAnchor(self.groupTracerText.left)
        self.groupTracerArrow.startDir.setParentAnchor(self.groupTracerArrow.start)
        self.groupTracerArrow.startDir.setCoords(-40, 0) # direction 30 pixels to the left of parent anchor (tracerArrow->start)
        self.groupTracerArrow.end.setCoords(5.5, 0.4)
        self.groupTracerArrow.endDir.setParentAnchor(self.groupTracerArrow.end)
        self.groupTracerArrow.endDir.setCoords(0, -40)
        self.groupTracerArrow.setHead(QCPLineEnding(QCPLineEnding.esSpikeArrow))
        self.groupTracerArrow.setTail(QCPLineEnding(QCPLineEnding.esBar, (self.groupTracerText.bottom.pixelPosition().y()-self.groupTracerText.top.pixelPosition().y())*0.85))

        # add dispersion arrow:
        self.arrow = QCPItemCurve(self.customPlot)
        self.arrow.start.setCoords(1, -1.1)
        self.arrow.startDir.setCoords(-1, -1.3)
        self.arrow.endDir.setCoords(-5, -0.3)
        self.arrow.end.setCoords(-10, -0.2)
        self.arrow.setHead(QCPLineEnding(QCPLineEnding.esSpikeArrow))

        # add the dispersion arrow label:
        self.dispersionText = QCPItemText(self.customPlot)
        self.dispersionText.position.setCoords(-6, -0.9)
        self.dispersionText.setRotation(40)
        self.dispersionText.setText("Dispersion with\nvp < vg")
        self.dispersionText.setFont(QFont(self.font().family(), 10))

        # setup a timer that repeatedly calls MainWindow::bracketDataSlot:
        self.curTime = QTime.currentTime()
        self.dataTimer = QTimer(self)
        self.dataTimer.timeout.connect(self.bracketDataSlot)
        self.dataTimer.start(0) # Interval 0 means to refresh as fast as possible

    def bracketDataSlot(self):
        key = self.curTime.msecsTo(QTime.currentTime())/1000.0

        # update data to make phase move:
        n = 500
        phase = key*5
        k = 3
        x = [i/(n-1)*34 - 17 for i in range(n)]
        y = [math.exp(-x[i]**2/20.0)*math.sin(k*x[i]+phase) for i in range(n)]
        self.customPlot.graph(0).setData(x, y)
        self.itemDemoPhaseTracer.setGraphKey((8*math.pi+math.fmod(math.pi*1.5-phase, 6*math.pi))/k)
        self.customPlot.replot()

if __name__ == '__main__':
    app = QApplication(sys.argv)
    mainForm = MainForm()
    mainForm.show()
    sys.exit(app.exec())
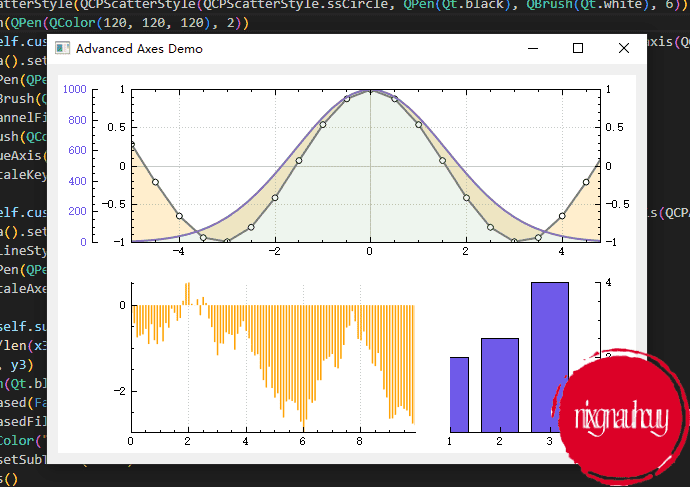
Advanced Axes Demo
QCP supports multiple axes on one axis rect side and multiple axis rects per plot widget
import sys, random, math

from PyQt5.QtWidgets import QApplication, QGridLayout, QWidget
from PyQt5.QtGui import QColor, QPen, QBrush
from PyQt5.QtCore import Qt
from QCustomPlot_PyQt5 import QCustomPlot, QCPLayoutGrid, QCP, QCPAxis, QCPScatterStyle, QCPBars, QCPGraph
from QCustomPlot_PyQt5 import QCPAxisRect, QCPMarginGroup, QCPGraphData, QCPAxisTickerFixed
class MainForm(QWidget):

    def __init__(self) -> None:
        super().__init__()

        self.setWindowTitle("Advanced Axes Demo")
        self.resize(600,400)

        self.customPlot = QCustomPlot(self)
        self.gridLayout = QGridLayout(self).addWidget(self.customPlot)

        # configure axis rect:
        self.customPlot.plotLayout().clear() # clear default axis rect so we can start from scratch
        self.wideAxisRect = QCPAxisRect(self.customPlot)
        self.wideAxisRect.setupFullAxesBox(True)
        self.wideAxisRect.axis(QCPAxis.atRight, 0).setTickLabels(True)
        self.wideAxisRect.addAxis(QCPAxis.atLeft).setTickLabelColor(QColor("#6050F8")) # add an extra axis on the left and color its numbers
        self.subLayout = QCPLayoutGrid()
        self.customPlot.plotLayout().addElement(0, 0, self.wideAxisRect) # insert axis rect in first row
        self.customPlot.plotLayout().addElement(1, 0, self.subLayout) # sub layout in second row (grid layout will grow accordingly)
        # customPlot->plotLayout()->setRowStretchFactor(1, 2);
        # prepare axis rects that will be placed in the sublayout:
        self.subRectLeft = QCPAxisRect(self.customPlot, False) # false means to not setup default axes
        self.subRectRight = QCPAxisRect(self.customPlot, False)
        self.subLayout.addElement(0, 0, self.subRectLeft)
        self.subLayout.addElement(0, 1, self.subRectRight)
        self.subRectRight.setMaximumSize(150, 150) # make bottom right axis rect size fixed 150x150
        self.subRectRight.setMinimumSize(150, 150) # make bottom right axis rect size fixed 150x150
        # setup axes in sub layout axis rects:
        self.subRectLeft.addAxes(QCPAxis.atBottom | QCPAxis.atLeft)
        self.subRectRight.addAxes(QCPAxis.atBottom | QCPAxis.atRight)
        self.subRectLeft.axis(QCPAxis.atLeft).ticker().setTickCount(2)
        self.subRectRight.axis(QCPAxis.atRight).ticker().setTickCount(2)
        self.subRectRight.axis(QCPAxis.atBottom).ticker().setTickCount(2)
        self.subRectLeft.axis(QCPAxis.atBottom).grid().setVisible(True)
        # synchronize the left and right margins of the top and bottom axis rects:
        self.marginGroup = QCPMarginGroup(self.customPlot)
        self.subRectLeft.setMarginGroup(QCP.msLeft, self.marginGroup)
        self.subRectRight.setMarginGroup(QCP.msRight, self.marginGroup)
        self.wideAxisRect.setMarginGroup(QCP.msLeft | QCP.msRight, self.marginGroup)
        # move newly created axes on "axes" layer and grids on "grid" layer:
        for rect in self.customPlot.axisRects():
            for axis in rect.axes():
                axis.setLayer("axes")
                axis.grid().setLayer("grid")

        # prepare data:
        dataCos = [QCPGraphData(i/20.0*10-5.0, math.cos(i/20.0*10-5.0)) for i in range(21)]
        dataGauss = [QCPGraphData(i/50*10-5.0, math.exp(-(i/50*10-5.0)*(i/50*10-5.0)*0.2)*1000) for i in range(50)]
        dataRandom = [QCPGraphData() for i in range(100)]
        for i in range(100):
            dataRandom[i].key = i/100*10
            dataRandom[i].value = random.random()-0.5+dataRandom[max(0, i-1)].value

        x3 = [1, 2, 3, 4]
        y3 = [2, 2.5, 4, 1.5]

        # create and configure plottables:
        self.mainGraphCos = self.customPlot.addGraph(self.wideAxisRect.axis(QCPAxis.atBottom), self.wideAxisRect.axis(QCPAxis.atLeft))
        self.mainGraphCos.data().set(dataCos)
        self.mainGraphCos.valueAxis().setRange(-1, 1)
        self.mainGraphCos.rescaleKeyAxis()
        self.mainGraphCos.setScatterStyle(QCPScatterStyle(QCPScatterStyle.ssCircle, QPen(Qt.black), QBrush(Qt.white), 6))
        self.mainGraphCos.setPen(QPen(QColor(120, 120, 120), 2))
        self.mainGraphGauss = self.customPlot.addGraph(self.wideAxisRect.axis(QCPAxis.atBottom), self.wideAxisRect.axis(QCPAxis.atLeft, 1))
        self.mainGraphGauss.data().set(dataGauss)
        self.mainGraphGauss.setPen(QPen(QColor("#8070B8"), 2))
        self.mainGraphGauss.setBrush(QColor(110, 170, 110, 30))
        self.mainGraphCos.setChannelFillGraph(self.mainGraphGauss)
        self.mainGraphCos.setBrush(QColor(255, 161, 0, 50))
        self.mainGraphGauss.valueAxis().setRange(0, 1000)
        self.mainGraphGauss.rescaleKeyAxis()

        self.subGraphRandom = self.customPlot.addGraph(self.subRectLeft.axis(QCPAxis.atBottom), self.subRectLeft.axis(QCPAxis.atLeft))
        self.subGraphRandom.data().set(dataRandom)
        self.subGraphRandom.setLineStyle(QCPGraph.lsImpulse)
        self.subGraphRandom.setPen(QPen(QColor("#FFA100"), 1.5))
        self.subGraphRandom.rescaleAxes()

        self.subBars = QCPBars(self.subRectRight.axis(QCPAxis.atBottom), self.subRectRight.axis(QCPAxis.atRight))
        self.subBars.setWidth(3/len(x3))
        self.subBars.setData(x3, y3)
        self.subBars.setPen(QPen(Qt.black))
        self.subBars.setAntialiased(False)
        self.subBars.setAntialiasedFill(False)
        self.subBars.setBrush(QColor("#705BE8"))
        self.subBars.keyAxis().setSubTicks(False)
        self.subBars.rescaleAxes()
        # setup a ticker for subBars key axis that only gives integer ticks:
        intTicker = QCPAxisTickerFixed()
        intTicker.setTickStep(1.0)
        intTicker.setScaleStrategy(QCPAxisTickerFixed.ssMultiples)
        self.subBars.keyAxis().setTicker(intTicker)

if __name__ == '__main__':
    app = QApplication(sys.argv)
    mainForm = MainForm()
    mainForm.show()
    sys.exit(app.exec())
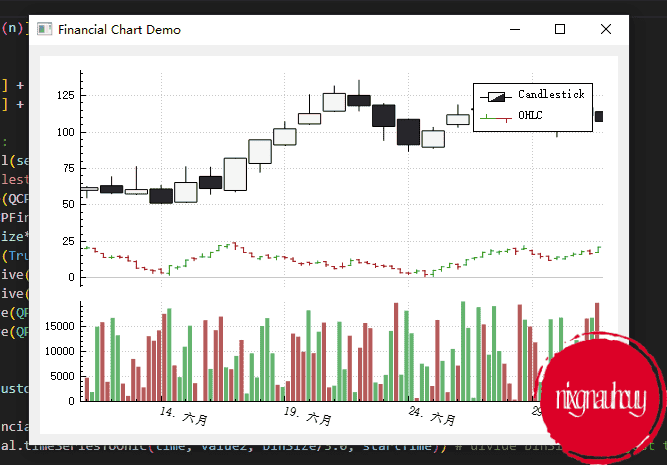
Financial Chart Demo
QCP showing financial and stock data with the typical Candlestick and OHLC charts
import sys, random

from PyQt5.QtWidgets import QApplication, QGridLayout, QWidget
from PyQt5.QtGui import QColor, QPen
from PyQt5.QtCore import Qt, QDateTime, QDate, QMargins
from QCustomPlot_PyQt5 import QCustomPlot, QCPFinancial, QCP, QCPAxis, QCPBars
from QCustomPlot_PyQt5 import QCPAxisRect, QCPMarginGroup, QCPAxisTickerDateTime
class MainForm(QWidget):

    def __init__(self) -> None:
        super().__init__()

        self.setWindowTitle("Financial Chart Demo")
        self.resize(600,400)

        self.customPlot = QCustomPlot(self)
        self.gridLayout = QGridLayout(self).addWidget(self.customPlot)

        self.customPlot.legend.setVisible(True)

        # generate two sets of random walk data (one for candlestick and one for ohlc chart):
        n = 500
        start = QDateTime(QDate(2014, 6, 11))
        start.setTimeSpec(Qt.UTC)
        startTime = start.toTime_t()
        binSize = 3600*24 # bin data in 1 day intervals
        time = [startTime + 3600*i for i in range(n)]
        value1 = [0 for i in range(n)]
        value1[0] = 60
        value2 = [0 for i in range(n)]
        value2[0] = 20
        for i in range(1, n):
            value1[i] = value1[i-1] + (random.random()-0.5)*10
            value2[i] = value2[i-1] + (random.random()-0.5)*3

        # create candlestick chart:
        candlesticks = QCPFinancial(self.customPlot.xAxis, self.customPlot.yAxis)
        candlesticks.setName("Candlestick")
        candlesticks.setChartStyle(QCPFinancial.csCandlestick)
        candlesticks.data().set(QCPFinancial.timeSeriesToOhlc(time, value1, binSize, startTime))
        candlesticks.setWidth(binSize*0.9)
        candlesticks.setTwoColored(True)
        candlesticks.setBrushPositive(QColor(245, 245, 245))
        candlesticks.setBrushNegative(QColor(40, 40, 40))
        candlesticks.setPenPositive(QPen(QColor(0, 0, 0)))
        candlesticks.setPenNegative(QPen(QColor(0, 0, 0)))

        # create ohlc chart:
        ohlc = QCPFinancial(self.customPlot.xAxis, self.customPlot.yAxis)
        ohlc.setName("OHLC")
        ohlc.setChartStyle(QCPFinancial.csOhlc)
        ohlc.data().set(QCPFinancial.timeSeriesToOhlc(time, value2, binSize/3.0, startTime)) # divide binSize by 3 just to make the ohlc bars a bit denser
        ohlc.setWidth(binSize*0.2)
        ohlc.setTwoColored(True)

        # create bottom axis rect for volume bar chart:
        volumeAxisRect = QCPAxisRect(self.customPlot)
        self.customPlot.plotLayout().addElement(1, 0, volumeAxisRect)
        volumeAxisRect.setMaximumSize(16777215, 100)
        volumeAxisRect.axis(QCPAxis.atBottom).setLayer("axes")
        volumeAxisRect.axis(QCPAxis.atBottom).grid().setLayer("grid")
        # bring bottom and main axis rect closer together:
        self.customPlot.plotLayout().setRowSpacing(0)
        volumeAxisRect.setAutoMargins(QCP.MarginSides(QCP.msLeft|QCP.msRight|QCP.msBottom))
        volumeAxisRect.setMargins(QMargins(0, 0, 0, 0))
        # create two bar plottables, for positive (green) and negative (red) volume bars:
        self.customPlot.setAutoAddPlottableToLegend(False)
        volumePos = QCPBars(volumeAxisRect.axis(QCPAxis.atBottom), volumeAxisRect.axis(QCPAxis.atLeft))
        volumeNeg = QCPBars(volumeAxisRect.axis(QCPAxis.atBottom), volumeAxisRect.axis(QCPAxis.atLeft))
        for i in range(n//5):
            v = random.randint(-20000, 20000)
            if v < 0:
                volumeNeg.addData(startTime+3600*5.0*i, abs(v))
            else:
                volumePos.addData(startTime+3600*5.0*i, abs(v))
        volumePos.setWidth(3600*4)
        volumePos.setPen(QPen(Qt.PenStyle.NoPen))
        volumePos.setBrush(QColor(100, 180, 110))
        volumeNeg.setWidth(3600*4)
        volumeNeg.setPen(QPen(Qt.PenStyle.NoPen))
        volumeNeg.setBrush(QColor(180, 90, 90))

        # interconnect x axis ranges of main and bottom axis rects:
        self.customPlot.xAxis.rangeChanged.connect(volumeAxisRect.axis(QCPAxis.atBottom).setRange)
        volumeAxisRect.axis(QCPAxis.atBottom).rangeChanged.connect(self.customPlot.xAxis.setRange)
        # configure axes of both main and bottom axis rect:
        dateTimeTicker = QCPAxisTickerDateTime()
        dateTimeTicker.setDateTimeSpec(Qt.UTC)
        dateTimeTicker.setDateTimeFormat("dd. MMMM")
        volumeAxisRect.axis(QCPAxis.atBottom).setTicker(dateTimeTicker)
        volumeAxisRect.axis(QCPAxis.atBottom).setTickLabelRotation(15)
        self.customPlot.xAxis.setBasePen(QPen(Qt.PenStyle.NoPen))
        self.customPlot.xAxis.setTickLabels(False)
        self.customPlot.xAxis.setTicks(False) # only want vertical grid in main axis rect, so hide xAxis backbone, ticks, and labels
        self.customPlot.xAxis.setTicker(dateTimeTicker)
        self.customPlot.rescaleAxes()
        self.customPlot.xAxis.scaleRange(1.025, self.customPlot.xAxis.range().center())
        self.customPlot.yAxis.scaleRange(1.1, self.customPlot.yAxis.range().center())

        # make axis rects' left side line up:
        group = QCPMarginGroup(self.customPlot)
        self.customPlot.axisRect().setMarginGroup(QCP.msLeft|QCP.msRight, group)
        volumeAxisRect.setMarginGroup(QCP.msLeft|QCP.msRight, group)

if __name__ == '__main__':
    app = QApplication(sys.argv)
    mainForm = MainForm()
    mainForm.show()
    sys.exit(app.exec())
结语
至此,官方 demo 已经全部实现了,后续看看有没有时间再更新些其他的。
