官网demo地址:
LineString Arrows
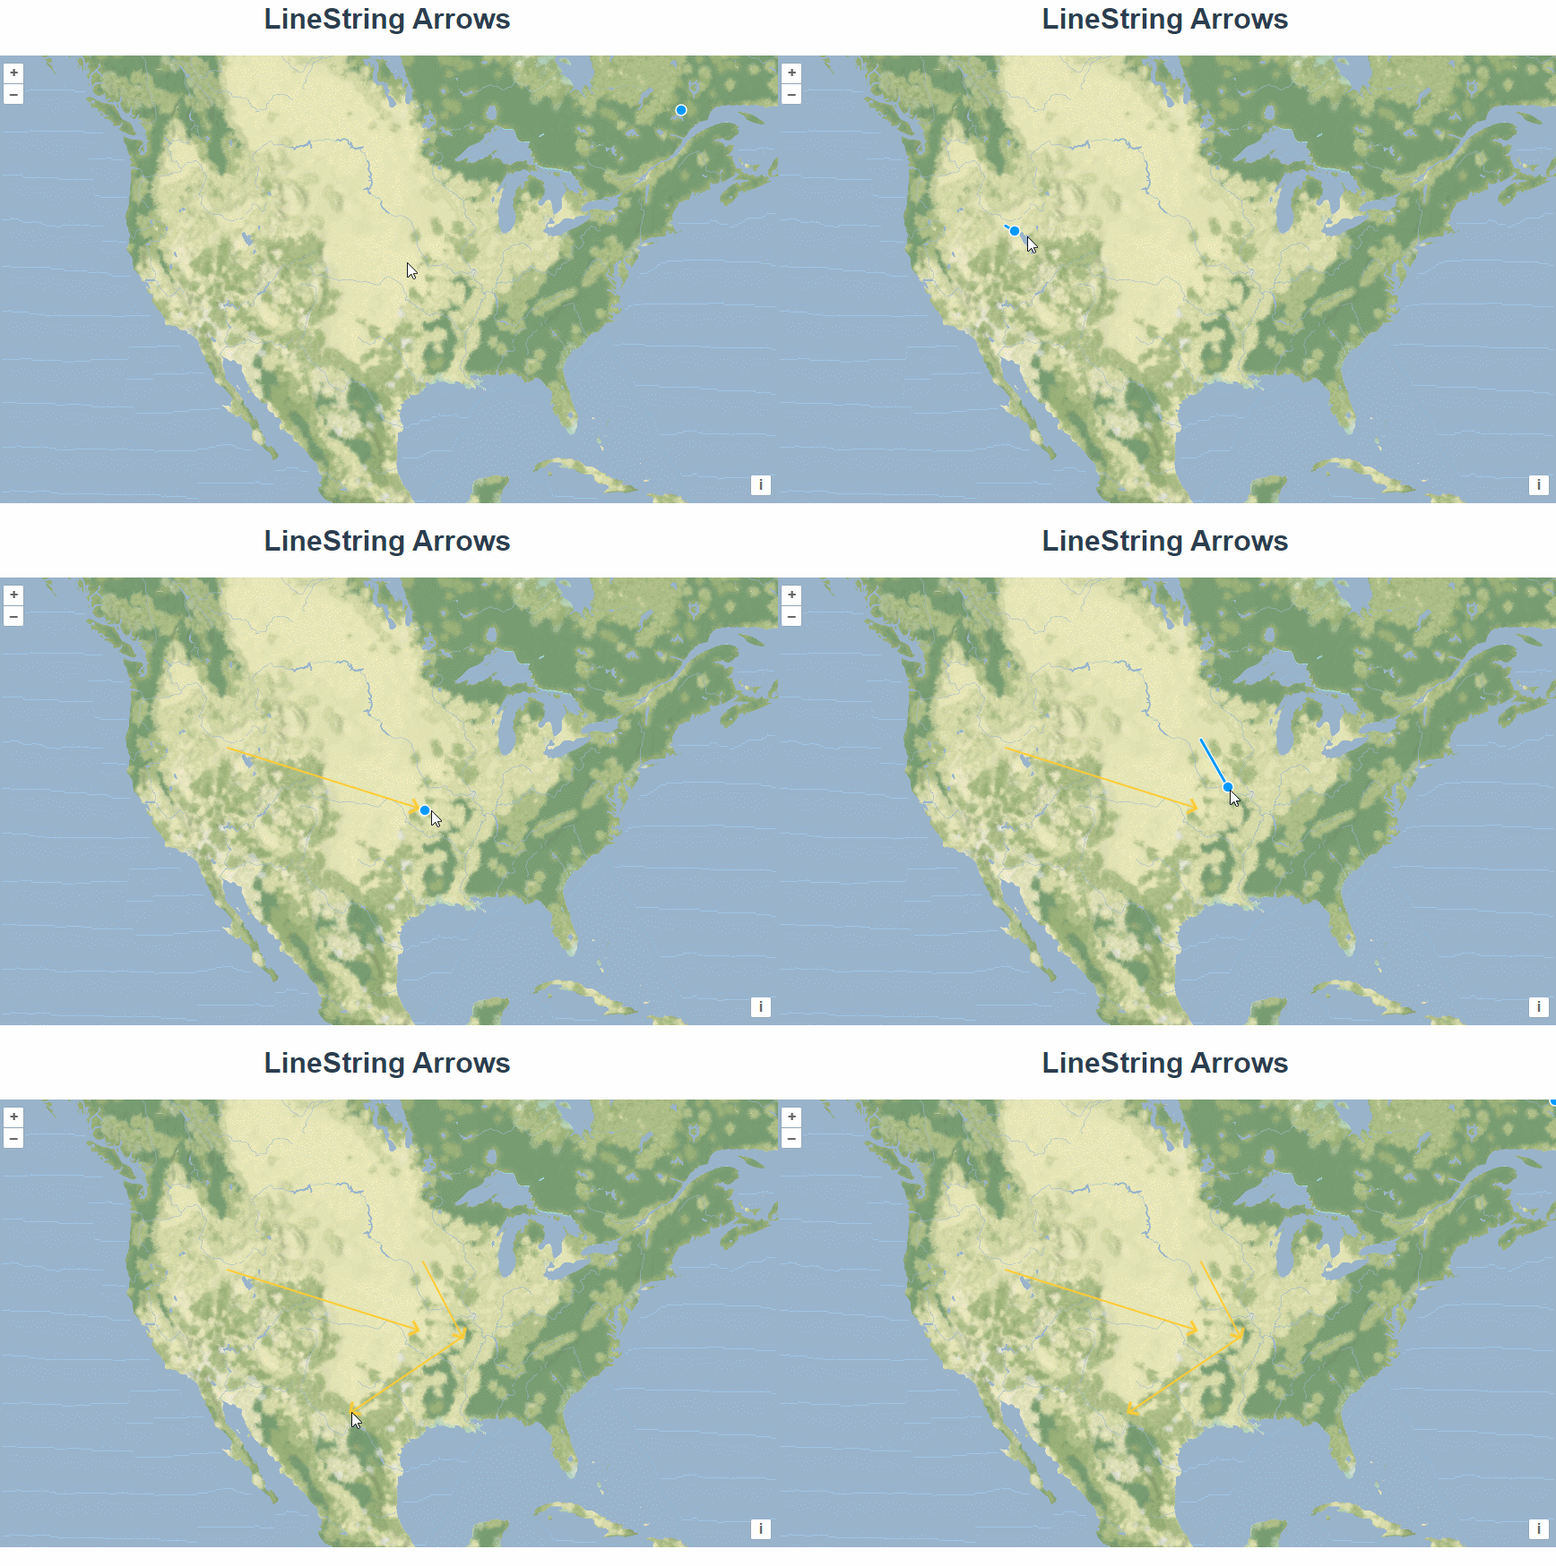
这篇介绍了在地图上绘制箭头。
创建一个矢量数据源,将其绑定为draw的数据源并展示在矢量图层上。
  const source = new VectorSource();
  const vector = new VectorLayer({
      source: source,
      style: styleFunction,
   });
   map.addInteraction(
      new Draw({
        source: source,
        type: "LineString",
      })
    );
绘制直线时,通过style函数将直线的末端添加箭头图标。通过forEachSegment 函数拿到箭头的起点和终点坐标,使用 Math.atan2计算出箭头图标的旋转角度。
const styleFunction = function (feature) {
      const geometry = feature.getGeometry();
      const styles = [
        new Style({
          stroke: new Stroke({
            color: "#ffcc33",
            width:2,
          }),
        }),
      ];

      geometry.forEachSegment(function (start, end) {
        const dx = end[0] - start[0];
        const dy = end[1] - start[1];
        const rotation = Math.atan2(dy, dx);
        styles.push(
          new Style({
            geometry: new Point(end),
            image: new Icon({
              src: "https://openlayers.org/en/latest/examples/data/arrow.png",
              anchor: [0.75, 0.5],
              rotateWithView: true,
              rotation: -rotation,
            }),
          })
        );
      });

      return styles;
    };
完整代码:
<template>
  <div class="box">
    <h1>LineString Arrows</h1>
    <div id="map" class="map"></div>
  </div>
</template>

<script>
import StadiaMaps from "ol/source/StadiaMaps.js";
import Draw from "ol/interaction/Draw.js";
import Map from "ol/Map.js";
import Point from "ol/geom/Point.js";
import View from "ol/View.js";
import { Icon, Stroke, Style } from "ol/style.js";
import { OSM, Vector as VectorSource } from "ol/source.js";
import { Tile as TileLayer, Vector as VectorLayer } from "ol/layer.js";
import { get } from "ol/proj.js";
export default {
  name: "",
  components: {},
  data() {
    return {
      map: null,
    };
  },
  computed: {},
  created() {},
  mounted() {
    const layer = new TileLayer({
      source: new StadiaMaps({
        layer: "stamen_terrain_background",
      }),
    });

    const source = new VectorSource();
    const styleFunction = function (feature) {
      const geometry = feature.getGeometry();
      const styles = [
        new Style({
          stroke: new Stroke({
            color: "#ffcc33",
            width:2,
          }),
        }),
      ];

      geometry.forEachSegment(function (start, end) {
        const dx = end[0] - start[0];
        const dy = end[1] - start[1];
        const rotation = Math.atan2(dy, dx);
        styles.push(
          new Style({
            geometry: new Point(end),
            image: new Icon({
              src: "https://openlayers.org/en/latest/examples/data/arrow.png",
              anchor: [0.75, 0.5],
              rotateWithView: true,
              rotation: -rotation,
            }),
          })
        );
      });

      return styles;
    };
    const vector = new VectorLayer({
      source: source,
      style: styleFunction,
    });


    const extent = get("EPSG:3857").getExtent().slice();
    extent[0] += extent[0];
    extent[2] += extent[2];

    const map = new Map({
      layers: [layer, vector],
      target: "map",
      view: new View({
        center: [-11000000, 4600000],
        zoom: 4,
        extent,
      }),
    });

    map.addInteraction(
      new Draw({
        source: source,
        type: "LineString",
      })
    );
  },
  methods: {},
};
</script>

<style lang="scss" scoped>
#map {
  width: 100%;
  height: 500px;
}
.box {
  height: 100%;
}

</style>


