目录
一、项目准备
二、(横向分页)柱状图
2.1、动态刷新
2.2、UI调整
2.3、分辨率适配
三、(竖向平移)柱状图
3.1、平移动画
3.2、不同数值显示不同颜色
四、(下拉切换)折线图
4.1、切换图表和分辨率适配
4.2、UI调整
五、(三级分类)饼图
5.1、数据切换
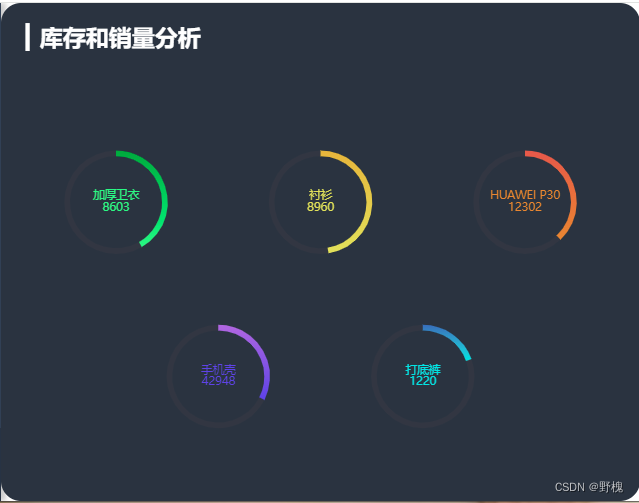
六、圆环饼图
6.1、切换动画
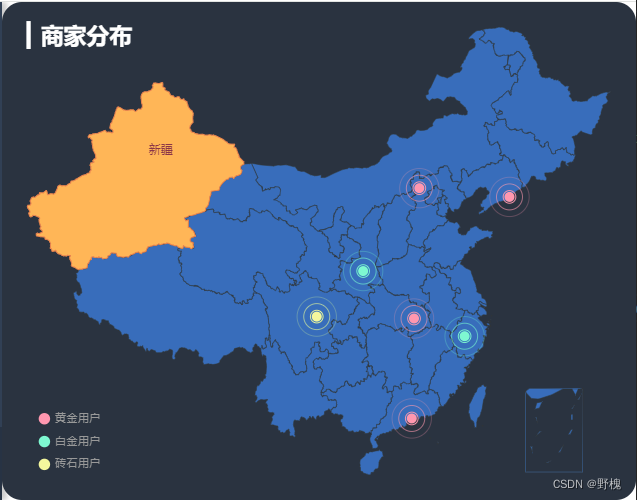
七、地图+散点图
7.1、地图上显示散点
7.2、点击出现单个省份,双击复原
一、项目准备
服务器数据获取链接:电商: 电商数据可视化配套素材
B站链接:57_前端项目_销量趋势图表_通用代码结构_哔哩哔哩_bilibili
下载下来的文件里面用‘第三天=>代码’项目启动:cmd进入文件夹下npm init -y,然后npm i koa(koa是基于node.js的另一个框架,和Express差不多),直接node app.js即可,终端没有响应就代表启动正常了,在浏览器上输入"http://127.0.0.1:8888/api/seller"可以看到数据.
vue2项目的main.js里:
import './assets/less/global.less';//引入全局的样式文件
import './assets/font/iconfont.css';//引入字体的样式文件
import axios from 'axios'
axios.defaults.baseURL = 'http://127.0.0.1:8888/api/';
Vue.prototype.$http = axios;
import echarts from "echarts";
Vue.prototype.$echarts = echarts;//挂载到原型,可以在全局使用
核心功能:屏幕适配【screenAdapter()】、全屏切换、实时监测【WebSocket】
二、(横向分页)柱状图
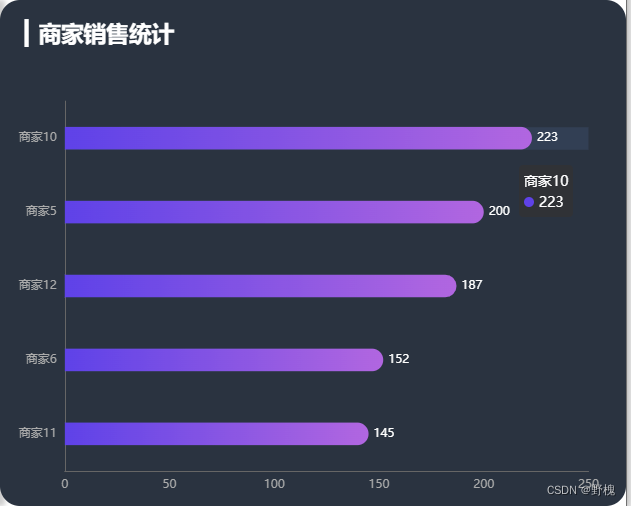
代码如下:
<template>
  <div class="com-container">
    <div class="com-chart" ref="seller_ref"></div>
  </div>
</template>
<script>
import * as ets from "echarts";
import chalk from "../../../../public/static/theme/chalk.json";//自己下载
export default {
  data() {
    return {
      chartInstance: null,
      allData: null,
      currentPage: 1,
      totalPage: 0, //一共多少页
      timeId: null, //定时器标识
    };
  },
  mounted() {
    this.initChart();
    this.getData();
    window.addEventListener("resize", this.screenAdapter);
    this.screenAdapter(); //得先主动适配屏幕
    //最原始的Option现在被拆分为initOption、dataOption、adapterOption三部分,各司其职
  },
  destroyed() {
    clearInterval(this.timeId);
    window.removeEventListener("resize", this.screenAdapter);
  },
  methods: {
    // 初始化echartsInstance对象
    initChart() {
      ets.registerTheme("chalk", chalk);
      this.chartInstance = ets.init(this.$refs.seller_ref, "chalk");//主题
      //   对图表初始化配置的控制
      const initOption = {
        //' ▎'这个标记在搜狗输入法上右键,里面的“符号大全”里有
        title: {
          text: "▎商家销售统计",
          left: 20,
          top: 20,
        },
        grid: {
          top: "20%",
          left: "3%",
          right: "6%",
          bottom: "3%",
          containLabel: true, //距离是包含坐标轴上的文字
        },
        xAxis: {
          type: "value",
        },
        yAxis: {
          type: "category",
        },
        tooltip: {
          //划过提示
          trigger: "axis",
          axisPointer: {
            type: "line",
            z: 0,
            lineStyle: {
              color: "#314055",
            },
          },
        },
        series: [
          {
            type: "bar",
            label: {
              show: true,
              position: "right",
              textStyle: {
                color: "white",
              },
            },
            itemStyle: {
            //   barBorderRadius: [0, 33, 33, 0],
              // 指明颜色渐变的方向和不同百分比之下颜色的值
              color: new this.$echarts.graphic.LinearGradient(0, 0, 1, 0, [
                {
                  offset: 0,
                  color: "#5052EE",
                },
                {
                  offset: 1,
                  color: "#AB6EE5",
                },
              ]),
            },
          },
        ],
      };
      this.chartInstance.setOption(initOption);
      //   鼠标移入图表中停止更新,移出则继续更新
      this.chartInstance.on("mouseover", () => {
        clearInterval(this.timeId);
      });
      this.chartInstance.on("mouseout", () => {
        this.startInterval();
      });
    },
    // 获取服务器数据
    async getData() {
      const { data: ret } = await this.$http.get("seller");//axios调接口
      this.allData = ret;
      this.allData.sort((a, b) => {
        return a.value - b.value; //从小到大进行排序
      });
      this.totalPage =
        this.allData.length % 5 == 0
          ? this.allData.length / 5
          : this.allData.length / 5 + 1; //5个元素一页
      this.updateChart();
      this.startInterval();
    },
    // 更新图表
    updateChart() {
      const start = (this.currentPage - 1) * 5;
      const end = this.currentPage * 5;
      const showData = this.allData.slice(start, end);
      const sellerNames = showData.map((item) => {
        return item.name;
      });
      const sellerValues = showData.map((item) => {
        return item.value;
      });
      const dataOption = {
        yAxis: {
          data: sellerNames,
        },
        series: [
          {
            data: sellerValues,
          },
        ],
      };
      this.chartInstance.setOption(dataOption);
    },
    // 动态刷新
    startInterval() {
      if (this.timeId) {
        clearInterval(this.timeId);
      }
      this.timeId = setInterval(() => {
        this.currentPage++;
        if (this.currentPage > this.totalPage) {
          //边界值判断
          this.currentPage = 1;
        }
        this.updateChart();
      }, 3000);
    },
    // 当浏览器大小发生变化时,会进行分辨率适配
    screenAdapter() {
      const titleFontSize = (this.$refs.seller_ref.offsetWidth / 100) * 3.6;
      const adapterOption = {
        title: {
          textStyle: {
            fontSize: titleFontSize,
          },
        },
        tooltip: {
          axisPointer: {
            lineStyle: {
              width: titleFontSize,
            },
          },
        },
        series: [
          {
            barWidth: titleFontSize,
            itemStyle: {
              barBorderRadius: [0, titleFontSize / 2, titleFontSize / 2, 0],
            },
          },
        ],
      };
      this.chartInstance.setOption(adapterOption);
      this.chartInstance.resize(); //手动调用图表对象的resize()才能生效
    },
  },
};
</script>
代码讲解:
2.1、动态刷新
(1)、处理数据:接口返回的数据共15条,每5个元素为一页,通过定时器让currentPage++来实现数据的变化;
(2)、触发时机:echarts自带的事件mouseover、mouseout来开启/停止定时器;
(3)、边界值处理:当currentPage > totalPage时就是边界了,此时currentPage = 1;
2.2、UI调整
柱子宽度:barWidth、柱子上的文字:label、柱子圆角:itemStyle.barBorderRadius;颜色渐变:itemStyle.color加LinearGradient、柱子划过提示:tooltip;
横向渐变原理图:

2.3、分辨率适配
(1)、监听浏览器窗口变化 window.addEventListener("resize", this.screenAdapter);
(2)、根据原始窗口宽度计算一个变化值this.$refs.seller_ref.offsetWidth,将配置(fontSize、width、barWidth、barBorderRadius等)里的具体数字改为适配值
(3)、手动调用图表对象的resize()就OK了
三、(竖向平移)柱状图
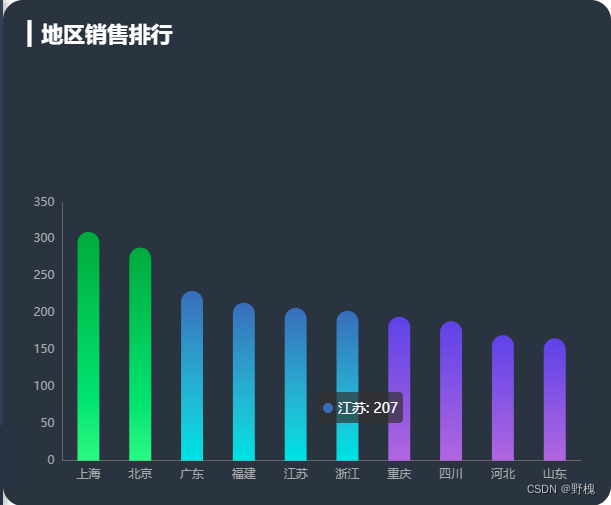
代码如下:
<template>
  <div class="com-container">
    <div class="com-chart" ref="rank_ref"></div>
  </div>
</template>
<script>
import * as ets from "echarts";
import chalk from "../../../../public/static/theme/chalk.json"; //自己下载
export default {
  data() {
    return {
      chartInstance: null,
      allData: null,
      startValue: 0, //区域缩放的起点值
      endValue: 9, //区域缩放的终点值
      timeId: null,
    };
  },
  mounted() {
    this.initChart();
    this.getData();
    window.addEventListener("resize", this.screenAdapter);
    this.screenAdapter();
  },
  destroyed() {
    clearInterval(this.timeId);
    window.removeEventListener("resize", this.screenAdapter);
  },
  methods: {
    // 初始化echartsInstance对象
    initChart() {
      ets.registerTheme("chalk", chalk);
      this.chartInstance = ets.init(this.$refs.rank_ref, "chalk");
      const initOption = {
        title: {
          text: "▎地区销售排行",
          left: 20,
          top: 20,
        },
        grid: {
          top: "40%",
          left: "5%",
          right: "5%",
          bottom: "5%",
          containLabel: true, //文字在位置范围内
        },
        tooltip: {
          show: true,
        },
        xAxis: {
          type: "category",
        },
        yAxis: {
          type: "value",
        },
        series: [
          {
            type: "bar",
          },
        ],
      };
      this.chartInstance.setOption(initOption);
      //   鼠标移入图表中动画停止,移出则动画继续
      this.chartInstance.on("mouseover", () => {
        clearInterval(this.timeId);
      });
      this.chartInstance.on("mouseout", () => {
        this.startInterval();
      });
    },
    // 获取服务器数据
    async getData() {
      const { data: ret } = await this.$http.get("rank");
      this.allData = ret;
      this.allData.sort((a, b) => {
        return b.value - a.value; //从大到小进行排序
      });
      this.updateChart();
      this.startInterval();
    },
    // 更新图表
    updateChart() {
      const colorArr = [
        ["#0BA82C", "#4FF778"],
        ["#2E72BF", "#23E5E5"],
        ["#5052EE", "#AB6EE5"],
      ];
      const provinceArr = this.allData.map((item) => {
        return item.name;
      });
      const valueArr = this.allData.map((item) => {
        return item.value;
      });
      const dataOption = {
        xAxis: {
          data: provinceArr,
        },
        dataZoom: {
          show: false,
          startValue: this.startValue,
          endValue: this.endValue,
        },
        series: [
          {
            data: valueArr,
            itemStyle: {
              color: (arg) => {
                //不同数值显示不同颜色
                let targetColorArr = null;
                if (arg.value > 230) {
                  targetColorArr = colorArr[0];
                } else if (arg.value > 200) {
                  targetColorArr = colorArr[1];
                } else {
                  targetColorArr = colorArr[2];
                }
                return new this.$echarts.graphic.LinearGradient(0, 0, 0, 1, [
                  {
                    offset: 0,
                    color: targetColorArr[0],
                  },
                  {
                    offset: 1,
                    color: targetColorArr[1],
                  },
                ]);
              },
            },
          },
        ],
      };
      this.chartInstance.setOption(dataOption);
    },
    // 平移动画效果
    startInterval() {
      if (this.timeId) {
        clearInterval(this.timeId);
      }
      this.timeId = setInterval(() => {
        this.startValue++;
        this.endValue++;
        if (this.endValue > this.allData.length - 1) {
          this.startValue = 0;
          this.endValue = 9;
        }
        this.updateChart();
      }, 2000);
    },
    // 当浏览器大小发生变化时,会进行分辨率适配
    screenAdapter() {
      const titleFontSize = (this.$refs.rank_ref.offsetWidth / 100) * 3.6;
      const adapterOption = {
        title: {
          textStyle: {
            fontSize: titleFontSize,
          },
        },
        series: [
          {
            barWidth: titleFontSize,
            itemStyle: {
              barBorderRadius: [titleFontSize / 2, titleFontSize / 2, 0, 0],
            },
          },
        ],
      };
      this.chartInstance.setOption(adapterOption);
      this.chartInstance.resize();
    },
  },
};
</script>
3.1、平移动画
共21条数据,一次性展示10条数据,借助定时器,每间隔一段时间向左移动一天数据,本质就是控制dataZoom的startValue和endValue
3.2、不同数值显示不同颜色
在itemStyle.color的回调函数里可以依次拿到所有结果,根据自己的需求返回不同颜色即可,渐变色就自定义二维数组即可
四、(下拉切换)折线图
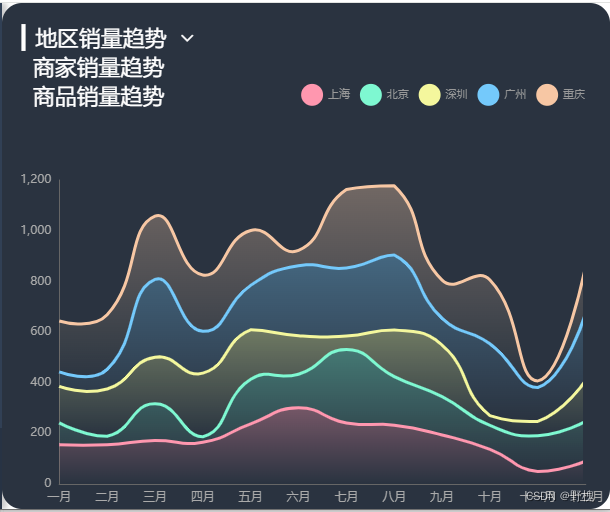
代码如下:
<template>
<div class="com-container">
<div
class="title"
:style="{
fontSize: `${titleFontSize}px`,
}"
>
<span>{{ "▎" + showTitle }}</span>
<!-- 下拉箭头 -->
<span
class="iconfont title-icon"
:style="{
fontSize: `${titleFontSize}px`,
}"
@click="showChoice = !showChoice"
></span
>
<div class="select-con" v-show="showChoice" :style="marginStyle">
<div
class="select-item"
v-for="item in selectType"
:key="item.key"
@click="handleSelect(item.key)"
>
{{ item.text }}
</div>
</div>
</div>
<div class="com-chart" ref="trend_ref"></div>
</div>
</template>
<script>
import * as ets from "echarts";
import chalk from "../../../../public/static/theme/chalk.json";
export default {
data() {
return {
chartInstance: null,
allData: null,
showChoice: false, //是否显示可选项
choiceType: "map", //显示的后台数据类型(map、seller、commodity等)
titleFontSize: 0, //指明标题的字体大小
};
},
computed: {
selectType() {
if (!this.allData) {
return [];
} else {
return this.allData.type.filter((item) => {
return item.key != this.choiceType;
});
}
},
showTitle() {
if (!this.allData) {
return "";
} else {
return this.allData[this.choiceType].title;
}
},
marginStyle() {
return {
marginLeft: this.titleFontSize / 2 + "px",
};
},
},
mounted() {
this.initChart();
this.getData();
window.addEventListener("resize", this.screenAdapter);
this.screenAdapter();
},
destroyed() {
clearInterval(this.timeId);
window.removeEventListener("resize", this.screenAdapter);
},
methods: {
// 初始化echartsInstance对象
initChart() {
ets.registerTheme("chalk", chalk);
this.chartInstance = ets.init(this.$refs.trend_ref, "chalk");
const initOption = {
grid: {
left: "3%",
top: "35%",
right: "4%",
bottom: "1%",
containLabel: true, //文字在位置范围内
},
tooltip: {
trigger: "axis", //工具提示
},
legend: { right: 20, top: "15%", icon: "circle" }, //图例位置和形状
xAxis: {
type: "category",
boundaryGap: false, //紧挨边缘
},
yAxis: {
type: "value",
},
};
this.chartInstance.setOption(initOption);
},
// 获取服务器数据
async getData() {
const { data: ret } = await this.$http.get("trend");
this.allData = ret;
this.updateChart();
},
// 更新图表
updateChart() {
const colorArr1 = [
"rgba(255,151,175,0.5)",
"rgba(126,248,209,0.5)",
"rgba(244,247,157,0.5)",
"rgba(116,201,251,0.5)",
"rgba(247,199,164,0.5)",
]; //半透明颜色值
const colorArr2 = [
"rgba(255,151,175,0)",
"rgba(126,248,209,0)",
"rgba(244,247,157,0)",
"rgba(116,201,251,0)",
"rgba(247,199,164,0)",
]; //全透明颜色值
const timeArr = this.allData.common.month; //类目轴数据
const valueArr = this.allData[this.choiceType].data;
const seriesArr = valueArr.map((item, index) => {
return {
name: item.name,
type: "line",
data: item.data,
stack: this.choiceType, //堆叠图
areaStyle: {
//区域面积、颜色渐变
color: new this.$echarts.graphic.LinearGradient(0, 0, 0, 1, [
{
offset: 0,
color: colorArr1[index],
},
{
offset: 1,
color: colorArr2[index],
},
]),
},
};
}); //y轴数据
const legendArr = valueArr.map((item) => {
return item.name;
}); //图例数据
const dataOption = {
xAxis: {
data: timeArr,
},
legend: {
data: legendArr,
},
series: seriesArr,
};
this.chartInstance.setOption(dataOption);
},
// 当浏览器大小发生变化时,会进行分辨率适配
screenAdapter() {
this.titleFontSize = (this.$refs.trend_ref.offsetWidth / 100) * 3.6;
const adapterOption = {
legend: {
//图例和文字大小适配
itemWidth: this.titleFontSize,
itemHeight: this.titleFontSize,
itemFap: this.titleFontSize,
textStyle: {
fontSize: this.titleFontSize / 2,
},
},
};
this.chartInstance.setOption(adapterOption);
this.chartInstance.resize();
},
handleSelect(currentType) {
this.choiceType = currentType;
this.updateChart();
this.showChoice = false;
},
},
};
</script>
<style lang='less' scoped>
.title {
position: absolute;
left: 240px;
top: 20px;
z-index: 10;
color: white;
.title-icon {
margin-left: 10px;
cursor: pointer;
}
.select-on {
background-color: #222733;
}
}
</style>代码讲解:
4.1、切换图表和分辨率适配
(1)、可选项:下拉出现列表,列表过滤掉已选择数据,选中后更新数据,列表消失;
(2)、通过全局变量this.titleFontSize给图例、标题、下拉选择项的字体大小进行设置,视图里的样式适配:fontSize: `${titleFontSize}px`
4.2、UI调整
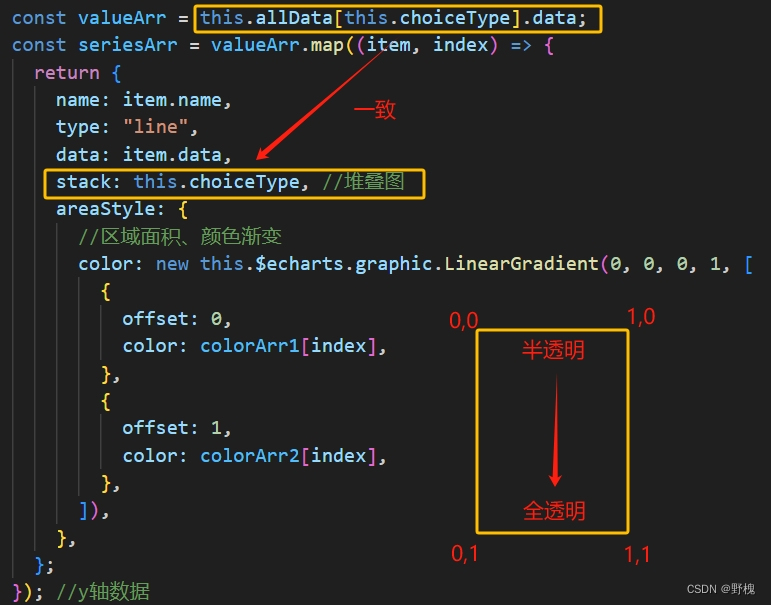
坐标轴设置:grid、紧挨边缘:xAxis.boundaryGap、图例位置和形状:legend、区域面积和颜色渐变:itemStyle.color加LinearGradient、工具提示:tooltip;
区域面积颜色渐变原理图:
图例注意事项:

五、(三级分类)饼图
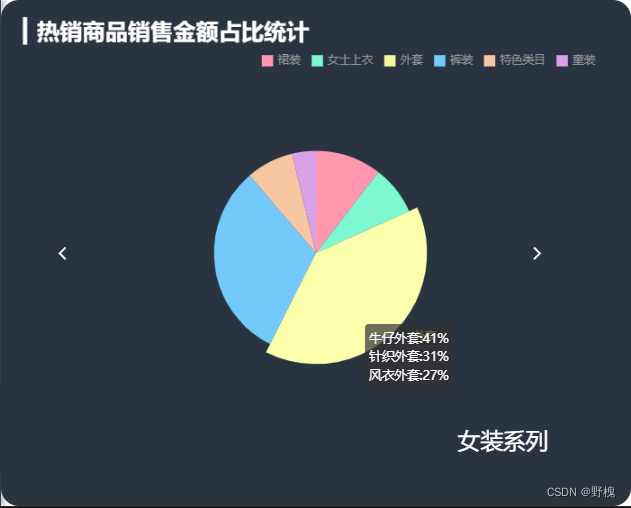
代码如下:
<template>
<div class="com-container">
<div class="com-chart" ref="hot_ref"></div>
<!-- 左右箭头 -->
<span class="iconfont arr-left" @click="toLeft" :style="comStyle"></span>
<span class="iconfont arr-right" @click="toRight" :style="comStyle"></span>
<!-- 一级标题 -->
<span class="cat-name" :style="comStyle">{{ catName }}系列</span>
</div>
</template>
<script>
import * as ets from "echarts";
import chalk from "../../../../public/static/theme/chalk.json"; //自己下载
export default {
data() {
return {
chartInstance: null,
allData: null,
currentIndex: 0, //一级分类的下标
titleFontSize: 0,
};
},
computed: {
catName() {
if (!this.allData) {
return "";
} else {
return this.allData[this.currentIndex].name;
}
},
comStyle() {
return {
fontSize: `${this.titleFontSize}px`,
};
},
},
mounted() {
this.initChart();
this.getData();
window.addEventListener("resize", this.screenAdapter);
this.screenAdapter();
},
destroyed() {
window.removeEventListener("resize", this.screenAdapter);
},
methods: {
// 初始化echartsInstance对象
initChart() {
ets.registerTheme("chalk", chalk);
this.chartInstance = ets.init(this.$refs.hot_ref, "chalk");
const initOption = {
title: {
text: "▎热销商品销售金额占比统计",
left: 20,
top: 20,
},
legend: {
//图例位置和文字
top: "10%",
right: "5%",
icon: "cicle",
},
tooltip: {
show: true,
formatter: (arg) => {
const thirdCategory = arg.data.children;
let total = 0;
thirdCategory.forEach((item) => {
total += item.value;
});
let retSrt = "";
thirdCategory.forEach((item) => {
retSrt += `${item.name}:${
parseInt((item.value / total) * 100) + "%"
}<br/>`;
});
return retSrt;
},
}, //划过显示该二级模块对应的三级类别
series: [
{
type: "pie",
label: {
show: false,
},
emphasis: {
//默认不显示文字,高亮状态下才显示文字
label: {
show: true,
},
labelLine: {
show: false,
},
},
},
],
};
this.chartInstance.setOption(initOption);
},
// 获取服务器数据
async getData() {
const { data: ret } = await this.$http.get("hotproduct");
this.allData = ret;
this.allData.sort((a, b) => {
return b.value - a.value;
});
this.updateChart();
},
// 更新图表
updateChart() {
const legendData = this.allData[this.currentIndex].children.map(
(item) => {
return item.name;
}
);
const seriesData = this.allData[this.currentIndex].children.map(
(item) => {
return {
name: item.name,
value: item.value,
children: item.children, //为了在tooltip中的回调函数中拿到对应的三级类别
};
}
);
const dataOption = {
legend: {
data: legendData,
},
series: [
{
data: seriesData,
},
],
};
this.chartInstance.setOption(dataOption);
},
// 当浏览器大小发生变化时,会进行分辨率适配
screenAdapter() {
this.titleFontSize = (this.$refs.hot_ref.offsetWidth / 100) * 3.6;
const adapterOption = {
title: {
textStyle: {
fontSize: this.titleFontSize,
},
},
legend: {
itemWidth: this.titleFontSize / 2,
itemHeight: this.titleFontSize / 2,
itemGap: this.titleFontSize / 2,
textStyle: {
fontSize: this.titleFontSize / 2,
},
},
series: [
{
radius: this.titleFontSize * 4.5,
center: ["50%", "50%"],
},
],
};
this.chartInstance.setOption(adapterOption);
this.chartInstance.resize();
},
toLeft() {
this.currentIndex--;
if (this.currentIndex < 0) {
this.currentIndex = this.allData.length - 1;
}
this.updateChart();
},
toRight() {
this.currentIndex++;
if (this.currentIndex > this.allData.length - 1) {
this.currentIndex = 0;
}
this.updateChart();
},
},
};
</script>
<style lang='less' scoped>
.arr-left {
position: absolute;
left: 20%;
top: 50%;
transform: translateY(-50%);
cursor: pointer;
color: white;
}
.arr-right {
position: absolute;
right: 10%;
top: 50%;
transform: translateY(-50%);
cursor: pointer;
color: white;
}
.cat-name {
position: absolute;
right: 10%;
bottom: 10%;
color: white;
}
</style>5.1、数据切换
左右箭头类似轮播图,依靠currentIndex的变化展示一级类别数据,饼图模块对应二级数据,鼠标划到该模块,会展示三级类别的占比,这个需要在组装数据时将三级数据追加进去
六、圆环饼图
代码如下:
<template>
  <div class="com-container">
    <div class="com-chart" ref="stock_ref"></div>
  </div>
</template>
<script>
import * as ets from "echarts";
import chalk from "../../../../public/static/theme/chalk.json"; //自己下载
export default {
  data() {
    return {
      chartInstance: null,
      allData: null,
      currentIndex: 0, //当前显示的数据
      timerId: null, //定时器标识
    };
  },
  mounted() {
    this.initChart();
    this.getData();
    window.addEventListener("resize", this.screenAdapter);
    this.screenAdapter();
  },
  destroyed() {
    window.removeEventListener("resize", this.screenAdapter);
    clearInterval(this.timerId);
  },
  methods: {
    // 初始化echartsInstance对象
    initChart() {
      ets.registerTheme("chalk", chalk);
      this.chartInstance = ets.init(this.$refs.stock_ref, "chalk");
      const initOption = {
        title: {
          text: "▎库存和销量分析",
          left: 20,
          top: 20,
        },
        series: [
          {
            type: "pie",
          },
        ],
      };
      this.chartInstance.setOption(initOption);
      this.chartInstance.on("mouseover", () => {
        clearInterval(this.timerId);
      });
      this.chartInstance.on("mouseout", () => {
        this.startInterval();
      });
    },
    // 获取服务器数据
    async getData() {
      const { data: ret } = await this.$http.get("stock");
      this.allData = ret;
      this.updateChart();
      this.startInterval();
    },
    // 更新图表
    updateChart() {
      const centerArr = [
        ["18%", "40%"],
        ["50%", "40%"],
        ["82%", "40%"],
        ["34%", "75%"],
        ["66%", "75%"],
      ];
      const colorArr = [
        ["#4FF778", "#0BA82C"],
        ["#E5DD45", "#E8B11C"],
        ["#E8821C", "#E55445"],
        ["#5052EE", "#AB6EE5"],
        ["#23E5E5", "#2E72BF"],
      ];
      const start = this.currentIndex * 5;
      const end = (this.currentIndex + 1) * 5;
      const showData = this.allData.slice(start, end);
      const seriesArr = showData.map((item, index) => {
        return {
          type: "pie",
          radius: [110, 100],
          center: centerArr[index],
          hoverAnimation: false, //关闭鼠标移入到饼图时的动画效果
          labelLine: {
            show: false, //隐藏模块指示线
          },
          label: {
            position: "center",
            color: colorArr[index][0],
          },
          data: [
            {
              name: item.name + "\n" + item.sales, //圆环内文字
              value: item.sales,
              itemStyle: {
                color: new this.$echarts.graphic.LinearGradient(0, 1, 0, 0, [
                  {
                    offset: 0,
                    color: colorArr[index][0],
                  },
                  {
                    offset: 1,
                    color: colorArr[index][1],
                  },
                ]),
              },
            }, //圆环渐变颜色
            {
              value: item.stock,
              itemStyle: {
                color: "#313743",
              },
            },
          ],
        };
      });
      const dataOption = {
        series: seriesArr,
      };
      this.chartInstance.setOption(dataOption);
    },
    // 当浏览器大小发生变化时,会进行分辨率适配
    screenAdapter() {
      let titleFontSize = (this.$refs.stock_ref.offsetWidth / 100) * 3.6;
      const innerRadius = titleFontSize * 2;
      const outterRadius = innerRadius * 1.125;
      const adapterOption = {
        title: {
          textStyle: {
            fontSize: titleFontSize,
          },
        },
        series: [
          {
            type: "pie",
            radius: [outterRadius, innerRadius],
            label: {
              fontSize: titleFontSize / 2,
            },
          },
          {
            type: "pie",
            radius: [outterRadius, innerRadius],
            label: {
              fontSize: titleFontSize / 2,
            },
          },
          {
            type: "pie",
            radius: [outterRadius, innerRadius],
            label: {
              fontSize: titleFontSize / 2,
            },
          },
          {
            type: "pie",
            radius: [outterRadius, innerRadius],
            label: {
              fontSize: titleFontSize / 2,
            },
          },
          {
            type: "pie",
            radius: [outterRadius, innerRadius],
            label: {
              fontSize: titleFontSize / 2,
            },
          },
        ],
      };
      this.chartInstance.setOption(adapterOption);
      this.chartInstance.resize();
    },
    startInterval() {
      if (this.timerId) {
        clearInterval(this.timerId);
      }
      this.timerId = setInterval(() => {
        this.currentIndex++;
        if (this.currentIndex > 1) {
          this.currentIndex = 0;
        }
        this.updateChart(); //currentIndex更改后,刷新界面
      }, 5000);
    },
  },
};
</script>
6.1、切换动画
currentIndex标识当前页数,每一页显示5个圆,每5秒更新一次start和end,达到动态切换
UI调整:
hoverAnimation: false, //关闭鼠标移入到饼图时的动画效果
labelLine: {show: false, },//隐藏模块指示线
七、地图+散点图
<template>
  <div class="com-container" @dblclick="revertMap">
    <div class="com-chart" ref="map_ref"></div>
  </div>
</template>
<script>
import * as ets from "echarts";
import axios from "axios";
import { getProvinceMapInfo } from "@/utils/map_utils";
import chalk from "../../../../public/static/theme/chalk.json"; //自己下载
export default {
  data() {
    return {
      chartInstance: null,
      allData: null,
      mapData: {}, //所获取的省份的地图矢量数据
    };
  },
  mounted() {
    this.initChart();
    this.getData();
    window.addEventListener("resize", this.screenAdapter);
    this.screenAdapter(); //得先主动适配屏幕
  },
  destroyed() {
    window.removeEventListener("resize", this.screenAdapter);
  },
  methods: {
    // 初始化echartsInstance对象
    async initChart() {
      ets.registerTheme("chalk", chalk);
      this.chartInstance = ets.init(this.$refs.map_ref, "chalk");
      // 使用axios获取本地json数据
      const res = await axios.get(
        "http://10.52.12.xx:8080/static/map/china.json"
      );
      this.$echarts.registerMap("china", res.data);
      const initOption = {
        title: {
          text: "▎商家分布",
          left: 20,
          top: 20,
        },
        geo: {
          type: "map",
          map: "china",
          top: "5%",
          bottom: "5%",
          itemStyle: {
            areaColor: "#2E72BF", //地图颜色
            borderColor: "#333", //地图分界线颜色
          },
        },
        legend: {
          left: "5%",
          bottom: "5%",
          orient: "vertical", //图例垂直摆放
        },
      };
      this.chartInstance.setOption(initOption);
      // 监听点击事件、获取所点击省份的矢量地图数据、显示省份、回到中国地图
      this.chartInstance.on("click", async (arg) => {
        const provinceInfo = getProvinceMapInfo(arg.name);
        // 判断当前所点击的这个省份的地图矢量数据在mapData中是否存在
        if (!this.mapData[provinceInfo.key]) {
          const ret = await axios.get(
            "http://10.52.12.xx:8080" + provinceInfo.path
          );
          this.mapData[provinceInfo.key] = ret.data;
          this.$echarts.registerMap(provinceInfo.key, ret.data);
        }
        const changeOption = {
          geo: {
            map: provinceInfo.key,
          },
        };
        this.chartInstance.setOption(changeOption);
      });
    },
    // 回到中国地图
    revertMap() {
      const revertOption = {
        geo: {
          map: "china",
        },
      };
      this.chartInstance.setOption(revertOption);
    },
    async getData() {
      const { data: ret } = await this.$http.get("map");
      this.allData = ret;
      this.updateChart();
    },
    // 更新图表
    updateChart() {
      // 图例数据
      const legendArr = this.allData.map((item) => {
        return item.name;
      });
      const seriesArr = this.allData.map((item) => {
        // 如果想在地图中显示散点数据,需要给散点的图表增加 coordinateSystem: "geo"  配置
        return {
          type: "effectScatter",
          rippleEffect: {
            scale: 5,
            brushType: "stroke", //空心涟漪效果
          },
          name: item.name,
          data: item.children,
          coordinateSystem: "geo",
        };
      });
      const dataOption = {
        legend: {
          data: legendArr,
        },
        series: seriesArr,
      };
      this.chartInstance.setOption(dataOption);
    },
    // 当浏览器大小发生变化时,会进行分辨率适配
    screenAdapter() {
      const titleFontSize = (this.$refs.map_ref.offsetWidth / 100) * 3.6;
      const adapterOption = {
        title: {
          textStyle: {
            fontSize: titleFontSize,
          },
        },
        legend: {
          itemWidth: titleFontSize / 2,
          itemHeight: titleFontSize / 2,
          itemGap: titleFontSize / 2, //图例间隔
          textStyle: {
            fontSize: titleFontSize / 2,
          },
        },
      };
      this.chartInstance.setOption(adapterOption);
      this.chartInstance.resize(); //手动调用图表对象的resize()才能生效
    },
  },
};
</script>
7.1、地图上显示散点
在地图上给散点图表增加 coordinateSystem: "geo" 配置
7.2、点击出现单个省份,双击复原
备注:getProvinceMapInfo是将汉字转为省份拼音,以便获取对应的本地省份数据
(1)、监听各个省份的点击事件,获取对应的arg.name(汉字);
(2)、根据getProvinceMapInfo()获取所点击省份的矢量地图数据,用mapData存下以获取数据,减少请求的二次发送;
(3)、根据this.$echarts.registerMap(“省份名”, "省份数据”)显示省份和对应的数据
(4)、双击页面,通过重新注册"china",回到中国地图。
下篇将分享全屏切换、实时监测【WebSocket】等功能。

