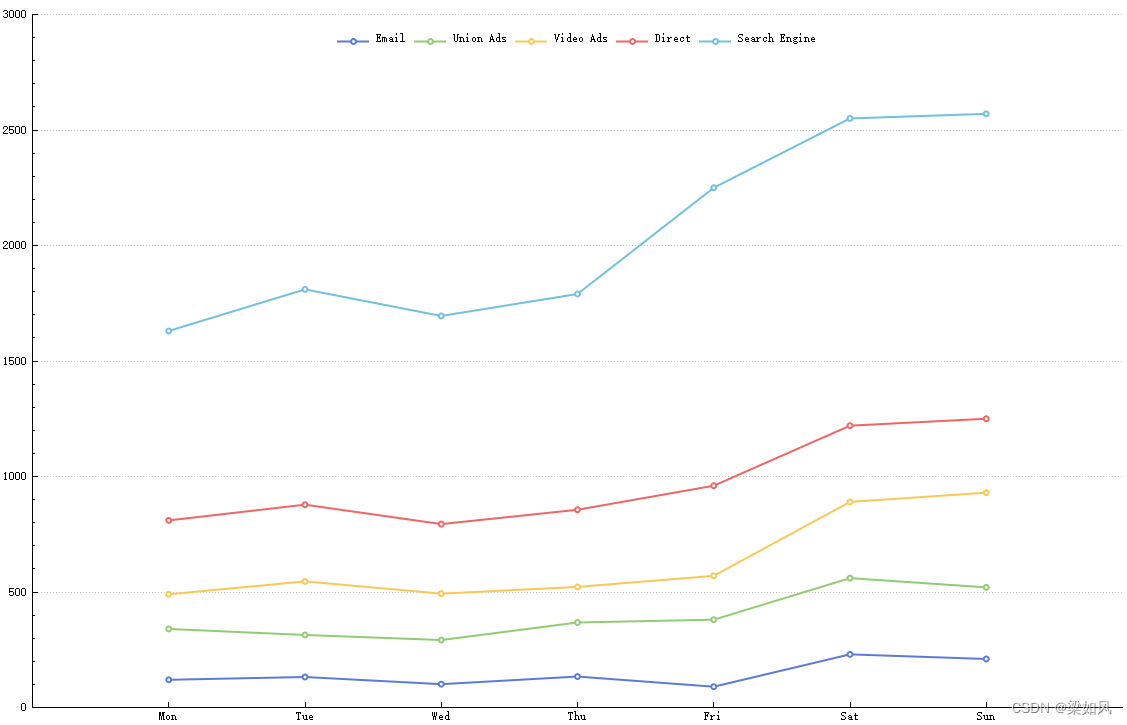
最近在做流程图功能开发,发现阿里antV 有对应的可视化引擎,于是自己做了一个简单vue 基于antV 实现流程图编辑器代码
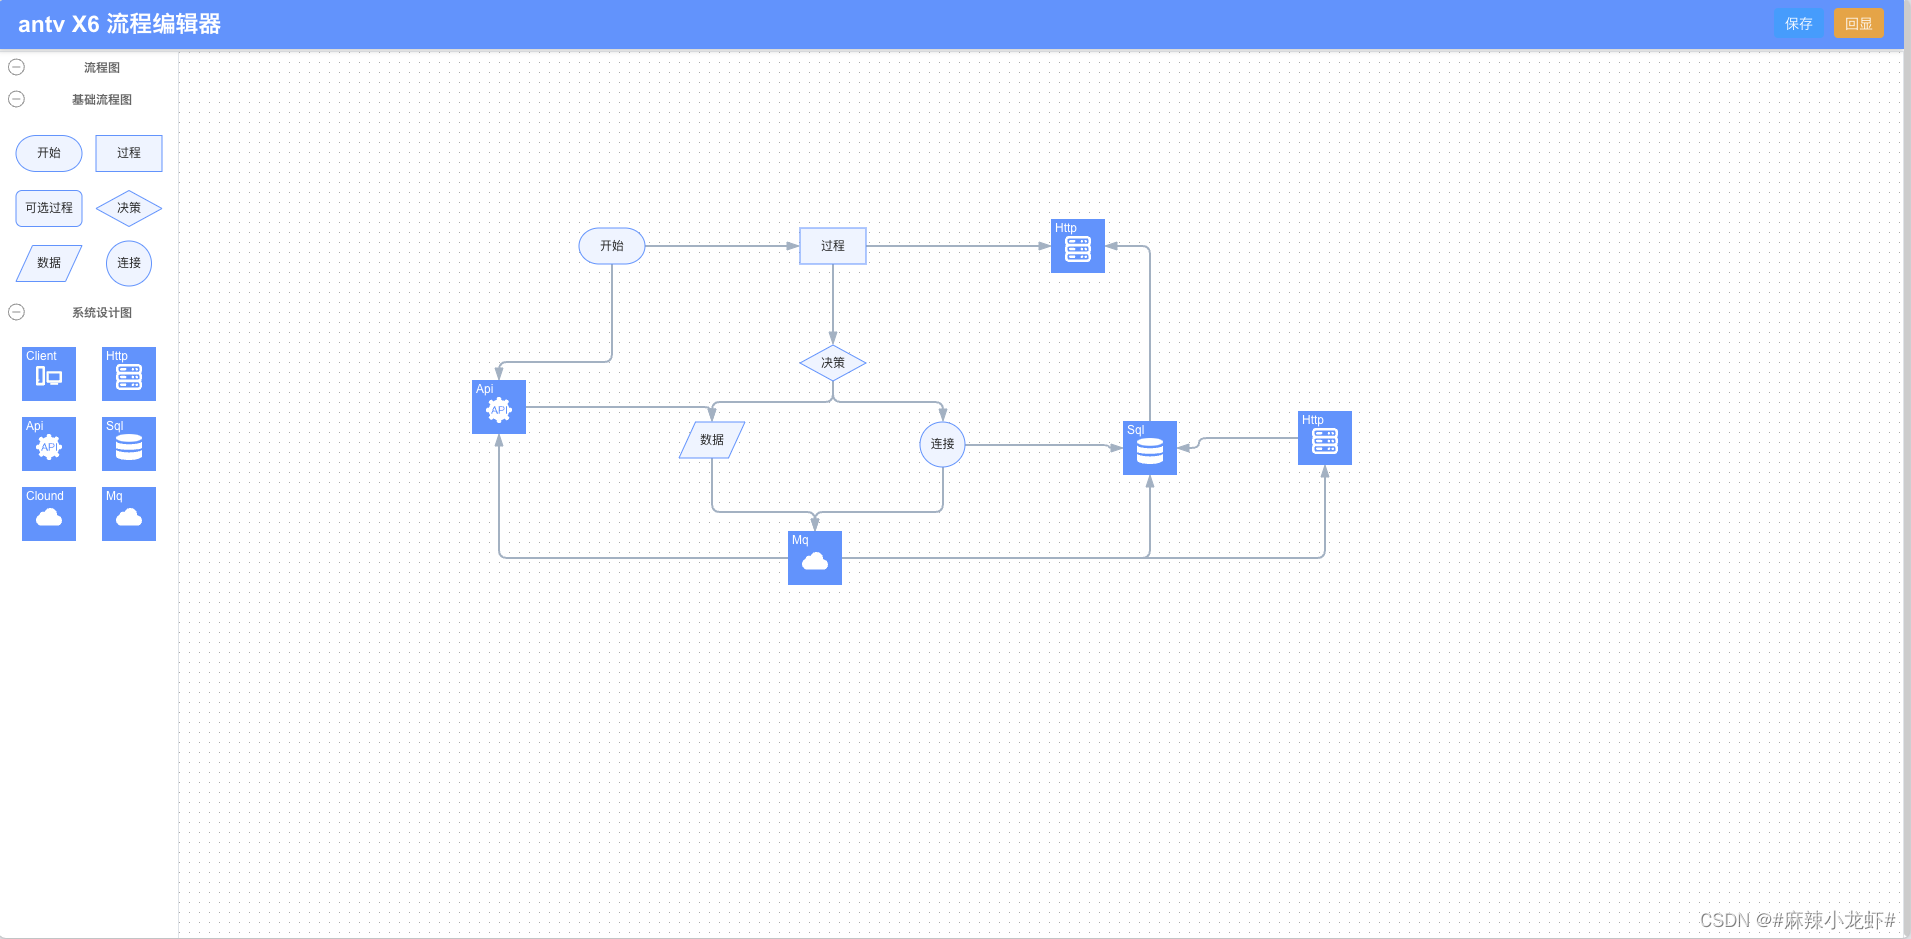
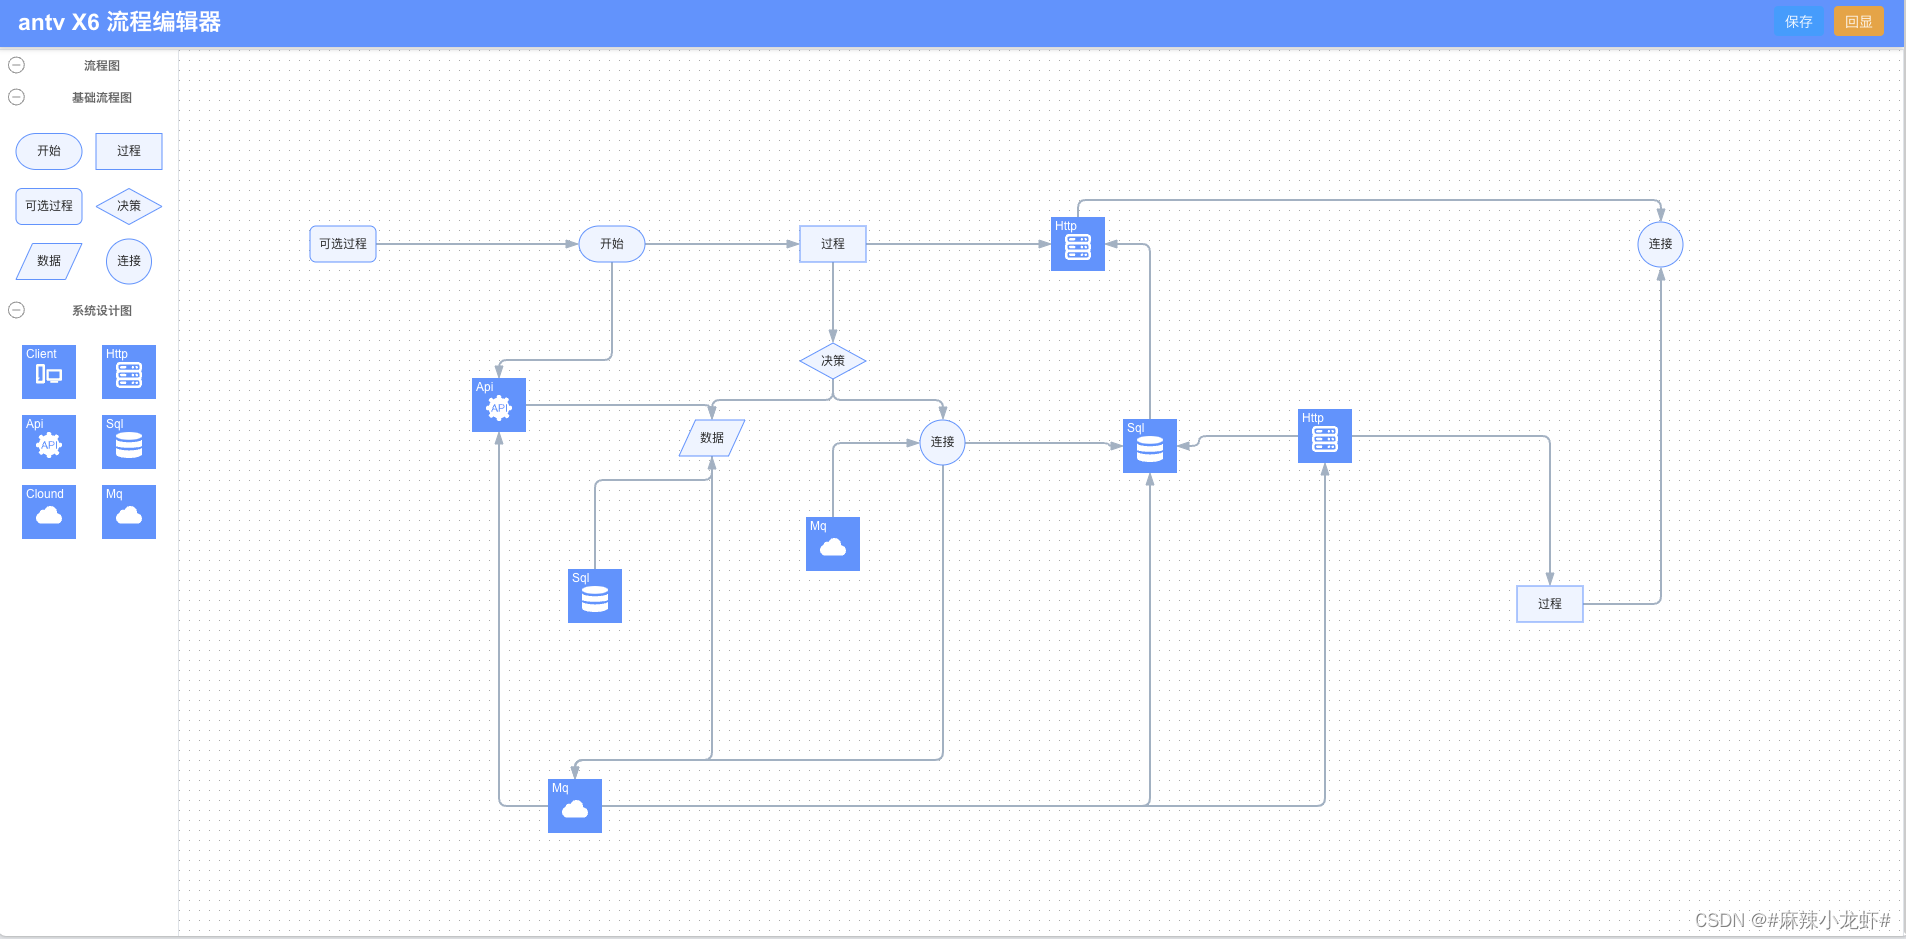
部分代码如下:
<template>
  <div id="flowEditorContent">
    <header>
      <h3>antv X6 流程编辑器</h3>
      <div class="right">
        <el-button type="primary" size="min" @click="save">保存</el-button>
        <el-button type="warning" size="min" @click="show">回显</el-button>
      </div>
    </header>
    <div class="flowEditor" id="container"></div>
  </div>
</template>
<style lang="scss" scoped>
header {
display: flex;
justify-content: space-between;
position: relative;
z-index: 1;
padding: 0 20px;
height: 50px;
line-height: 50px;
margin-bottom: 2px;
box-shadow: 0 2px 5px #ccc;
background: #5f95ff;
h3 {
text-align: left;
color: #fff;
font-size: 23px;
font-weight: bolder;
}
::v-deep.el-button {
height: 30px;
line-height: 30px;
padding: 0 10px;
span {
color: #fff;
}
}
}
#container {
min-width: 400px;
height: calc(100vh - 50px);
display: flex;
border: 1px solid #dfe3e8;
}
</style>const graph = new Graph({
container: document.getElementById('graph-container'),
grid: true,
mousewheel: {
enabled: true,
zoomAtMousePosition: true,
modifiers: 'ctrl',
minScale: 0.5,
maxScale: 3,
},
connecting: {
router: 'manhattan',
connector: {
name: 'rounded',
args: {
radius: 8,
},
},
anchor: 'center',
connectionPoint: 'anchor',
allowBlank: false,
snap: {
radius: 20,
},
createEdge () {
return new Shape.Edge({
attrs: {
line: {
stroke: '#A2B1C3',
strokeWidth: 2,
targetMarker: {
name: 'block',
width: 12,
height: 8,
},
},
},
zIndex: 0,
});
},
validateConnection ({ targetMagnet }) {
return !!targetMagnet;
},
},
highlighting: {
magnetAdsorbed: {
name: 'stroke',
args: {
attrs: {
fill: '#5F95FF',
stroke: '#5F95FF',
},
},
},
},
});// delete
graph.bindKey('backspace', () => {
const cells = graph.getSelectedCells();
if (cells.length) {
graph.removeCells(cells);
}
});
// zoom
graph.bindKey(['ctrl+1', 'meta+1'], () => {
const zoom = graph.zoom();
if (zoom < 1.5) {
graph.zoom(0.1);
}
});
graph.bindKey(['ctrl+2', 'meta+2'], () => {
const zoom = graph.zoom();
if (zoom > 0.5) {
graph.zoom(-0.1);
}
});
const showPorts = (ports, show) => {
        for (let i = 0, len = ports.length; i < len; i += 1) {
          ports[i].style.visibility = show ? 'visible' : 'hidden';
        }
      };
      graph.on('node:mouseenter', () => {
        const container = document.getElementById('graph-container');
        const ports = container.querySelectorAll(
          '.x6-port-body',
        );
        showPorts(ports, true);
      });
      graph.on('node:mouseleave', () => {
        const container = document.getElementById('graph-container');
        const ports = container.querySelectorAll(
          '.x6-port-body',
        );
        showPorts(ports, false);
      });
