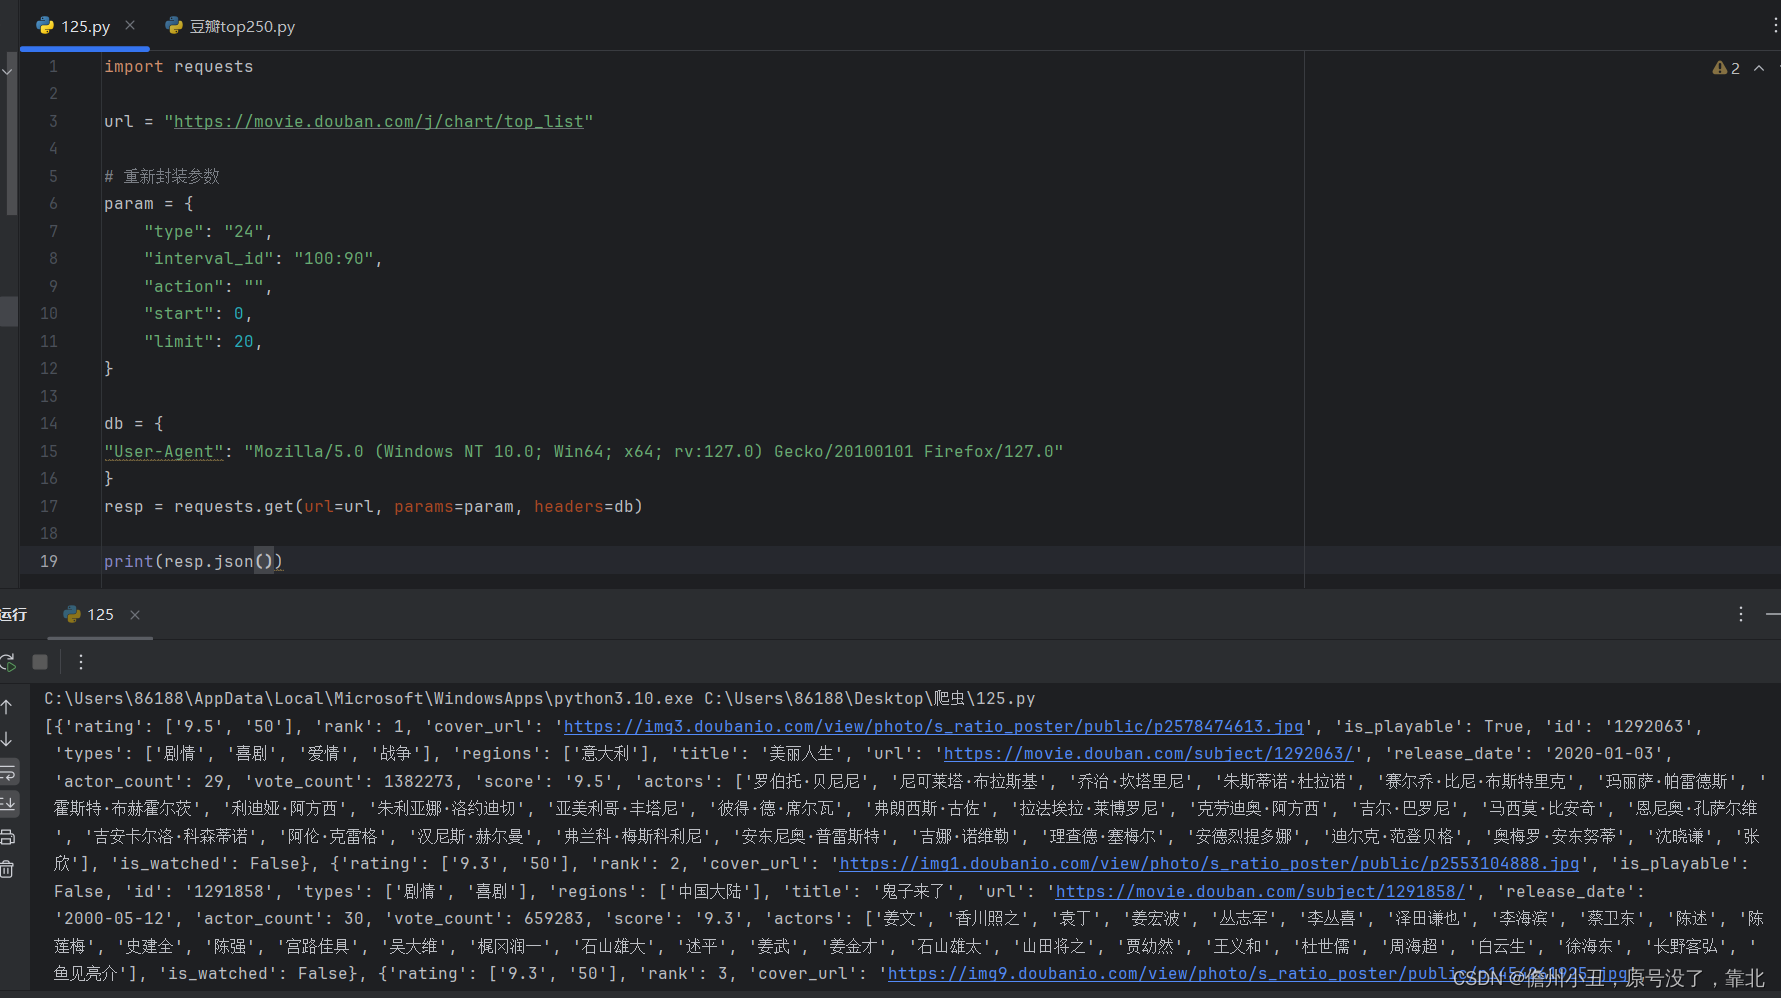
之前的文章:
基于自编码器的滚动轴承异常检测方法(NASA-IMS轴承数据,Python)
基于单类支持向量机的滚动轴承异常检测方法(NASA-IMS轴承数据,Python)
基于主成分分析的滚动轴承异常检测方法(NASA-IMS轴承数据,Python)
import numpy as np
import pandas as pd
import matplotlib.pyplot as plt
import scipy.io as sio
from mpl_toolkits.axes_grid1.inset_locator import inset_axes
from mpl_toolkits.axes_grid1.inset_locator import mark_inset
signals_test2_channels = sio.loadmat('signals_test2_channels.mat')
Ch1_test2 = signals_test2_channels['Ch1']
Ch1_test2 = Ch1_test2[0]
signal_duration_test2 = 9840
nfiles_test2 = 984
onset_anomalies_PCA_GMM_Ch1 = (signal_duration_test2 - 2820)
onset_anomalies_PCA_ZS_Ch1 = (signal_duration_test2 - 3720)
onset_anomalies_Autoencoder_GMM_Ch1 = (signal_duration_test2 - 2820)
onset_anomalies_Autoencoder_ZS_Ch1 = (signal_duration_test2 - 2810)
onset_anomalies_OCSVM = (signal_duration_test2 - 3760)
t_test2 =  np.linspace(0, signal_duration_test2, len(Ch1_test2))
fig, ax = plt.subplots()
axins = inset_axes(ax, 2, 2 , loc=1, bbox_to_anchor=(0.01, 0.35), bbox_transform=ax.figure.transFigure)
axins2 = inset_axes(ax, 2, 2 , loc=2, bbox_to_anchor=(1.05, 0.35), bbox_transform=ax.figure.transFigure)


ax.plot(t_test2, Ch1_test2, alpha = 0.7)
ax.axvline(onset_anomalies_PCA_GMM_Ch1, color = '#6A0A2F', linestyle='--', label = 'PCA - GMM')
ax.axvline(onset_anomalies_PCA_ZS_Ch1, color = '#6A0A2F', linestyle=':', label = 'PCA - Z-Scores')
ax.axvline(onset_anomalies_Autoencoder_GMM_Ch1, color = '#FF5733', linestyle='--', label = 'Autoencoder - GMM')
ax.axvline(onset_anomalies_Autoencoder_ZS_Ch1, color = '#FF5733', linestyle=':', label = 'Autoencoder - Z-Scores')
ax.axvline(onset_anomalies_OCSVM, color = '#FFC300', linestyle='--', label = 'OCSVM')


axins.plot(t_test2, Ch1_test2,  alpha = 0.7)
axins.axvline(onset_anomalies_PCA_GMM_Ch1, color = '#6A0A2F', linestyle='--', label = 'PCA - GMM')
axins.axvline(onset_anomalies_PCA_ZS_Ch1, color = '#6A0A2F', linestyle=':', label = 'PCA - Z-Scores')
axins.axvline(onset_anomalies_Autoencoder_GMM_Ch1, color = '#FF5733', linestyle='--', label = 'Autoencoder - GMM')
axins.axvline(onset_anomalies_Autoencoder_ZS_Ch1, color = '#FF5733', linestyle=':', label = 'Autoencoder - Z-Scores')
axins.axvline(onset_anomalies_OCSVM, color = '#FFC300', linestyle='--', label = 'OCSVM')


axins2.plot(t_test2, Ch1_test2,  alpha = 0.7)
axins2.axvline(onset_anomalies_PCA_GMM_Ch1, color = '#6A0A2F', linestyle='--', label = 'PCA - GMM')
axins2.axvline(onset_anomalies_PCA_ZS_Ch1, color = '#6A0A2F', linestyle=':', label = 'PCA - Z-Scores')
axins2.axvline(onset_anomalies_Autoencoder_GMM_Ch1, color = '#FF5733', linestyle='--', label = 'Autoencoder - GMM')
axins2.axvline(onset_anomalies_Autoencoder_ZS_Ch1, color = '#FF5733', linestyle=':', label = 'Autoencoder - Z-Scores')
axins2.axvline(onset_anomalies_OCSVM, color = '#FFC300', linestyle='--', label = 'OCSVM')


x1, x2, y1, y2 = 6070, 6130, -1, 1
axins.set_xlim(x1, x2)
axins.set_ylim(y1, y2)


x1, x2, y1, y2 = 7010, 7050, -1, 1
axins2.set_xlim(x1, x2)
axins2.set_ylim(y1, y2)
axins2.annotate('PCA-GMM', xy=(7020, 0.4), xytext=(7032, 0.8),
            arrowprops=dict(arrowstyle="-|>", connectionstyle="angle3,angleA=90,angleB=0")
            )
axins2.annotate('Aut.-GMM', xy=(7020, -0.2), xytext=(7032, 0.2),
            arrowprops=dict(arrowstyle="-|>", connectionstyle="angle3,angleA=90,angleB=0")
            )
axins2.annotate('Aut.-Z-Scores', xy=(7030, -0.8), xytext=(7032, -0.4),
            arrowprops=dict(arrowstyle="-|>", connectionstyle="angle3,angleA=90,angleB=0")
            )


axins.annotate('PCA-Z-Scores', xy=(6120, -0.8), xytext=(6085, -0.3),
            arrowprops=dict(arrowstyle="-|>", connectionstyle="angle3,angleA=90,angleB=0")
            )
axins.annotate('OCSVM', xy=(6080, 0), xytext=(6100, 0.5),
            arrowprops=dict(arrowstyle="-|>", connectionstyle="angle3,angleA=90,angleB=0")
            )


mark_inset(ax, axins, loc1=1, loc2=2, fc="none", ec="0.5")
mark_inset(ax, axins2, loc1=1, loc2=2, fc="none", ec="0.5")


ax.set_xlabel('Time (min)')
ax.set_ylabel('Amplitude')
ax.set_title('Ch1 - test2')


axins.set_xlabel('Time (min)')
axins.set_ylabel('Amplitude')


axins2.set_xlabel('Time (min)')
axins2.set_ylabel('Amplitude')


ax.legend()
signals_test1_channels = sio.loadmat('signals_test1_channels.mat')
Ch5_test1 = signals_test1_channels['Ch5']
Ch6_test1 = signals_test1_channels['Ch6']
Ch5_test1 = Ch5_test1[0]
Ch6_test1 = Ch6_test1[0]
signal_duration_test1 = 43 * 5 + (2156 - 43) * 10
nfiles_test1 = 2156
onset_anomalies_PCA_GMM_Ch5 = (signal_duration_test1 - 3320)
onset_anomalies_PCA_ZS_Ch5 = (signal_duration_test1 - 3320)
onset_anomalies_Autoencoder_GMM_Ch5 = (signal_duration_test1 - 3350)
onset_anomalies_Autoencoder_ZS_Ch5 = (signal_duration_test1 - 3350)
onset_anomalies_OCSVM_Ch5 = (signal_duration_test1 - 3350)


onset_anomalies_PCA_GMM_Ch6 = (signal_duration_test1 - 2820)
onset_anomalies_PCA_ZS_Ch6 = (signal_duration_test1 - 3720)
onset_anomalies_Autoencoder_GMM_Ch6 = (signal_duration_test1 - 3310)
onset_anomalies_Autoencoder_ZS_Ch6 = (signal_duration_test1 - 3310)
onset_anomalies_OCSVM_Ch6 = (signal_duration_test1 - 4350)
t_test1 =  np.linspace(0, signal_duration_test1, len(Ch5_test1))
fig, ax = plt.subplots()
axins = inset_axes(ax, 2, 2 , loc=1, bbox_to_anchor=(1.5, 0.35), bbox_transform=ax.figure.transFigure)


ax.plot(t_test1, Ch5_test1, alpha = 0.7)
ax.axvline(onset_anomalies_PCA_GMM_Ch5, color = '#6A0A2F', linestyle='--', label = 'PCA - GMM')
ax.axvline(onset_anomalies_PCA_ZS_Ch5, color = '#6A0A2F', linestyle=':', label = 'PCA - Z-Scores')
ax.axvline(onset_anomalies_Autoencoder_GMM_Ch5, color = '#FF5733', linestyle='--', label = 'Autoencoder - GMM')
ax.axvline(onset_anomalies_Autoencoder_ZS_Ch5, color = '#FF5733', linestyle=':', label = 'Autoencoder - Z-Scores')
ax.axvline(onset_anomalies_OCSVM_Ch5, color = '#FFC300', linestyle='--', label = 'OCSVM')


axins.plot(t_test1, Ch5_test1, alpha = 0.7)
axins.axvline(onset_anomalies_PCA_GMM_Ch5, color = '#6A0A2F', linestyle='--', label = 'PCA - GMM')
axins.axvline(onset_anomalies_PCA_ZS_Ch5, color = '#6A0A2F', linestyle=':', label = 'PCA - Z-Scores')
axins.axvline(onset_anomalies_Autoencoder_GMM_Ch5, color = '#FF5733', linestyle='--', label = 'Autoencoder - GMM')
axins.axvline(onset_anomalies_Autoencoder_ZS_Ch5, color = '#FF5733', linestyle=':', label = 'Autoencoder - Z-Scores')
axins.axvline(onset_anomalies_OCSVM_Ch5, color = '#FFC300', linestyle='--', label = 'OCSVM')


x1, x2, y1, y2 = 17895, 18100, -1, 1
axins.set_xlim(x1, x2)
axins.set_ylim(y1, y2)


mark_inset(ax, axins, loc1=1, loc2=2, fc="none", ec="0.5")
axins.annotate('OCSVM', xy=(17990, 0.4), xytext=(17900, 0.7),
            arrowprops=dict(arrowstyle="-|>", connectionstyle="angle3,angleA=90,angleB=0")
            )
axins.annotate('Aut.-GMM', xy=(17990, -0.3), xytext=(17900, 0.1),
            arrowprops=dict(arrowstyle="-|>", connectionstyle="angle3,angleA=90,angleB=0")
            )
axins.annotate('Aut.-Z-Scores', xy=(17990, -0.9), xytext=(17900,-0.5),
            arrowprops=dict(arrowstyle="-|>", connectionstyle="angle3,angleA=90,angleB=0")
            )


axins.annotate('PCA-GMM', xy=(18025, 0.4), xytext=(18035, 0.7),
            arrowprops=dict(arrowstyle="-|>", connectionstyle="angle3,angleA=90,angleB=0")
            )
axins.annotate('PCA-Z-Scores', xy=(18025, -0.3), xytext=(18035, 0.1),
            arrowprops=dict(arrowstyle="-|>", connectionstyle="angle3,angleA=90,angleB=0")
            )


ax.set_xlabel('Time (min)')
ax.set_ylabel('Amplitude')
ax.set_title('Ch5 - test1')
#ax.axes.xaxis.set_ticks([])


axins.set_xlabel('Time (min)')
axins.set_ylabel('Amplitude')
#axins.axes.xaxis.set_ticks([])


ax.legend()
fig, ax = plt.subplots()
axins = inset_axes(ax, 2, 2 , loc=1, bbox_to_anchor=(1.5, 0.35), bbox_transform=ax.figure.transFigure)


ax.plot(t_test1, Ch6_test1, alpha = 0.7)
ax.axvline(onset_anomalies_PCA_GMM_Ch6, color = '#6A0A2F', linestyle='--', label = 'PCA - GMM')
ax.axvline(onset_anomalies_PCA_ZS_Ch6, color = '#6A0A2F', linestyle=':', label = 'PCA - Z-Scores')
ax.axvline(onset_anomalies_Autoencoder_GMM_Ch6, color = '#FF5733', linestyle='--', label = 'Autoencoder - GMM')
ax.axvline(onset_anomalies_Autoencoder_ZS_Ch6, color = '#FF5733', linestyle=':', label = 'Autoencoder - Z-Scores')
ax.axvline(onset_anomalies_OCSVM_Ch6, color = '#FFC300', linestyle='--', label = 'OCSVM')


axins.plot(t_test1, Ch6_test1, alpha = 0.7)
axins.axvline(onset_anomalies_PCA_GMM_Ch6, color = '#6A0A2F', linestyle='--', label = 'PCA - GMM')
axins.axvline(onset_anomalies_PCA_ZS_Ch6, color = '#6A0A2F', linestyle=':', label = 'PCA - Z-Scores')
axins.axvline(onset_anomalies_Autoencoder_GMM_Ch6, color = '#FF5733', linestyle='--', label = 'Autoencoder - GMM')
axins.axvline(onset_anomalies_Autoencoder_ZS_Ch6, color = '#FF5733', linestyle=':', label = 'Autoencoder - Z-Scores')
axins.axvline(onset_anomalies_OCSVM_Ch6, color = '#FFC300', linestyle='--', label = 'OCSVM')


x1, x2, y1, y2 = 18000, 18100, -1, 1
axins.set_xlim(x1, x2)
axins.set_ylim(y1, y2)


mark_inset(ax, axins, loc1=1, loc2=2, fc="none", ec="0.5")
axins.annotate('Aut.-GMM', xy=(18035, 0.2), xytext=(18045, 0.7),
            arrowprops=dict(arrowstyle="-|>", connectionstyle="angle3,angleA=90,angleB=0")
            )
axins.annotate('Aut.-Z-Scores', xy=(18035, -0.7), xytext=(18045,-0.2),
            arrowprops=dict(arrowstyle="-|>", connectionstyle="angle3,angleA=90,angleB=0")
            )


ax.set_xlabel('Time (min)')
ax.set_ylabel('Amplitude')
ax.set_title('Ch6 - test1')


axins.set_xlabel('Time (min)')
axins.set_ylabel('Amplitude')


ax.legend()
fig, ax = plt.subplots()
axins = inset_axes(ax, 2, 2 , loc=1, bbox_to_anchor=(1.5, 0.35), bbox_transform=ax.figure.transFigure)


ax.plot(t_test1, Ch5_test1, alpha = 0.7)
ax.axvline(onset_anomalies_PCA_GMM_Ch5, color = '#6A0A2F', linestyle='--', label = 'PCA - GMM')
ax.axvline(onset_anomalies_PCA_ZS_Ch5, color = '#6A0A2F', linestyle=':', label = 'PCA - Z-Scores')
ax.axvline(onset_anomalies_Autoencoder_GMM_Ch5, color = '#FF5733', linestyle='--', label = 'Autoencoder - GMM')
ax.axvline(onset_anomalies_Autoencoder_ZS_Ch5, color = '#FF5733', linestyle=':', label = 'Autoencoder - Z-Scores')
ax.axvline(onset_anomalies_OCSVM_Ch5, color = '#FFC300', linestyle='--', label = 'OCSVM')


axins.plot(t_test1, Ch5_test1, alpha = 0.7)
axins.axvline(onset_anomalies_PCA_GMM_Ch5, color = '#6A0A2F', linestyle='--', label = 'PCA - GMM')
axins.axvline(onset_anomalies_PCA_ZS_Ch5, color = '#6A0A2F', linestyle=':', label = 'PCA - Z-Scores')
axins.axvline(onset_anomalies_Autoencoder_GMM_Ch5, color = '#FF5733', linestyle='--', label = 'Autoencoder - GMM')
axins.axvline(onset_anomalies_Autoencoder_ZS_Ch5, color = '#FF5733', linestyle=':', label = 'Autoencoder - Z-Scores')
axins.axvline(onset_anomalies_OCSVM_Ch5, color = '#FFC300', linestyle='--', label = 'OCSVM')


x1, x2, y1, y2 = 17895, 18100, -1, 1
axins.set_xlim(x1, x2)
axins.set_ylim(y1, y2)


mark_inset(ax, axins, loc1=1, loc2=2, fc="none", ec="0.5")
axins.annotate('OCSVM', xy=(17990, 0.4), xytext=(17900, 0.7),
            arrowprops=dict(arrowstyle="-|>", connectionstyle="angle3,angleA=90,angleB=0")
            )
axins.annotate('Aut.-GMM', xy=(17990, -0.3), xytext=(17900, 0.1),
            arrowprops=dict(arrowstyle="-|>", connectionstyle="angle3,angleA=90,angleB=0")
            )
axins.annotate('Aut.-Z-Scores', xy=(17990, -0.9), xytext=(17900,-0.5),
            arrowprops=dict(arrowstyle="-|>", connectionstyle="angle3,angleA=90,angleB=0")
            )


axins.annotate('PCA-GMM', xy=(18025, 0.4), xytext=(18035, 0.7),
            arrowprops=dict(arrowstyle="-|>", connectionstyle="angle3,angleA=90,angleB=0")
            )
axins.annotate('PCA-Z-Scores', xy=(18025, -0.3), xytext=(18035, 0.1),
            arrowprops=dict(arrowstyle="-|>", connectionstyle="angle3,angleA=90,angleB=0")
            )


ax.set_xlabel('Time (min)')
ax.set_ylabel('Amplitude')
ax.set_title('Ch5 - test1')
#ax.axes.xaxis.set_ticks([])


axins.set_xlabel('Time (min)')
axins.set_ylabel('Amplitude')
#axins.axes.xaxis.set_ticks([])

知乎学术咨询:
https://www.zhihu.com/consult/people/792359672131756032?isMe=1
ax.legend()
擅长领域:现代信号处理,机器学习,深度学习,数字孪生,时间序列分析,设备缺陷检测、设备异常检测、设备智能故障诊断与健康管理PHM等。