可解释机器学习之SHAP方法

news2025/1/22 12:53:18

以Breast cancer wisconsin (diagnostic) dataset数据集为例。

# Built-in libraries
import math
import numpy    as np
import pandas   as pd


# Visualization libraries
import matplotlib.pyplot as plt
import seaborn           as sns


# Sklearn libraries
#
from sklearn                 import metrics
from sklearn                 import preprocessing
from sklearn.model_selection import train_test_split
from sklearn.datasets        import load_breast_cancer

Parameters

test_size = 0.1

Breast cancer wisconsin (diagnostic) dataset

Data Set Characteristics:

:Number of Instances: 569

:Number of Attributes: 30 numeric, predictive attributes and the class

:Attribute Information:
    - radius (mean of distances from center to points on the perimeter)
    - texture (standard deviation of gray-scale values)
    - perimeter
    - area
    - smoothness (local variation in radius lengths)
    - compactness (perimeter^2 / area - 1.0)
    - concavity (severity of concave portions of the contour)
    - concave points (number of concave portions of the contour)
    - symmetry 
    - fractal dimension ("coastline approximation" - 1)

    The mean, standard error, and "worst" or largest (mean of the three
    largest values) of these features were computed for each image,
    resulting in 30 features.  For instance, field 3 is Mean Radius, field
    13 is Radius SE, field 23 is Worst Radius.

    - class:
            - WDBC-Malignant
            - WDBC-Benign

:Summary Statistics:

:Missing Attribute Values: None

:Class Distribution: 212 - Malignant, 357 - Benign
# Load Breast Cancer dataset
data = load_breast_cancer() 


# Create DataFrame
#
df   = pd.DataFrame(data.data, columns=data.feature_names)
# Add a target column
#
df['class'] = data.target


# Show DataFrame
df.head(3)

#Pre-processing data
fig = plt.figure(figsize=(8
,3
))ax  = sns.countplot(df['class'], order = df['class'].value_counts().index)


#Create annotate
for i in ax.patches:
    ax.text(x        = i.get_x() + i.get_width()/2, 
            y        = i.get_height()/7, 
            s        = f"{np.round(i.get_height()/len(df)*100)}%", 
            ha       = 'center', 
            size     = 15, 
            weight   = 'bold', 
            rotation = 90, 
            color    = 'white');


plt.title("Class variable", size=12, weight='bold');

Training/Testing sets

X = df.iloc[:,:-1]
Y = df.iloc[:, -1]
trainX, testX, trainY, testY = train_test_split(X, Y, test_size=test_size, random_state=42)

Model development

Setup ML model

from sklearn.ensemble import GradientBoostingClassifier


# XGBoost model
#
model = GradientBoostingClassifier( random_state  = 42 )

Training ML model

model.fit(trainX, trainY);

Get Predictions

# Calculate prediction
#
pred = model.predict( testX )


# Performance accuracy
#
accuracy = metrics.accuracy_score(testY, pred)
print("Accuracy: %.2f%%" % (accuracy * 100.0))
Accuracy: 96.49%

SHAP

%%capture
! pip install shap

import shap
# Generate the Tree explainer and SHAP values
explainer = shap.TreeExplainer(model)
shap_values = explainer.shap_values(X)
expected_value = explainer.expected_value

Explainability/Visualizations

Summary dot plot

# Generate summary dot plot
#
shap.summary_plot(shap_values   = shap_values, 
                  features      = X, 
                  feature_names = df.columns[:-1], 
                  title         = 'SHAP summary plot')

Summary bar plot

# Generate summary bar plot 
#
shap.summary_plot(shap_values   = shap_values, 
                  features      = X, 
                  feature_names = df.columns[:-1], 
                  plot_type     = "bar")

Dependence plot

# Generate dependence plot
#
shap.dependence_plot(ind               = "worst concave points", 
                     shap_values       = shap_values, 
                     features          = X, 
                     feature_names     = df.columns[:-1],
                     interaction_index = "mean concave points")

Multiple dependence plots

# Generate multiple dependence plots
for name in df.columns[:-1]:
     shap.dependence_plot(ind               = name, 
                          shap_values       = shap_values, 
                          features          = X, 
                          feature_names     = df.columns[:-1],)

工学博士,担任《Mechanical System and Signal Processing》《中国电机工程学报》《控制与决策》等期刊审稿专家,擅长领域:现代信号处理,机器学习,深度学习,数字孪生,时间序列分析,设备缺陷检测、设备异常检测、设备智能故障诊断与健康管理PHM等。

本文来自互联网用户投稿,该文观点仅代表作者本人,不代表本站立场。本站仅提供信息存储空间服务,不拥有所有权,不承担相关法律责任。如若转载,请注明出处:http://www.coloradmin.cn/o/1837565.html

如若内容造成侵权/违法违规/事实不符,请联系多彩编程网进行投诉反馈,一经查实,立即删除!

相关文章

项目估算

1.项目估算的基本内容 2.基本估算方法 3.WBS估算法 4.资源估算的基本过程 5.由工作量和开发周期来估算 6.资源特征描述 7.项目角色职能确定 8.工期估算方法 9.成本估算方法 10.LOC估算法 LOC(Lines of Code,代码行数)估算法是一种简单且直接…

Gracia:打造超逼真VR体验,引领体积视频新时代

在数字化浪潮中,虚拟现实(VR)技术以其独特的沉浸式体验,逐渐成为科技前沿的热点。而在这个领域中,Gracia正以其创新的体积视频技术,为用户带来前所未有的真实感VR体验,致力于成为“空间计算领域的YouTube”。 Gracia,一个充满活力的初创公司,已经获得了120万美元的种…

【记录44】【案例】echarts地图

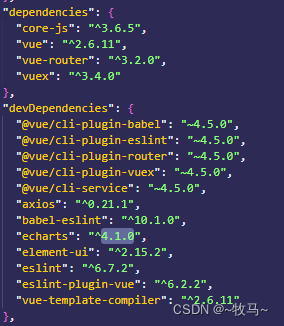
效果&#xff1a;直接上效果图 环境&#xff1a;vue、echarts4.1.0 源码 // 创建容器 <template><div id"center"></div> </template>//设置容器大小&#xff0c;#center { width: 100%; height: 60vh; }这里需注意&#xff1a;笔者在echar…

音频基础知识和音频指标

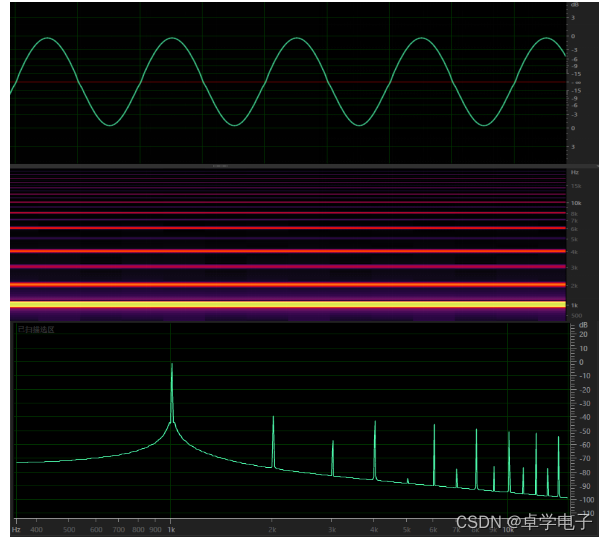
音频基础知识 声音 声音&#xff08;sound)是由物体振动产生的声波。物体在一秒钟之内振动的次数叫做频率&#xff0c;单位是赫兹&#xff0c;字母Hz。人耳可以识别的声音频率在 20 Hz~20000 Hz之间&#xff1b; 声音三要素&#xff1a; 响度 响度&#xff0c;…

谷歌Google广告开户是怎么收费的?

谷歌Google广告无疑是企业拓展全球视野、精准触达目标客户的强大引擎。而作为这一旅程的启航站&#xff0c;开户流程的便捷性与成本效益成为了众多企业关注的焦点。云衔科技&#xff0c;作为数字化营销解决方案与SaaS软件服务的领军者&#xff0c;正以其专业、高效的服务体系&a…

【凤凰房产-注册安全分析报告-缺少轨迹的滑动条】

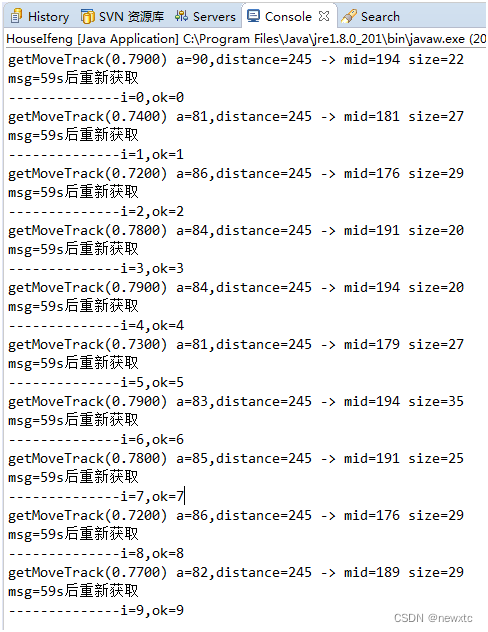
前言 由于网站注册入口容易被黑客攻击&#xff0c;存在如下安全问题&#xff1a; 1. 暴力破解密码&#xff0c;造成用户信息泄露 2. 短信盗刷的安全问题&#xff0c;影响业务及导致用户投诉 3. 带来经济损失&#xff0c;尤其是后付费客户&#xff0c;风险巨大&#xff0c;造…

Eureka 学习笔记(1)

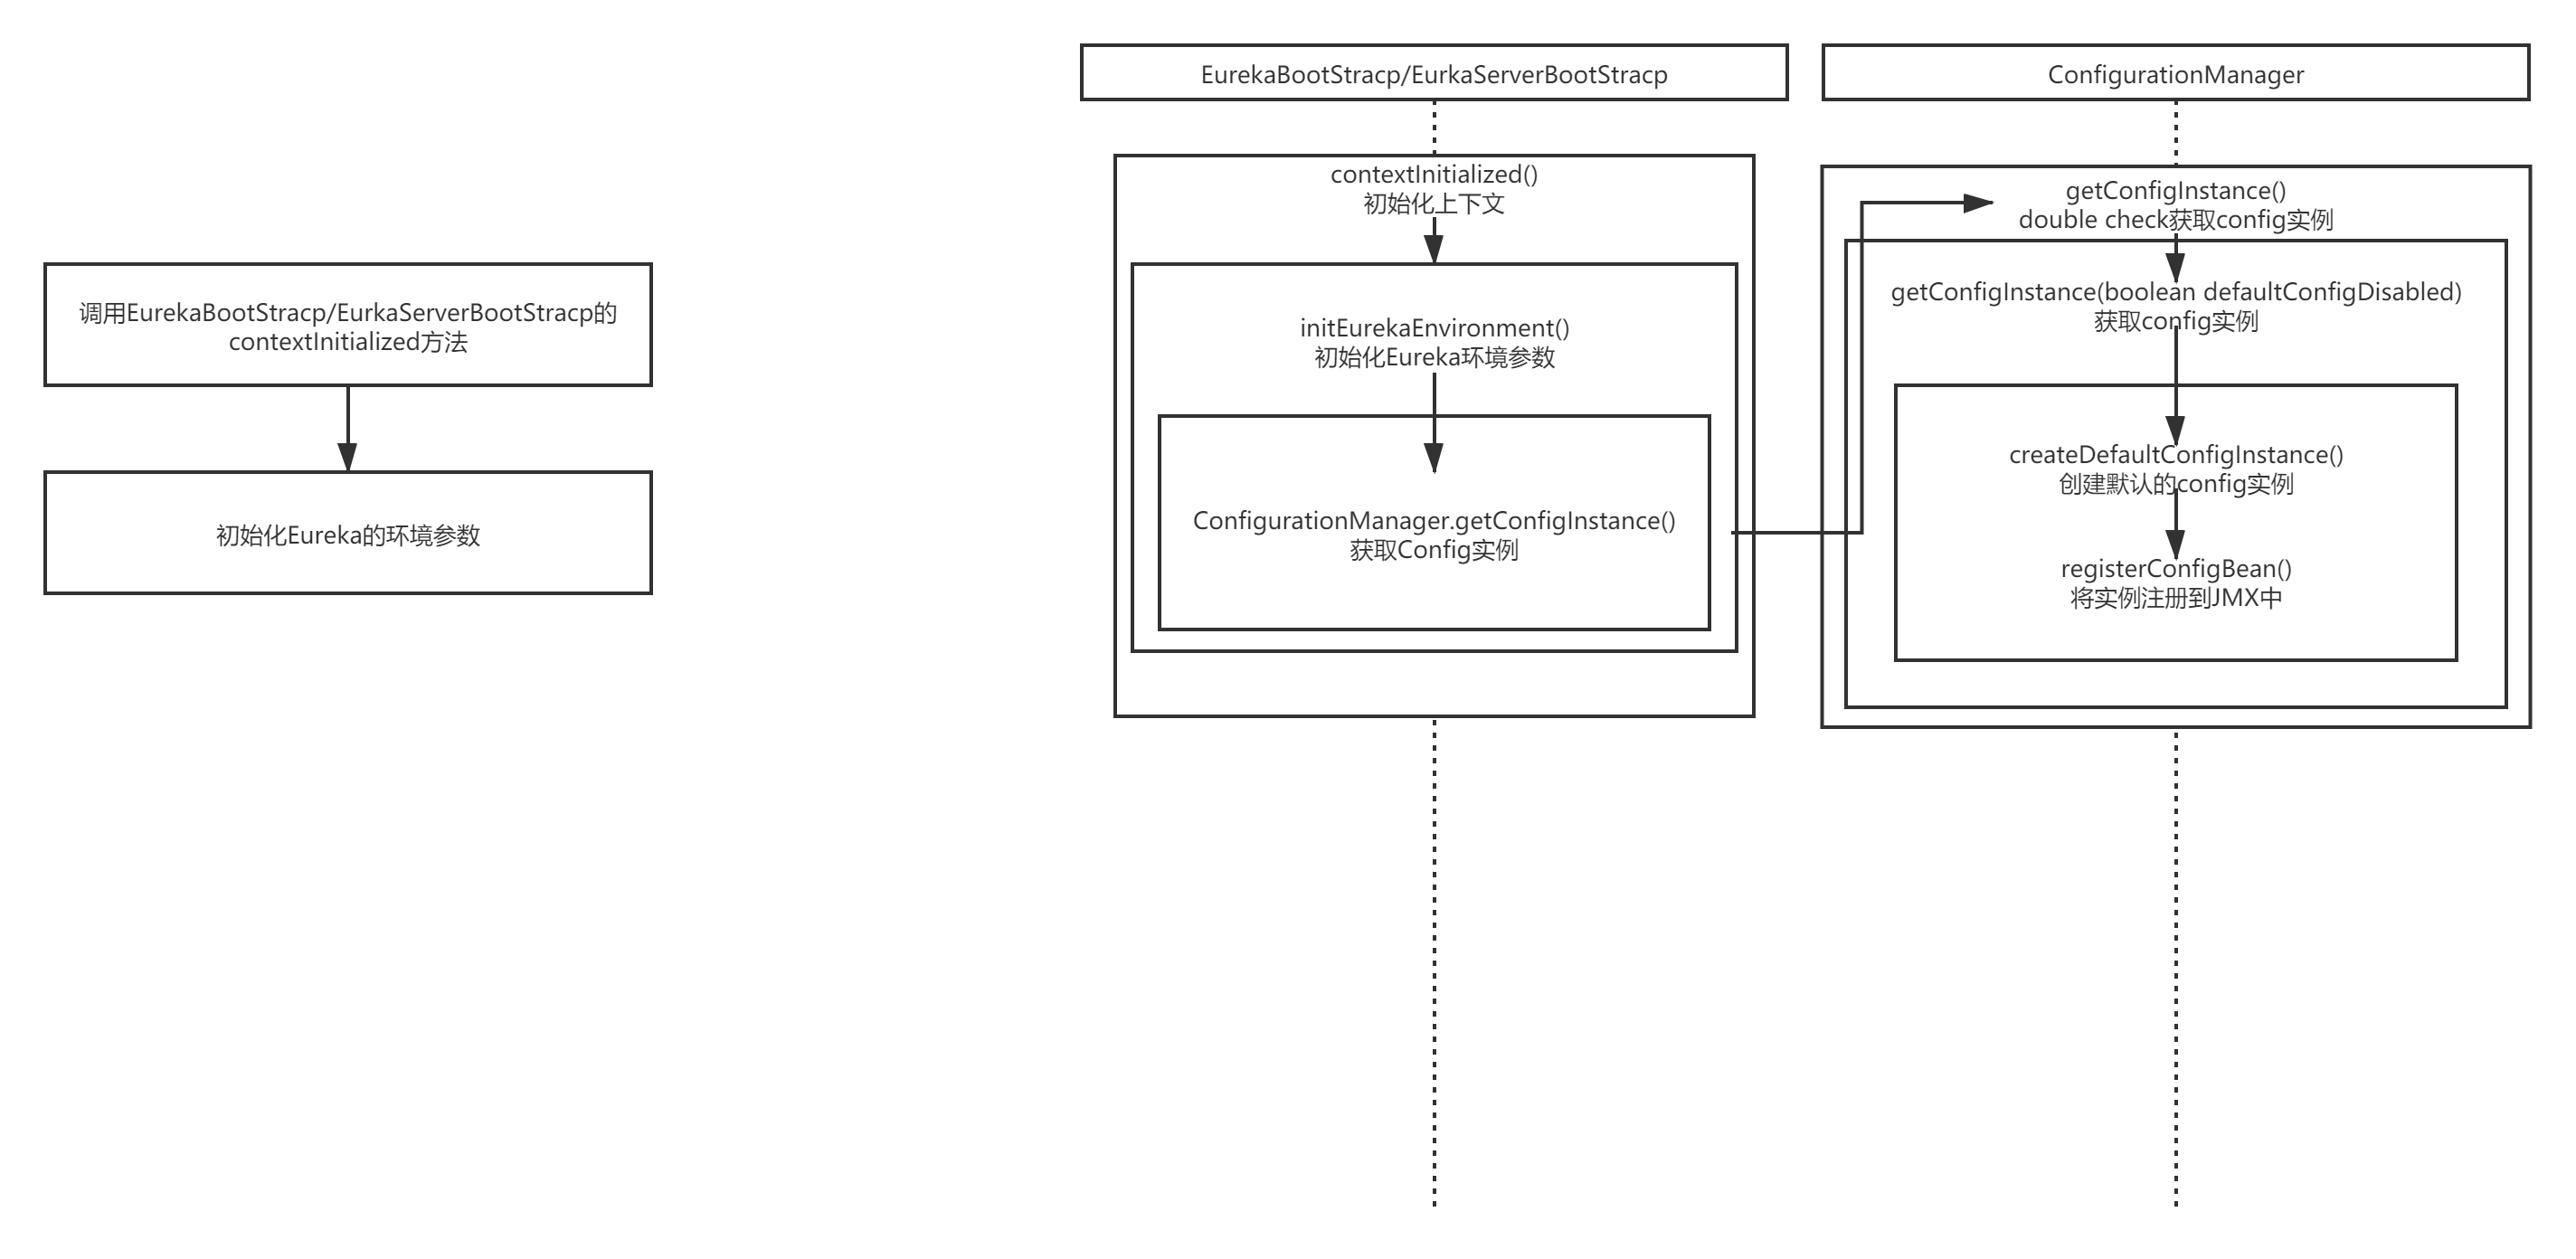
一 、contextInitialized() eureka-core里面&#xff0c;监听器的执行初始化的方法&#xff0c;是contextInitialized()方法&#xff0c;这个方法就是整个eureka-server启动初始化的一个入口。 Overridepublic void contextInitialized(ServletContextEvent event) {try {init…

Win32:第一个窗口程序-注册窗口类(Part.2)

在part 1中我们阐述了窗口模板程序中的相关宏、全局函数和相关函数声明后我们Part2就来说一下part 1中声明的一个函数MyRegisterClass注册窗口类函数&#xff08;函数中也使用到了定义的一些全局变量&#xff09;&#xff0c;为什么要注册窗口类在part 1中已经阐述过了&#xf…

本地快速部署 SuperSonic

本地快速部署 SuperSonic 0. 引言1. 本地快速部署 supersonic2. 访问 supersonic3. 支持的数据库4. github 地址 0. 引言 SuperSonic融合Chat BI&#xff08;powered by LLM&#xff09;和Headless BI&#xff08;powered by 语义层&#xff09;打造新一代的BI平台。这种融合确…

Python 数据可视化 散点图

Python 数据可视化 散点图 import matplotlib.pyplot as plt import numpy as npdef plot_scatter(ref_info_dict, test_info_dict):# 绘制散点图&#xff0c;ref横&#xff0c;test纵plt.figure(figsize(80, 48))n 0# scatter_header_list [peak_insert_size, median_insert…

如何实现埋点日志精准监控

作者 | 张小七 导读 日志中台承载了百度千亿量级PV的埋点流量&#xff0c;如何对这些流量进行准确监控&#xff0c;并支持个性化字段的抽取、下钻&#xff0c;是日志中台的一大难题。本文简单介绍了日志中台的基本概念及实时流架构&#xff0c;并基于此深入讲解了低成本实现可扩…

【调试笔记-20240618-Windows- Tauri 调试中关闭自动重构的功能】

调试笔记-系列文章目录 调试笔记-20240618-Windows- Tauri 调试中关闭自动重构的功能 文章目录 调试笔记-系列文章目录调试笔记-20240618-Windows- Tauri 调试中关闭自动重构的功能 前言一、调试环境操作系统&#xff1a;Windows 10 专业版调试环境调试目标 二、调试步骤搜索相…

【CSS in Depth2精译】1.1.2 行内样式~1.1.3 选择器的优先级

文章目录 1.1.2 行内样式1.1.3 选择器的优先级1.1.3.1 优先级的写法1.1.3.2 关于优先级的思考 1.1.2 行内样式 如果无法通过样式表来源规则解决样式冲突&#xff0c;浏览器则会考察它们是否通过 行内样式 作用于该元素。当使用 HTML 的 style 属性声明样式时&#xff0c;该样式…

kaggle notebook和jupyter notebook读取csv

kaggle本地比赛用打开notebook的示例代码可以获取当前比赛的文件数据路径&#xff0c;进而后续直接复制读取 jupyter notebook读取csv 直接下载数据集到电脑上&#xff0c;并用本地路径读取就行。

ElasticSearch学习篇13_《检索技术核心20讲》进阶篇之LSM树

背景 学习极客实践课程《检索技术核心20讲》https://time.geekbang.org/column/article/215243&#xff0c;文档形式记录笔记。 内容 磁盘和内存数据读取特点 工业界中数据量往往很庞大&#xff0c;比如数据无法全部加载进内存&#xff0c;无法支持索引的高效实时更新&…

QT day04

一、思维导图 二、登录界面优化 代码&#xff1a; 界面&#xff1a; *{background-color: rgb(255, 255, 255); }QFrame#frame{border-image: url(:/Logo/shanChuan.jpg);border-radius:15px; }#frame_2{background-color: rgba(110, 110, 110, 120);border-radius:15px; }Q…

ionic 项目通过 android studio 打开报错 capacitor.settings.gradle 文件不存在

问题出现 原因分析 在程序相应的目录上面&#xff0c;没有找到对应的配置文件&#xff0c;但是这个文件不是我们自己生成的&#xff0c;而是通过 ionic 编译之后生成。 处理方案 先执行 ionic build&#xff0c;将 ionic 项目打包出来然后执行 npx cap sync 再使用 Android…

【小白专用 已验证24.6.18】C# SqlSugar操作MySQL数据库实现增删改查

【小白专用24.6.18】C# SqlSugar&#xff1a;连接数据库实现简单的&#xff0c;增、删、改、查-CSDN博客 SqlSugar .Net ORM 5.X 官网 、文档、教程 - SqlSugar 5x - .NET果糖网 SqlSugar项目创建 通过NuGet包管理器搜索SqlSugar&#xff08;MySql还要安装MySql.Data、Newton…

C++ | Leetcode C++题解之第165题比较版本号

题目&#xff1a; 题解&#xff1a; class Solution { public:int compareVersion(string version1, string version2) {int n version1.length(), m version2.length();int i 0, j 0;while (i < n || j < m) {long long x 0;for (; i < n && version1[…

HTML+CSS+PHP实现网页留言板功能(需要创建数据库)

话说前头&#xff0c;我这方面很菜滴。这是我网页作业的一部分。 1.body部分效果展示&#xff08;不包括footer&#xff09; 2、代码 2.1 leaving.php&#xff08;看到的网页&#xff09; <!DOCTYPE html> <html lang"en"> <head> <met…