文章目录
- 1. 导入模块
- 2. 导入数据
- 3.探索式数据分析方法(EDA)
- 3.1 数据相关性探索
- 3.2 是否会下雨
- 3.3 地理位置与下雨的关系
- 3.4 湿度和压力对下雨的影响
- 3.5 气温对下雨的影响
- 4.数据预处理
- 4.1 处理缺损值
- 4.2 构建数据集
- 5 预测是否会下雨
- 5.1 构建神经网络
- 5.2 模型训练
- 5.3 结果可视化
- 🍨 本文为🔗365天深度学习训练营 中的学习记录博客
- 🍖 原作者:K同学啊 | 接辅导、项目定制
本次学习引入了探索式数据分析(EDA),可用于分析数据表内各数据之间的关系
本次学习使用的数据集:来自澳大利亚许多地点的大约10年的每日天气观测数据。
本次学习的任务:根据提供的数据,对明天是否下雨(RainTomorrow)进行预测。
语言环境:Python 3.12
编译器:VSCode
深度学习框架:Tensorflow 2.11.0
1. 导入模块
print("*****************# 1. 导入模块************************")
# 1. 导入模块
import numpy as np
import pandas as pd
import seaborn as sns
import matplotlib.pyplot as plt
import warnings

warnings.filterwarnings('ignore')

import tensorflow as tf
from sklearn.model_selection import train_test_split
from sklearn.preprocessing import MinMaxScaler
from keras.models import Sequential
from keras.layers import Dense, Activation, Dropout
from keras.callbacks import EarlyStopping
from sklearn.metrics import classification_report, confusion_matrix
from sklearn.metrics import r2_score
from sklearn.metrics import mean_absolute_error, mean_absolute_percentage_error, mean_squared_error
print("*****************# 1. 导入模块  End************************")
2. 导入数据
# 2. 导入数据
print("*****************# 2. 导入数据************************")
data = pd.read_csv("D:\\jupyter notebook\\DL-100-days\\RNN\\weatherAUS.csv")
df = data.copy()
print("data.head():\n", data.head())

print("data.describe():\n", data.describe())

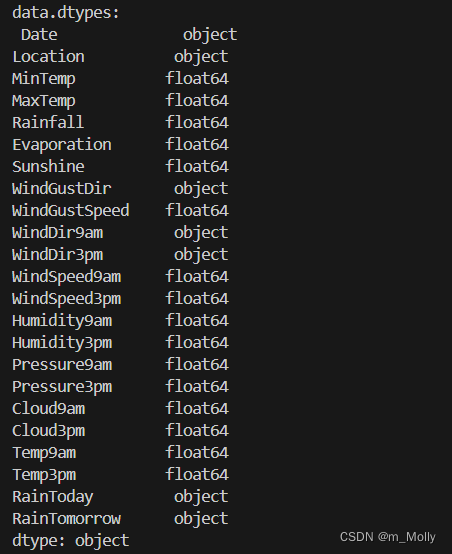
print("data.dtypes:\n", data.dtypes)
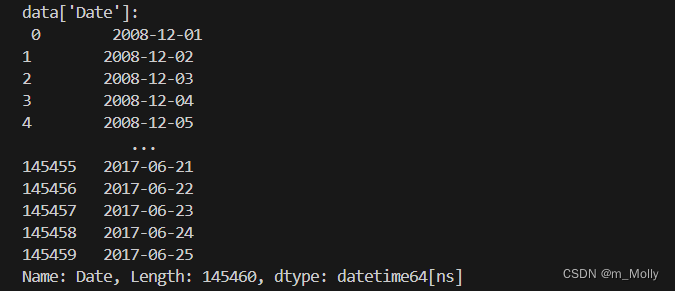
data['Date'] = pd.to_datetime(data['Date'])
print("data['Date']:\n", data['Date'])
data['year'] = data['Date'].dt.year
data['Month'] = data['Date'].dt.month
data['day'] = data['Date'].dt.day
print("data.head():\n", data.head())

data.drop('Date', axis=1, inplace=True)
print("data.columns:\n", data.columns)
print("*****************# 2. 导入数据 End************************")

3.探索式数据分析方法(EDA)
探索性数据分析(Exploratory Data Analysis,简称EDA),是指对已有的数据(特别是调查或观察得来的原始数据)在尽量少的先验假定下进行探索,通过作图、制表、方程拟合、计算特征量等手段探索数据的结构和规律了解数据集,了解变量间的相互关系以及变量与预测值之间的关系的一种数据分析方法。
【探索式数据分析方法(EDA)】
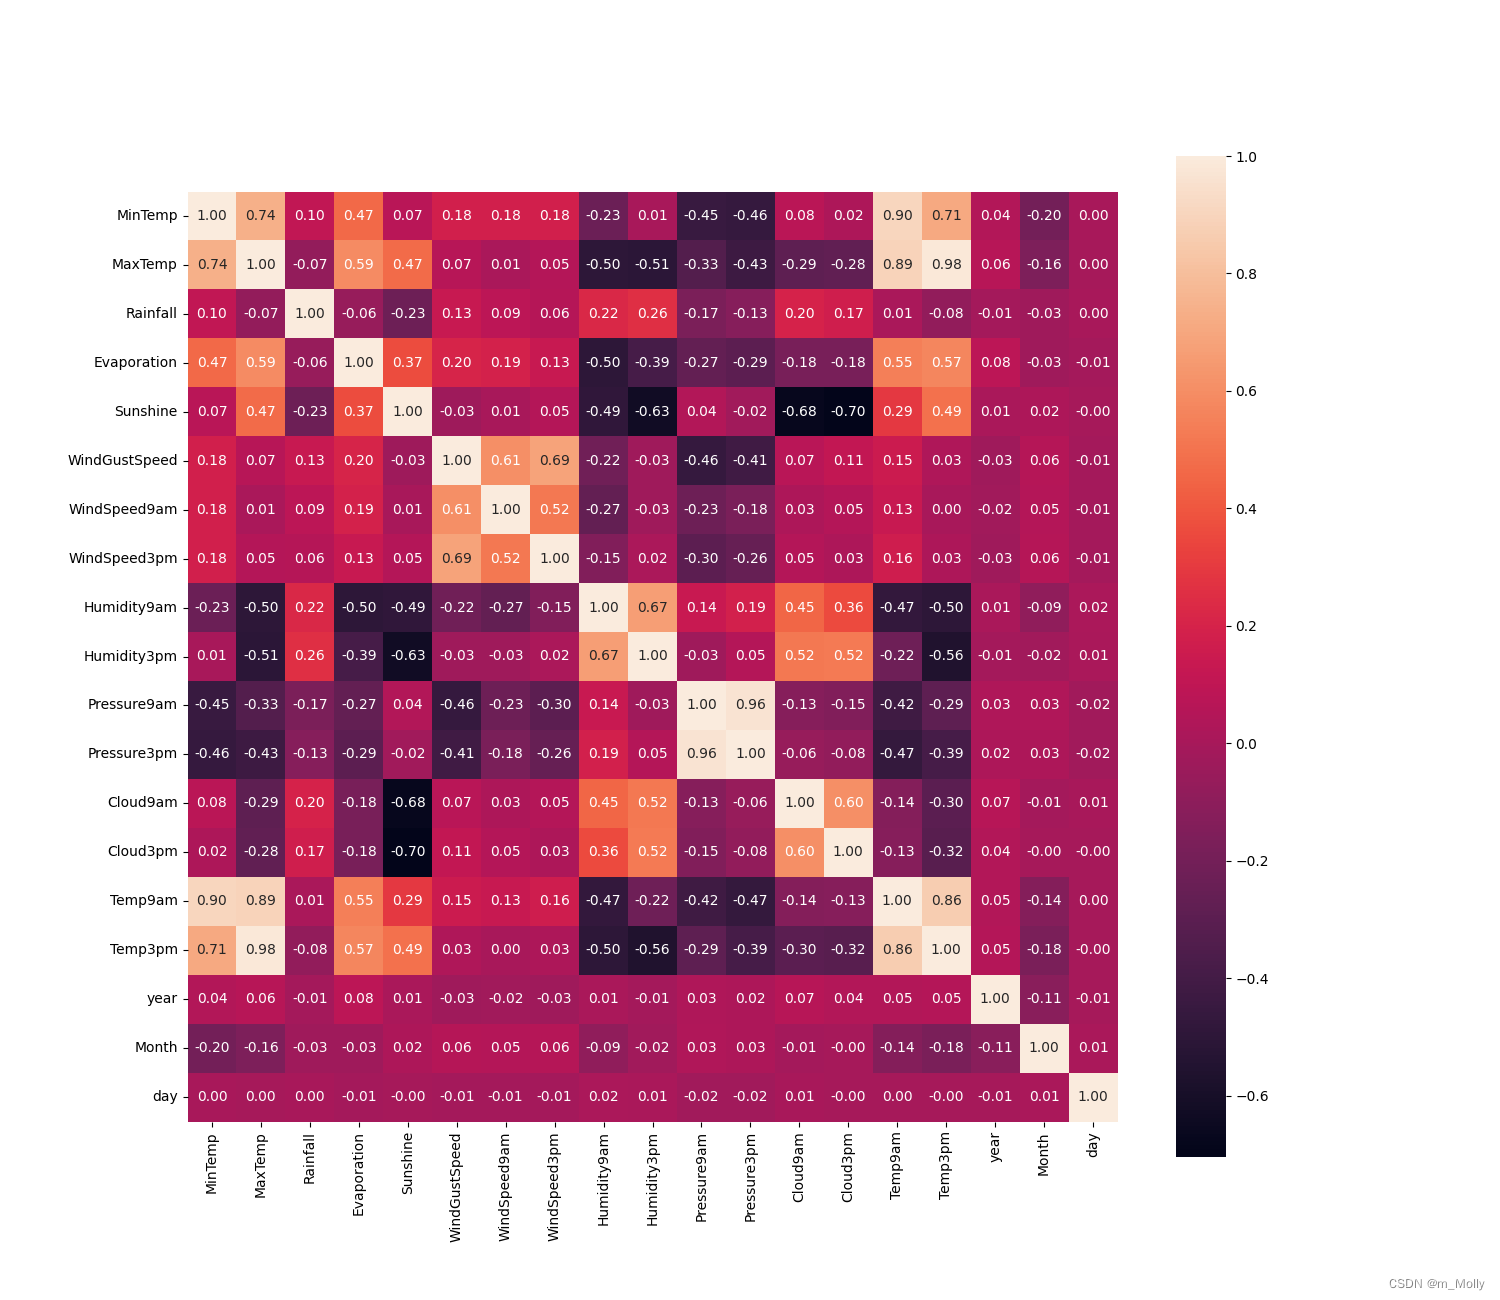
3.1 数据相关性探索
print("*****************3.探索式数据分析方法(EDA)************************")
# 3.探索式数据分析方法(EDA)
# 3.1 数据相关性探索
plt.figure(figsize=(15,13))
# data.corr()表示了data中的两个变量之间的相关性
ax = sns.heatmap(data.corr(),square=True, annot=True, fmt='.2f')
ax.set_xticklabels(ax.get_xticklabels(), rotation=90)
plt.savefig("3.1 数据相关性探索热力图.png")
plt.show()
3.2 是否会下雨
# 3.2 是否会下雨
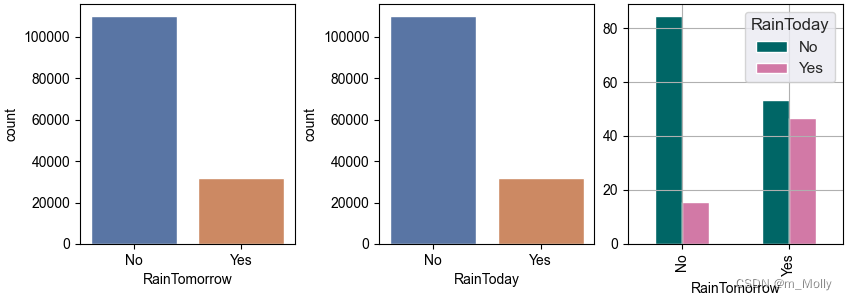
fig,ax = plt.subplots(1,3,constrained_layout = True , figsize = (14,3))
sns.set_theme(style="darkgrid")
#plt.figure(figsize=(4,3))
sns.countplot(x='RainTomorrow', data=data, ax=ax[0])
#plt.savefig("3.2 明天是否会下雨.png")

#plt.figure(figsize=(4,3))
sns.countplot(x='RainToday', data=data, ax=ax[1])
#plt.savefig("3.2 今天是否会下雨.png")

x = pd.crosstab(data['RainTomorrow'], data['RainToday'])
print("x: \n", x)
# 计算百分比
y = x/x.transpose().sum().values.reshape(2,1)*100
print("y: \n", y)

y.plot(kind="bar", figsize=(4,3), color=['#006666','#d279a6'], ax=ax[2])
plt.savefig("3.2 是否会下雨.png")

(左)明天是否下雨
(中)今天是否下雨
(右)今天是否下雨 & 明天是否下雨 的关系
3.3 地理位置与下雨的关系
plt.figure(figsize=(15,20))
# 3.3 地理位置与下雨的关系
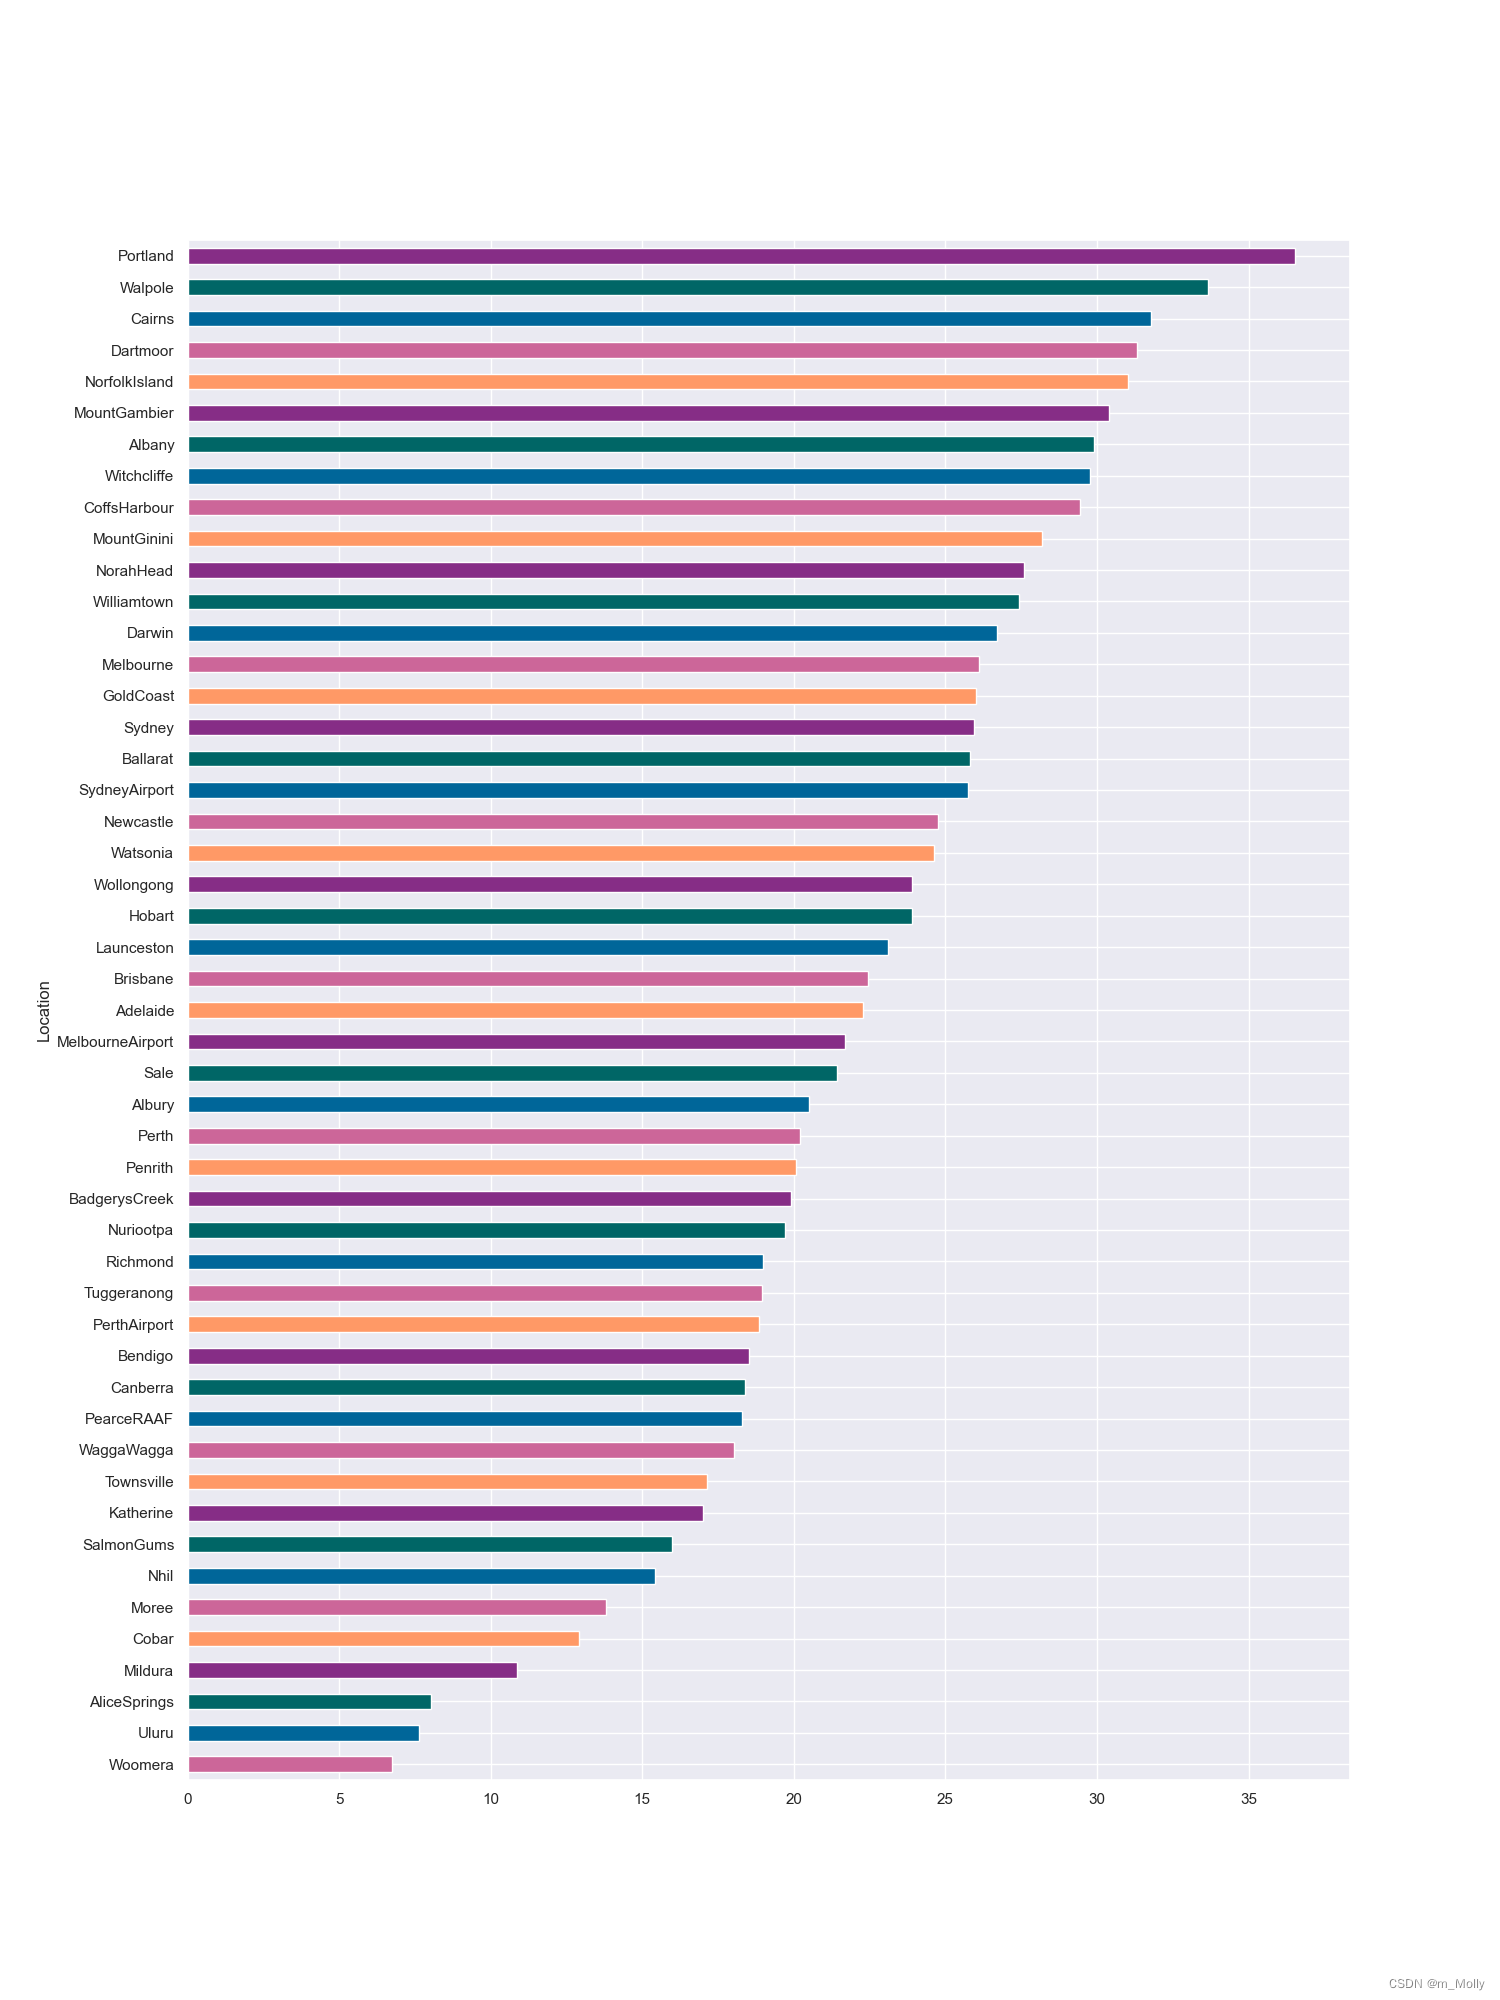
x = pd.crosstab(data['Location'], data['RainToday'])
# 获取每个城市下雨天数和非下雨天数的百分比
y = x/x.transpose().sum().values.reshape((-1,1))*100
# 按每个城市雨天的百分比排序
y = y.sort_values(by='Yes', ascending=True)
color = ['#cc6699', '#006699', '#006666', '#862d86', '#ff9966']
y.Yes.plot(kind="bath", figsize=(15,20), color=color)
plt.savefig("3.3 地理位置与下雨的关系.png")
3.4 湿度和压力对下雨的影响
# 3.4 湿度和压力对下雨的影响
data.columns
# 绘制明天早上9点到下午3点的气压下是否下雨的散点图
fig,ax = plt.subplots(1,2,constrained_layout = True , figsize = (20,6))
#plt.figure(figsize=(8,6))
sns.scatterplot(data=data, x='Pressure9am', y='Pressure3pm',hue='RainTomorrow', ax=ax[0])
#plt.savefig("3.4 压力对下雨的影响.png")
# 绘制明天早上9点到下午3点的湿度下是否下雨的散点图
#plt.figure(figsize=(8,6))
sns.scatterplot(data=data, x='Humidity9am', y='Humidity3pm',hue='RainTomorrow', ax=ax[1])
plt.savefig("3.4 压力、湿度对下雨的影响.png")
输出:(左)压力对下雨的影响 (右)湿度对下雨的影响

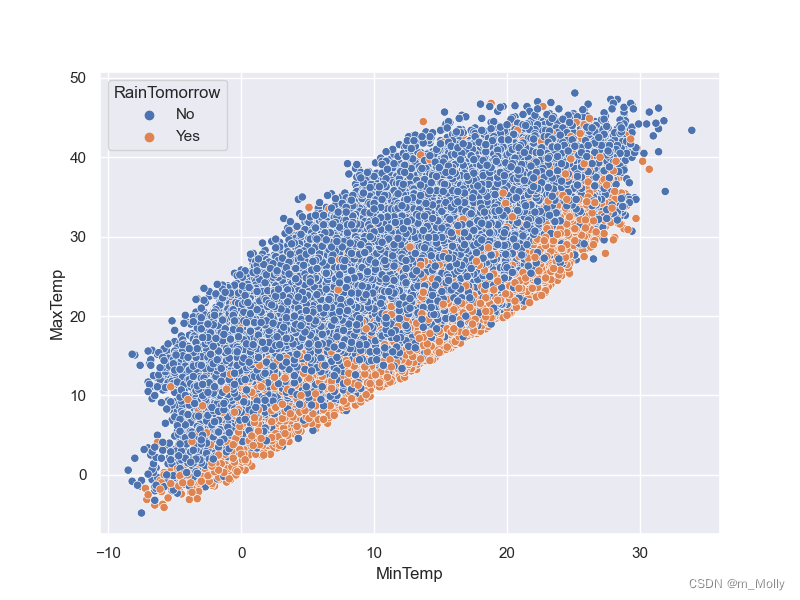
3.5 气温对下雨的影响
# 3.5 气温对下雨的影响
plt.figure(figsize=(8,6))
sns.scatterplot(data=data, x='MinTemp', y='MaxTemp',hue='RainTomorrow')
plt.savefig("3.5 气温对下雨的影响.png")
print("*****************3.探索式数据分析方法(EDA)  End************************")
4.数据预处理
4.1 处理缺损值
print("*****************# 4.数据预处理************************")
# 4.数据预处理
# 4.1 处理缺损值
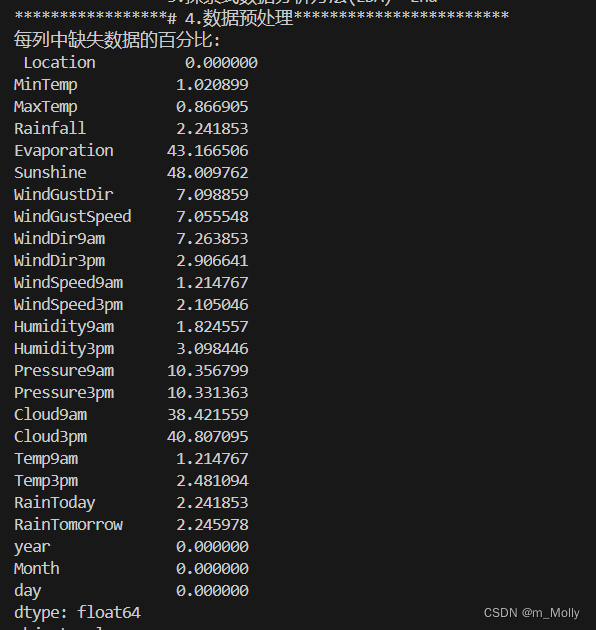
# 每列中缺失数据的百分比
print("每列中缺失数据的百分比: \n", data.isnull().sum()/data.shape[0]*100)
# 在该列中随机选择数进行填充
lst = ['Evaporation', 'Sunshine', 'Cloud9am', 'Cloud3pm']
for col in lst:
    fill_list = data[col].dropna()
    data[col] = data[col].fillna(pd.Series(np.random.choice(fill_list, size=len(data.index))))
s = (data.dtypes == "object")
object_cols = list(s[s].index)
print("object_cols: \n", object_cols)

# inplace=True: 直接修改原对象,不创建副本
# data[i].mode()[0]: 返回频率出现最高的选项,众数
for i in object_cols:
    data[i].fillna(data[i].mode()[0], inplace=True)
t = (data.dtypes == "float64")
num_cols = list(t[t].index)
print("num_cols: \n", num_cols)

# .median(): 中位数
for i in num_cols:
    data[i].fillna(data[i].median(), inplace=True)
data.isnull().sum()
4.2 构建数据集
LabelEncoder 是 sklearn.preprocessing 模块中的一个工具,用于将分类特征的标签转换为整数。
# 4.2 构建数据集
from sklearn.preprocessing import LabelEncoder
label_encoder = LabelEncoder()
for i in object_cols:
    data[i] = label_encoder.fit_transform(data[i])
x = data.drop(['RainTomorrow', 'day'], axis=1).values
y = data['RainTomorrow'].values
x_train, x_test, y_train, y_test = train_test_split(x, y, test_size=0.25, random_state=101)
scaler = MinMaxScaler()
scaler.fit(x_train)
x_train = scaler.transform(x_train)
x_test = scaler.transform(x_test)
print("*****************# 4.数据预处理  End************************")
报错:

原因:LabelEncoder是sklearn的模块,不是keras的。

5 预测是否会下雨
5.1 构建神经网络
print("*****************# 5 预测是否会下雨************************")
# 5 预测是否会下雨
# 5.1 构建神经网络
from keras.optimizers import Adam
model = Sequential()
model.add(Dense(units=24, activation='tanh',))
model.add(Dense(units=18, activation='tanh'))
model.add(Dense(units=23, activation='tanh'))
model.add(Dropout(0.2))
model.add(Dense(units=12, activation='tanh'))
model.add(Dropout(0.2))
model.add(Dense(units=1, activation='tanh'))
optimizer = tf.keras.optimizers.Adam(learning_rate=1e-4)
model.compile(loss='binary_crossentropy',
              optimizer=optimizer,
              metrics="accuracy")
early_stop = EarlyStopping(monitor='val_loss',
                           mode='min',
                           min_delta=0.001,
                           verbose=1,
                           patience=25,
                           restore_best_weights=True)
5.2 模型训练
# 5.2 模型训练
model.fit(x=x_train,
          y=y_train,
          validation_data=(x_test, y_test),
          verbose=1,
          callbacks=[early_stop],
          epochs=10,
          batch_size=32)

5.3 结果可视化
# 5.3 结果可视化
acc = model.history.history['accuracy']
val_acc = model.history.history['val_accuracy']
loss = model.history.history['loss']
val_loss = model.history.history['val_loss']
epochs_range = range(10)

plt.figure(figsize=(14,4))

plt.subplot(1,2,1)
plt.plot(epochs_range, acc, label="Training Accuracy")
plt.plot(epochs_range, val_acc, label="Validation Accuracy")
plt.legend(loc="lower right")
plt.title("Training and Validation Accuracy")

plt.subplot(1,2,2)
plt.plot(epochs_range, loss, label="Training Loss")
plt.plot(epochs_range, val_loss, label="Validation Loss")
plt.legend(loc="lower right")
plt.title("Training and Validation Loss")
plt.savefig("# 5.3 结果可视化.png")
plt.show()
print("*****************# 5 预测是否会下雨  End************************")

