目录
- 02 Deviation
- 2.0 Prerequisite
- 2.1 发散型条形图(Diverging Bars)
- 2.2 发散型文本(Diverging Texts)
- 2.3 Diverging Dot Plot
- 2.4 Diverging Lollipop Chart with Markers
- 2.5 面积图(Area Chart)
- References

02 Deviation
2.0 Prerequisite
-
Setup.py
# !pip install brewer2mpl
import numpy as np
import pandas as pd
import matplotlib as mpl
import matplotlib.pyplot as plt
import seaborn as sns
import warnings; warnings.filterwarnings(action='once')

large = 22; med = 16; small = 12
params = {'axes.titlesize': large,
          'legend.fontsize': med,
          'figure.figsize': (16, 10),
          'axes.labelsize': med,
          'axes.titlesize': med,
          'xtick.labelsize': med,
          'ytick.labelsize': med,
          'figure.titlesize': large}
plt.rcParams.update(params)
# plt.style.use('seaborn-whitegrid')
plt.style.use("seaborn-v0_8")
sns.set_style("white")
# %matplotlib inline

# Version
print(mpl.__version__)  #> 3.7.1
print(sns.__version__)  #> 0.12.2
2.1 发散型条形图(Diverging Bars)
-
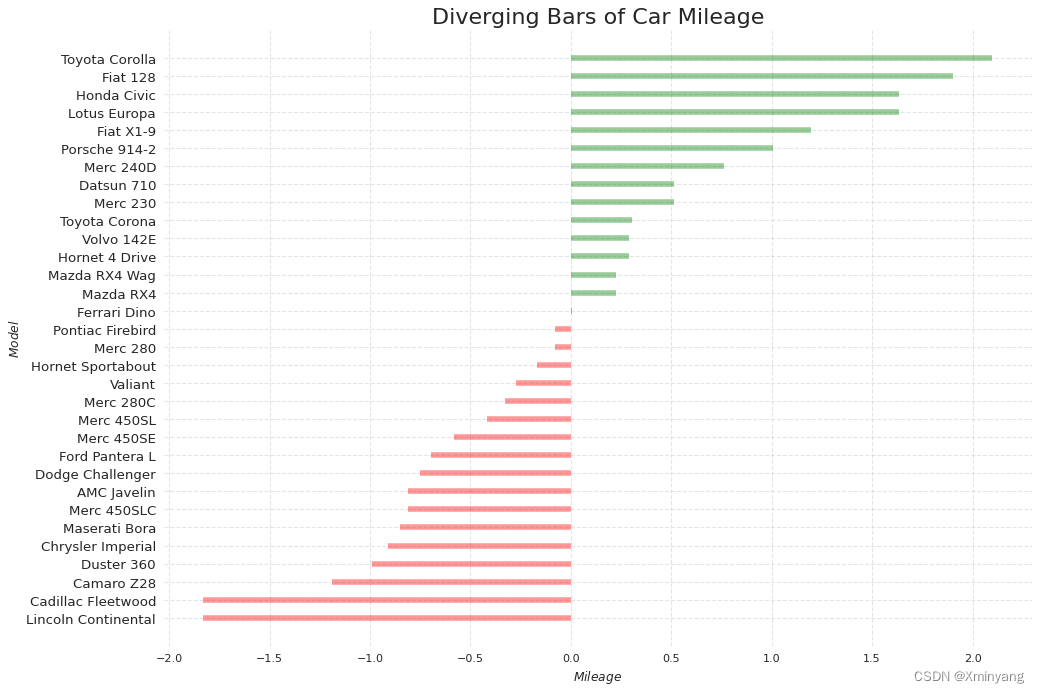
If you want to see how the items are varying based on a single metric and visualize the order and amount of this variance, the diverging bars is a great tool. It helps to quickly differentiate the performance of groups in your data and is quite intuitive and instantly conveys the point.
-
mtcars.csv描述了汽车燃油效率的发散型点图,其数据如下所示:
"mpg","cyl","disp","hp","drat","wt","qsec","vs","am","gear","carb","fast","cars","carname"
4.58257569495584,6,160,110,3.9,2.62,16.46,0,1,4,4,1,"Mazda RX4","Mazda RX4"
4.58257569495584,6,160,110,3.9,2.875,17.02,0,1,4,4,1,"Mazda RX4 Wag","Mazda RX4 Wag"
4.77493455452533,4,108,93,3.85,2.32,18.61,1,1,4,1,1,"Datsun 710","Datsun 710"
4.62601340248815,6,258,110,3.08,3.215,19.44,1,0,3,1,1,"Hornet 4 Drive","Hornet 4 Drive"
4.32434966208793,8,360,175,3.15,3.44,17.02,0,0,3,2,1,"Hornet Sportabout","Hornet Sportabout"
4.25440947723653,6,225,105,2.76,3.46,20.22,1,0,3,1,1,"Valiant","Valiant"
3.78153408023781,8,360,245,3.21,3.57,15.84,0,0,3,4,0,"Duster 360","Duster 360"
4.93963561409139,4,146.7,62,3.69,3.19,20,1,0,4,2,1,"Merc 240D","Merc 240D"
4.77493455452533,4,140.8,95,3.92,3.15,22.9,1,0,4,2,1,"Merc 230","Merc 230"
4.38178046004133,6,167.6,123,3.92,3.44,18.3,1,0,4,4,1,"Merc 280","Merc 280"
4.2190046219458,6,167.6,123,3.92,3.44,18.9,1,0,4,4,1,"Merc 280C","Merc 280C"
4.04969134626332,8,275.8,180,3.07,4.07,17.4,0,0,3,3,1,"Merc 450SE","Merc 450SE"
4.15932686861708,8,275.8,180,3.07,3.73,17.6,0,0,3,3,1,"Merc 450SL","Merc 450SL"
3.89871773792359,8,275.8,180,3.07,3.78,18,0,0,3,3,0,"Merc 450SLC","Merc 450SLC"
3.22490309931942,8,472,205,2.93,5.25,17.98,0,0,3,4,0,"Cadillac Fleetwood","Cadillac Fleetwood"
3.22490309931942,8,460,215,3,5.424,17.82,0,0,3,4,0,"Lincoln Continental","Lincoln Continental"
3.83405790253616,8,440,230,3.23,5.345,17.42,0,0,3,4,0,"Chrysler Imperial","Chrysler Imperial"
5.69209978830308,4,78.7,66,4.08,2.2,19.47,1,1,4,1,1,"Fiat 128","Fiat 128"
5.51361950083609,4,75.7,52,4.93,1.615,18.52,1,1,4,2,1,"Honda Civic","Honda Civic"
5.82237065120385,4,71.1,65,4.22,1.835,19.9,1,1,4,1,1,"Toyota Corolla","Toyota Corolla"
4.63680924774785,4,120.1,97,3.7,2.465,20.01,1,0,3,1,1,"Toyota Corona","Toyota Corona"
3.93700393700591,8,318,150,2.76,3.52,16.87,0,0,3,2,0,"Dodge Challenger","Dodge Challenger"
3.89871773792359,8,304,150,3.15,3.435,17.3,0,0,3,2,0,"AMC Javelin","AMC Javelin"
3.64691650576209,8,350,245,3.73,3.84,15.41,0,0,3,4,0,"Camaro Z28","Camaro Z28"
4.38178046004133,8,400,175,3.08,3.845,17.05,0,0,3,2,1,"Pontiac Firebird","Pontiac Firebird"
5.22494019104525,4,79,66,4.08,1.935,18.9,1,1,4,1,1,"Fiat X1-9","Fiat X1-9"
5.09901951359278,4,120.3,91,4.43,2.14,16.7,0,1,5,2,1,"Porsche 914-2","Porsche 914-2"
5.51361950083609,4,95.1,113,3.77,1.513,16.9,1,1,5,2,1,"Lotus Europa","Lotus Europa"
3.97492138287036,8,351,264,4.22,3.17,14.5,0,1,5,4,0,"Ford Pantera L","Ford Pantera L"
4.43846820423443,6,145,175,3.62,2.77,15.5,0,1,5,6,1,"Ferrari Dino","Ferrari Dino"
3.87298334620742,8,301,335,3.54,3.57,14.6,0,1,5,8,0,"Maserati Bora","Maserati Bora"
4.62601340248815,4,121,109,4.11,2.78,18.6,1,1,4,2,1,"Volvo 142E","Volvo 142E"
- 程序代码为:
# Prepare Data
# 使用pd.read_csv函数从给定的URL加载数据集并将其存储在名为df的DataFrame中
df = pd.read_csv("https://github.com/selva86/datasets/raw/master/mtcars.csv")
print(df)
# 从df中选择mpg列作为x轴数据
x = df.loc[:, ['mpg']]
# 计算mpg列的标准化值mpg_z:通过减去平均值并除以标准差,将mpg列的值标准化为标准正态分布。
df['mpg_z'] = (x - x.mean())/x.std()
# 根据mpg_z列的值,为每个数据点设置颜色。如果mpg_z值小于0,则颜色为红色;否则,颜色为绿色。这将用于在条形图中显示正值和负值。
df['colors'] = ['red' if x < 0 else 'green' for x in df['mpg_z']]
# 根据mpg_z列对DataFrame进行排序,以便在绘制条形图时能够按顺序显示数据点。
df.sort_values('mpg_z', inplace=True)
df.reset_index(inplace=True)

# Draw plot
# 创建一个图形窗口,设置图形的大小为14x10英寸,分辨率为80 dpi
plt.figure(figsize=(14,10), dpi= 80)
# 使用plt.hlines函数绘制水平线条形图。其中,y轴的位置由DataFrame的索引确定,x轴的范围由mpg_z列的值确定,颜色由colors列的值确定。此外,设置透明度为0.4,线宽为5。
plt.hlines(y=df.index, xmin=0, xmax=df.mpg_z, color=df.colors, alpha=0.4, linewidth=5)

# Decorations 对图形进行装饰
# 使用plt.gca().set函数设置y轴标签为"Model",x轴标签为"Mileage"。
plt.gca().set(ylabel='$Model$', xlabel='$Mileage$')
# 使用plt.yticks函数设置y轴刻度的位置和标签为DataFrame的索引和cars列的值,并设置字体大小为12。
plt.yticks(df.index, df.cars, fontsize=12)
# 使用plt.title函数设置图表的标题为"Diverging Bars of Car Mileage",设置标题的字体大小为20。
plt.title('Diverging Bars of Car Mileage', fontdict={'size':20})
# 使用plt.grid函数绘制带有虚线样式和透明度0.5的网格。
plt.grid(linestyle='--', alpha=0.5)
# 使用plt.show函数显示绘制的图形
plt.show()
- 运行结果为:
2.2 发散型文本(Diverging Texts)
-
Diverging texts is similar to diverging bars and it preferred if you want to show the value of each items within the chart in a nice and presentable way.
-
发散型文本与发散型条形图类似,但它更适合以漂亮和整齐的方式显示图表中每个项目的值。发散型文本图表可以用于在图表中显示每个数据项的值。与发散型条形图不同,发散型文本图表不是使用条形来表示值的大小,而是直接在图表上显示文本。
通过在图表上显示文本,可以更清楚地呈现每个项目的值,使其更易于阅读和理解。这对于需要在图表中突出显示每个数据项的值的情况非常有用,尤其是在需要对比正值和负值的情况下。
发散型文本图表可以通过在每个数据点旁边显示数值文本来实现。这可以通过在代码中添加适当的文本标注函数来完成,例如使用plt.text函数。使用发散型文本图表可以使每个数据项的值更加显眼和易于理解,从而提供更好的数据可视化效果。 -
程序代码为:
# Prepare Data
df = pd.read_csv("https://github.com/selva86/datasets/raw/master/mtcars.csv")
x = df.loc[:, ['mpg']]
df['mpg_z'] = (x - x.mean())/x.std()
df['colors'] = ['red' if x < 0 else 'green' for x in df['mpg_z']]
df.sort_values('mpg_z', inplace=True)
df.reset_index(inplace=True)

# Draw plot
plt.figure(figsize=(14,14), dpi= 80)
# 使用plt.hlines方法绘制发散型图表的竖线,其中y参数为数据点的索引,xmin和xmax参数分别为发散线的起始点和结束点。
plt.hlines(y=df.index, xmin=0, xmax=df.mpg_z)
# 使用循环遍历每个数据点,使用plt.text方法在图表上绘制文本。x参数为mpg_z的值,y参数为数据点的索引,tex参数为要显示的文本内容,这里取mpg_z的值并保留两位小数。根据x的正负值,通过horizontalalignment参数设置文本的水平对齐方式为右对齐(如果x为负)或左对齐(如果x为正),verticalalignment参数设置文本的垂直对齐方式为居中。同时,根据x的正负值,使用fontdict参数设置文本的颜色为红色(如果x为负)或绿色(如果x为正),字体大小为14。
for x, y, tex in zip(df.mpg_z, df.index, df.mpg_z):
    t = plt.text(x, y, round(tex, 2), horizontalalignment='right' if x < 0 else 'left',
                 verticalalignment='center', fontdict={'color':'red' if x < 0 else 'green', 'size':14})

# Decorations
plt.yticks(df.index, df.cars, fontsize=12)
plt.title('Diverging Text Bars of Car Mileage', fontdict={'size':20})
plt.grid(linestyle='--', alpha=0.5)
plt.xlim(-2.5, 2.5)
plt.show()
- 运行结果为:

2.3 Diverging Dot Plot
-
Divering dot plot is also similar to the diverging bars. However compared to diverging bars, the absence of bars reduces the amount of contrast and disparity between the groups.
-
发散型点图与发散型条形图类似。然而,与发散型条形图相比,发散型点图中没有条形,这减少了组之间的对比和差异。
在发散型点图中,数据点由一系列点表示,这些点沿着一个水平线或垂直线排列。通常,数据点的位置表示变量的值,例如,较小的值可能位于线的一侧,较大的值可能位于线的另一侧。发散型点图的目的是通过数据点的位置和颜色来显示不同组之间的差异。
与发散型条形图相比,发散型点图的视觉对比度和差异较小,因为点的形状和大小相对较小。然而,发散型点图仍然可以提供组之间的相对位置和差异的视觉表示。它可以用于显示两个或多个组的变量之间的差异,并帮助观察者比较组之间的相对位置和分布。
发散型点图可以是水平的或垂直的,具体取决于数据的特点和绘图的需求。它通常用于探索性数据分析和比较不同组的变量。 -
程序代码为:
# Prepare Data
df = pd.read_csv("https://github.com/selva86/datasets/raw/master/mtcars.csv")
x = df.loc[:, ['mpg']]
df['mpg_z'] = (x - x.mean())/x.std()
df['colors'] = ['red' if x < 0 else 'darkgreen' for x in df['mpg_z']]
df.sort_values('mpg_z', inplace=True)
df.reset_index(inplace=True)

# Draw plot
plt.figure(figsize=(14,16), dpi= 80) # 创建图形窗口
plt.scatter(df.mpg_z, df.index, s=450, alpha=.6, color=df.colors) # 绘制散点图
# 在这个循环中,我们使用zip函数将df.mpg_z、df.index和df.mpg_z这三个列表的对应元素打包成一个元组序列。这样,每次循环迭代时,x变量将获得df.mpg_z中的元素,y变量将获得df.index中的元素,tex变量将获得df.mpg_z中的元素。
# 在循环的每次迭代中,我们使用plt.text函数在图形上添加文本标签。该函数的参数包括:
# x:标签的x坐标,即df.mpg_z中的元素。
# y:标签的y坐标,即df.index中的元素。
# round(tex, 1):标签的文本内容,即df.mpg_z中的元素经过四舍五入保留一位小数后的值。
# horizontalalignment='center':水平对齐方式,这里设置为居中对齐。
# verticalalignment='center':垂直对齐方式,这里设置为居中对齐。
# fontdict={'color':'white'}:文本的字体风格,这里设置为白色。
for x, y, tex in zip(df.mpg_z, df.index, df.mpg_z):
    t = plt.text(x, y, round(tex, 1), horizontalalignment='center',
                 verticalalignment='center', fontdict={'color':'white'})

# Decorations # 装饰图形
# Lighten borders # 加亮边框
plt.gca().spines["top"].set_alpha(.3)
plt.gca().spines["bottom"].set_alpha(.3)
plt.gca().spines["right"].set_alpha(.3)
plt.gca().spines["left"].set_alpha(.3)

plt.yticks(df.index, df.cars) # 设置y轴刻度标签
plt.title('Diverging Dotplot of Car Mileage', fontdict={'size':20})
plt.xlabel('$Mileage$')
plt.grid(linestyle='--', alpha=0.5)
plt.xlim(-2.5, 2.5)
plt.show()
- 运行结果为:

2.4 Diverging Lollipop Chart with Markers
-
Lollipop with markers provides a flexible way of visualizing the divergence by laying emphasis on any significant datapoints you want to bring attention to and give reasoning within the chart appropriately.
-
带有标记的发散型棒棒糖图表提供了一种灵活的方式来可视化数据的发散情况,突出显示您想要关注的任何重要数据点,并在图表中适当地解释原因。
在这种图表中,使用棒棒糖形式的线段表示每个数据点,线段的长度表示数据的数值大小。同时,在每个数据点上添加标记(通常是圆点或其他形状),以突出显示该数据点的重要性或特殊性。
这种图表的优点是可以同时显示数据的发散方向和重要数据点的位置。通过调整标记的形状、大小、颜色等视觉属性,可以进一步强调关注的数据点。
通过使用带有标记的发散型棒棒糖图表,可以直观地传达数据的发散情况,并突出显示重要的数据点,以便在图表内部进行适当的解释和推理。 -
程序代码为:
# Prepare Data
df = pd.read_csv("https://github.com/selva86/datasets/raw/master/mtcars.csv")
x = df.loc[:, ['mpg']]
df['mpg_z'] = (x - x.mean())/x.std()
df['colors'] = 'black'

# color fiat differently
# 对于'cars'列中为'Fiat X1-9'的数据点,将其颜色设置为橙色。
df.loc[df.cars == 'Fiat X1-9', 'colors'] = 'darkorange'
df.sort_values('mpg_z', inplace=True)
df.reset_index(inplace=True)


# Draw plot
import matplotlib.patches as patches

plt.figure(figsize=(14,16), dpi= 80)
plt.hlines(y=df.index, xmin=0, xmax=df.mpg_z, color=df.colors, alpha=0.4, linewidth=1)
# 使用plt.scatter函数绘制散点图,x轴为'mpg_z'值,y轴为数据点的索引,颜色为对应的颜色,点的大小根据'cars'列的值确定,如果是'Fiat X1-9',点的大小为600,否则为300,透明度为0.6
plt.scatter(df.mpg_z, df.index, color=df.colors, s=[600 if x == 'Fiat X1-9' else 300 for x in df.cars], alpha=0.6)
plt.yticks(df.index, df.cars)
plt.xticks(fontsize=12)

# Annotate
# 使用plt.annotate函数在图表中添加注释。注释的文本是"Mercedes Models",位置在坐标(0.0, 11.0),注释的箭头指向坐标(1.0, 11),箭头样式为'-[, widthB=2.0, lengthB=1.5',文本框的样式为方形,颜色为'firebrick'。
plt.annotate('Mercedes Models', xy=(0.0, 11.0), xytext=(1.0, 11), xycoords='data',
            fontsize=15, ha='center', va='center',
            bbox=dict(boxstyle='square', fc='firebrick'),
            arrowprops=dict(arrowstyle='-[, widthB=2.0, lengthB=1.5', lw=2.0, color='steelblue'), color='white')

# Add Patches
# 使用patches.Rectangle函数创建两个矩形补丁,并使用plt.gca().add_patch函数将它们添加到图表中。一个矩形位于坐标(-2.0, -1),宽度为0.3,高度为3,颜色为红色;另一个矩形位于坐标(1.5, 27),宽度为0.8,高度为5,颜色为绿色。
p1 = patches.Rectangle((-2.0, -1), width=.3, height=3, alpha=.2, facecolor='red')
p2 = patches.Rectangle((1.5, 27), width=.8, height=5, alpha=.2, facecolor='green')
plt.gca().add_patch(p1)
plt.gca().add_patch(p2)

# Decorate
plt.title('Diverging Bars of Car Mileage', fontdict={'size':20})
plt.grid(linestyle='--', alpha=0.5)
plt.show()
- 运行结果为:

2.5 面积图(Area Chart)
-
By coloring the area between the axis and the lines, the area chart throws more emphasis not just on the peaks and troughs but also the duration of the highs and lows. The longer the duration of the highs, the larger is the area under the line.
-
通过对轴和线之间的区域进行着色,面积图不仅突出显示高峰和低谷,还强调了高峰和低谷的持续时间。高峰持续时间越长,线下的面积就越大。
-
economics.csv经济数据的月度变化部分内容为:
"date","pce","pop","psavert","uempmed","unemploy"
1967-07-01,507.4,198712,12.5,4.5,2944
1967-08-01,510.5,198911,12.5,4.7,2945
1967-09-01,516.3,199113,11.7,4.6,2958
1967-10-01,512.9,199311,12.5,4.9,3143
1967-11-01,518.1,199498,12.5,4.7,3066
1967-12-01,525.8,199657,12.1,4.8,3018
1968-01-01,531.5,199808,11.7,5.1,2878
1968-02-01,534.2,199920,12.2,4.5,3001
1968-03-01,544.9,200056,11.6,4.1,2877
1968-04-01,544.6,200208,12.2,4.6,2709
1968-05-01,550.4,200361,12,4.4,2740
1968-06-01,556.8,200536,11.6,4.4,2938
...
- 程序代码为:
import numpy as np
import pandas as pd

# Prepare Data
# 通过读取CSV文件(从指定的URL中获取)创建了一个DataFrame对象df,并将日期列解析为日期类型。
df = pd.read_csv("https://github.com/selva86/datasets/raw/master/economics.csv", parse_dates=['date']).head(100)
# 使用numpy库的arange函数创建了一个与DataFrame行数相同的数组x,用作横坐标。
x = np.arange(df.shape[0])
# 计算了每个月的储蓄率变化的百分比,并将结果存储在y_returns变量中。这里使用了DataFrame的diff和shift方法来计算每个月的变化值,并进行了一些填充处理。
y_returns = (df.psavert.diff().fillna(0)/df.psavert.shift(1)).fillna(0) * 100

# Plot
# 创建了一个图形窗口,并设置了图形的大小和分辨率。
plt.figure(figsize=(16,10), dpi= 80)
# 使用fill_between函数根据y_returns的正负值,将图形分为两个区域进行填充。当y_returns大于等于0时,使用绿色填充;当y_returns小于等于0时,使用红色填充。
plt.fill_between(x[1:], y_returns[1:], 0, where=y_returns[1:] >= 0, facecolor='green', interpolate=True, alpha=0.7)
plt.fill_between(x[1:], y_returns[1:], 0, where=y_returns[1:] <= 0, facecolor='red', interpolate=True, alpha=0.7)

# Annotate
# 使用annotate函数在图形中添加了一个文本标注,表示1975年的高峰期。设置了标注的位置和样式,包括文本框的样式和箭头的样式。
plt.annotate('Peak \n1975', xy=(94.0, 21.0), xytext=(88.0, 28),
             bbox=dict(boxstyle='square', fc='firebrick'),
             arrowprops=dict(facecolor='steelblue', shrink=0.05), fontsize=15, color='white')


# Decorations
xtickvals = [str(m)[:3].upper()+"-"+str(y) for y,m in zip(df.date.dt.year, df.date.dt.month_name())]
plt.gca().set_xticks(x[::6])
plt.gca().set_xticklabels(xtickvals[::6], rotation=90, fontdict={'horizontalalignment': 'center', 'verticalalignment': 'center_baseline'})
plt.ylim(-35,35)
plt.xlim(1,100)
plt.title("Month Economics Return %", fontsize=22)
plt.ylabel('Monthly returns %')
plt.grid(alpha=0.5)
plt.show()
- 运行结果为:

References
- Top 50 matplotlib Visualizations
- 【Matplotlib作图-1.Correlation】50 Matplotlib Visualizations, Python实现,源码可复现

