前言
我在工作中使用echarts较少,这就导致每次使用时都要从头再来,这让我很头疼。因此我决心编写一系列文章将我参与工作后几次使用echarts所用到的知识记录下来,以便将来可以快速查阅。

一、基本使用
像我一样的新手,想要入门echarts还是建议要从官方文档的快速上手开始。我在这里会记录其中的几个简要的步骤。
1.安装
NPM
npm install echartsCDN
<script src="https://cdn.jsdelivr.net/npm/echarts@5.5.0/dist/echarts.min.js"></script>2.项目中引入
注意最新的版本一定要用这种带有as的方式,某些老的博客文章中可能写的是旧版的引入方式。
import * as echarts from 'echarts';3.绘制图表
使用echarts绘制图表很简单,我把它称为“echarts的三步走战略”:准备容器、获取实例、设置选项。

3.1准备容器
准备容器就是要准备一个element作为放置echarts图表的容器,许多的图表库都有这样的操作。容器元素的作用就是确定图表在我们应用中的位置,以及限制图表的范围,因此容器必须要设置尺寸样式(是谁忘了设置尺寸?哦,原来是我 (*/ω\*) ,那没事了)。
<!-- 记得给容器设置宽高 -->
<div id="main" style="width: 600px;height:400px;"></div>
还有一个需要注意的点是,如果在Vue中使用echarts,有时可能会出现无法获取到dom的情况。想要了解具体的问题情境和解决方法请浏览我的这篇文章:vue3中获取元素DOM的方法
3.2 获取实例
获取实例就是通过echarts.init()工厂方法获取一个echarts实例,init方法接收一个dom(容器dom)返回一个实例。
<template>
  <div ref="container" style="width: 600px; height: 400px"></div>
</template>

<script setup>
import { onMounted, ref } from 'vue'
import * as echarts from 'echarts'

// 容器元素
const container = ref(null)

onMounted(() => {
    // 获取实例
    const chartInstance =  echarts.init(container.value)
})
</script>
3.3 设置选项
最后需要使用echarts实例的setoption方法设置配置项。配置项是echarts的核心,其内容博大精深,想了解更多有关echarts配置项的信息,请查阅echarts配置项手册。
<template>
  <div ref="container" style="width: 600px; height: 400px"></div>
</template>

<script setup>
import { onMounted, ref } from 'vue'
import * as echarts from 'echarts'

// 容器元素
const container = ref(null)

onMounted(() => {
  // 获取实例
  const chartInstance = echarts.init(container.value)
  // 设置选项
  chartInstance.setOption({
    xAxis: {
      type: 'category',
      show: false,
      boundaryGap: false,
    },
    yAxis: {
      show: false,
    },
    series: [
      {
        type: 'line',
        data: [
          620, 432, 220, 534, 790, 430, 220, 320, 532, 320, 834, 690, 530, 220,
          620,
        ],
        areaStyle: {
          color: 'purple',
        },
        lineStyle: {
          width: 0,
        },
        itemStyle: {
          opacity: 0,
        },
        smooth: true,
      },
    ],
    grid: {
      top: 0,
      bottom: 0,
      left: 0,
      right: 0,
    },
  })
})
</script>
最后绘出如下的图表


二、封装echarts组件
大概在一年前我在公司的某个项目中看到了封装的echarts组件,之后我也曾经研究过,但最后都半途而废了。如今我重头再来,希望这次可以成功。
1.为什么要封装echarts组件?
echarts组件的主要作用是对上面所提到的 "三步走战略" 进行一个封装,这样我们就不需要重复去执行这些步骤了。每次绘图时只需要给echarts组件传递配置项即可。
2.echarts组件需要实现的功能
我封装的echarts组件准备实现以下的功能:
| 基础功能 | 优化功能 | 拓展功能 |
|
|
|
3.封装基本功能
再复习一下,使用echarts绘制图表的“三步走战略”是:
- 准备容器
- 获取实例
- 设置选项
<template>
  <div ref="container" style="width: 600px; height: 400px"></div>
</template>

<script setup>
import { onMounted, onUnmounted, ref ,nextTick} from 'vue'
import * as echarts from 'echarts'

// props
const props = defineProps({
  option: {
    type: [Object, null],
    require: true,
  }, //配置项
})

// 容器元素
const container = ref(null)
// 实例
const instance = ref(null)
// 初始化
function init() {
  if (!container.value) return

  //查看容器上是否已经挂载了echarts实例 , 如果已挂载就获取并使用该实例,如果未挂载就进行初始化
  instance.value = echarts.getInstanceByDom(container.value)
  if (!instance.value) {
    instance.value = echarts.init(container.value)
  }
   draw()
}
// 绘制图表
function draw() {
  if (!props.option || !instance.value) return
  instance.value.setOption(props.option)
}

onMounted(() => {
  nextTick(() => {
    init()
  })
})
</script>
考虑容器已被挂载echarts实例的情况
上面的代码中值得注意的一个点是,在初始化的时候考虑了容器可能已被挂载了实例的情况。
为了兼容这种情况就首先使用echarts.getInstanceByDom获取容器上的实例。如果容器已有实例就使用该实例,如果容器上没有实例就进行初始化。
instance.value = echarts.getInstanceByDom(container.value)
if (!instance.value) {
  instance.value = echarts.init(container.value)
}
4.将echats实例代理为响应式对象可能带来的风险
将echarts实例保存为响应式对象,可能会造成一系列意外的问题。因此在这里建议将echarts组件中的实例使用普通变量或者shallowRef、shallowReactive、markRaw等API进行保存。
我是使用了shallowRef来取代原来的ref:
// 实例
const instance = shallowRef(null)
想要了解更多的相关信息,可以浏览我写的这篇文章 将echats实例代理为响应式对象可能带来的风险 。
5.销毁实例
当echarts组件被卸载时,我们应当调用dispose方法销毁实例,以防止可能得内存泄漏。
onUnmounted(()=>{
  instance.value?.dispose()
})
6.图表重绘
我们希望当echarts组件中接收到的一些props(例如option)发生变化时可以重新绘制图表。
我一开始的写法是这样的
function draw() {
  if (!props.option || !instance.value) return
  // 先清空实例
  instance.value && instance.value.clear()
  // 然后再重新绘制
  instance.value.setOption(props.option)
}

watch(props,()=>{
  draw()
})后来发现只需要在调用setOption方法时将其notMerge选项设为true,就会自动的先清空组件然后再根据传入的配置项渲染新的图表。

function draw() {
  if (!props.option || !instance.value) return
  instance.value.setOption(props.option, {
    notMerge: true,
  })
}

watch(props,()=>{
  draw()
})
7.实现图表的自适应
我们希望当页面的尺寸发生变化时,图表的尺寸也会跟着变化。我实现这一功能的基本思路如下图所示:

我使用ResizeObserver监听容器元素的尺寸变化,当容器的尺寸变化时,调用chartInstance.resize方法重置图表尺寸。想了解与图表自适应相关的详细内容,请参考我的文章:图表自适应。
const resizeObserver = shallowRef(null) // 元素尺寸侦听器
const debounceTimer = ref(null) //防抖计时器id

// 重置图表尺寸
function resize() {
  clearTimeout(debounceTimer.value)
  debounceTimer.value = setTimeout(() => {
    instance.value?.resize({
      animation: {
        duration: 300,
      },
    })
    debounceTimer.value = null
  }, 300)
}
resizeObserver.value = new ResizeObserver(resize)

onMounted(() => {
  nextTick(() => {
    resizeObserver.value.observe(container.value)
  })
})

onUnmounted(() => {
  resizeObserver.value?.disconnect()
  resizeObserver.value = null
  clearTimeout(debounceTimer.value)
  debounceTimer.value = null
})
8.图表宽高可设置
我们希望可以在使用echarts组件的时候自定义图表的宽高。想要实现这一功能也很简单,只需要增加两个prop即可。
const props = defineProps({
  width: {
    type: String,
    default: '300px',
  },
  height: {
    type: String,
    default: '200px',
  },
})
<div ref="container" :style="{width: props.width, height: props.height}"></div>9.显示loading动画
很多时候图表数据都是异步的,获取数据需要时间,此时就希望在数据获取的时候给用户展现loading动画效果,以提升用户体验。
以前我都是借助于第三方组件的的loading组件来实现这一功能的(例如Ant Design 的 <a-spin> 或者 Element-ui 的 v-loading)。
现在才知道其实echarts是有自带的loading动画效果的,可以通过实例的showLoading和hideLoading方法控制。现在我们就可以借助这两个方法来实现图表的loading效果:
const props = defineProps({
  loading: {
    type: Boolean,
    default: false,
  },
})

// loading动画
watchEffect(() => {
  props.loading ? instance.value?.showLoading() : instance.value?.hideLoading()
})
让我们来看一下最终的效果:

10.侦听图表的事件
echarts图表有一套自己的事件系统,当我们需要实现一些与图表的交互效果的时候,可能就需要用到这些事件。我们可以在echarts组件中提前封装这些事件以便在将来使用。例如我添加一个图表的点击事件:
const props = defineProps({
  // 省略...
  onClick: {
    type: Function,
  },
})

function init() {
  // 省略...

  addListeningChartEvent()
}

// echarts事件绑定
function addListeningChartEvent() {
  // 点击事件
  props.onClick &&
    instance.value?.on('click','series', (e) => {
      props.onClick(e, instance.value, props.option)
    })
}
11.暴露echarts实例
上面提到了在组件中侦听图表事件,但授人以鱼不如授人以渔,比起琐碎的封装事件,不如直接将echarts实例暴露给使用者。
我们可以参考Vue官方文档了解如何从组件中暴露属性和方法:
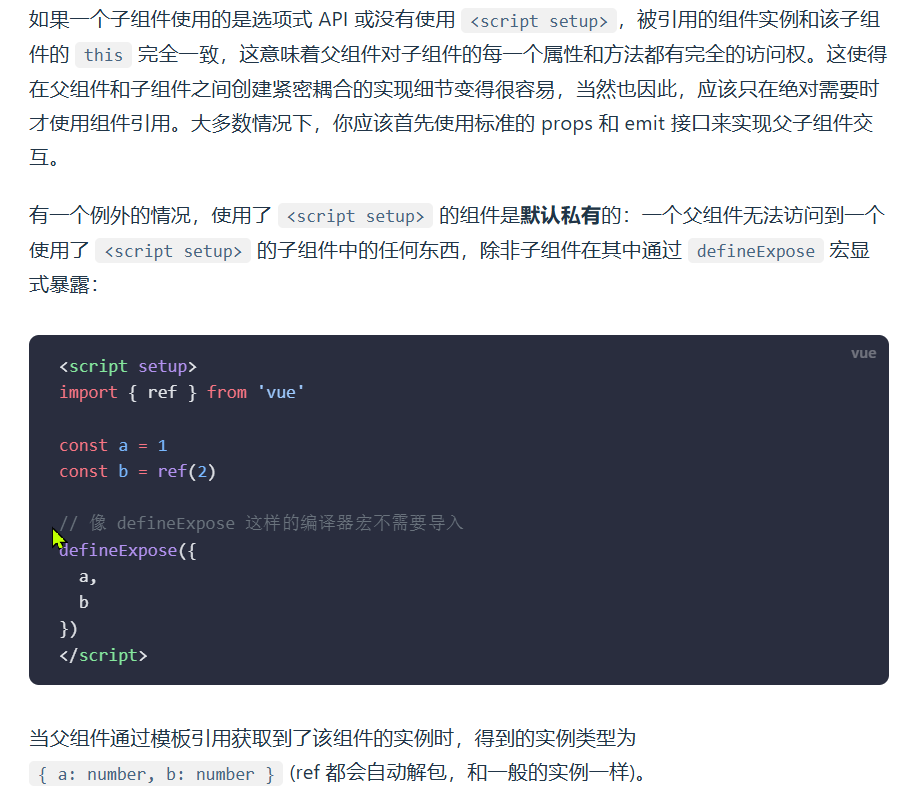
于是我使用defineExpose方法在将我组件中的实例暴露出来:
defineExpose({
  getInstance: () => instance.value,
  resize,
  draw,
})
12.完整代码
<template>
  <div
    ref="container"
    :class="props.className"
    :style="{ width: props.width, height: props.height }"
  ></div>
</template>

<script setup>
import {
  nextTick,
  onMounted,
  onUnmounted,
  ref,
  shallowRef,
  watch,
  watchEffect,
} from 'vue'
import * as echarts from 'echarts'

// props
const props = defineProps({
  option: {
    type: [Object, null],
    require: true,
  }, //配置项
  width: {
    type: String,
    default: '300px',
  },
  height: {
    type: String,
    default: '200px',
  },
  className: {
    type: String,
    default: 'cl-chartCom',
  },
  loading: {
    type: Boolean,
    default: false,
  },
  onClick: {
    type: Function,
  },
})

const container = ref(null) // 容器元素
const instance = shallowRef(null) // 实例
const resizeObserver = shallowRef(null) // 元素尺寸侦听器
const debounceTimer = ref(null) //防抖计时器id

// 初始化
function init() {
  if (!container.value) return

  //查看容器上是否已经挂载了echarts实例 , 如果已挂载就获取并使用该实例,如果未挂载就进行初始化
  instance.value = echarts.getInstanceByDom(container.value)
  if (!instance.value) {
    instance.value = echarts.init(container.value)
  }

  // 绘制图表
  draw()
  // 侦听图表事件
  addListeningChartEvent()
}
// 绘制图表
function draw() {
  if (!props.option || !instance.value) return
  instance.value.setOption(props.option, {
    notMerge: true,
  })
}

// 图表自适应
// 重置图表尺寸
function resize() {
  clearTimeout(debounceTimer.value)
  debounceTimer.value = setTimeout(() => {
    instance.value?.resize({
      animation: {
        duration: 300,
      },
    })
    debounceTimer.value = null
  }, 300)
}
resizeObserver.value = new ResizeObserver(resize)

// 重绘图表
watch(props, () => {
  nextTick(() => {
    draw()
  })
})

// loading动画
watchEffect(() => {
  props.loading ? instance.value?.showLoading() : instance.value?.hideLoading()
})

// echarts事件绑定
function addListeningChartEvent() {
  // 点击事件
  props.onClick &&
    instance.value?.on('click', 'series', (e) => {
      props.onClick(e, instance.value, props.option)
    })
}

onMounted(() => {
  nextTick(() => {
    init()
    resizeObserver.value.observe(container.value)
  })
})
onUnmounted(() => {
  instance.value?.dispose()
  resizeObserver.value?.disconnect()
  resizeObserver.value = null
  clearTimeout(debounceTimer.value)
  debounceTimer.value = null
})

defineExpose({
  getInstance: () => instance.value,
  resize,
  draw,
})
</script>
参考资料
- Vue3 封装 ECharts 通用组件_vue3如何封装echarts-CSDN博客
- Vue3 封装ECharts 组件 抽离复用 包含图表随着窗口宽高变化而变化-CSDN博客
- echartsInstance.setOption - Apache ECharts
- echartsInstance.showLoading - Apache ECharts
- events.鼠标事件.click - Apache ECharts
- 模板引用-Vue.js
