pprof
pprof是Google的程序采样分析工具,其使用分为,采样和分析。Go 语言内置了pprof。
Go 语言库中有两种方式使用pprof,一种是通过net/http/pprof库,另一种是通过runtime/pprof库。
net/http/pprof的简单使用
引入 _ "net/http/pprof"库,开启http://localhost:6060端口的服务,注意其ListenAndServe的addr是可以指定的,handler参数为nil。
package main

import (
	"math/rand"
	"net/http"
	_ "net/http/pprof"
	"runtime"
	"sync"
	"time"
)

func main() {
	runtime.SetMutexProfileFraction(1) // 开启对锁调用的跟踪
	runtime.SetBlockProfileRate(1)     // 开启对阻塞的跟踪

	go func() {
		if err := http.ListenAndServe(":6060", nil); err != nil {
			panic(err)
		}
	}()

	wg := new(sync.WaitGroup)
	randFunction(wg)
	wg.Wait()
}

func randFunction(wg *sync.WaitGroup) {
	rand.Seed(time.Now().UnixNano())
	for i := 0; i < 100; i++ {
		wg.Add(1)
		go func() {
			defer wg.Done()
			s := make([]int, rand.Intn(100000))
			time.Sleep(time.Second * time.Duration(rand.Intn(999999)))
			_ = s
		}()
	}
}
启动程序后,打开浏览器输入:http://localhost:6060/debug/pprof/。可见如下页面:
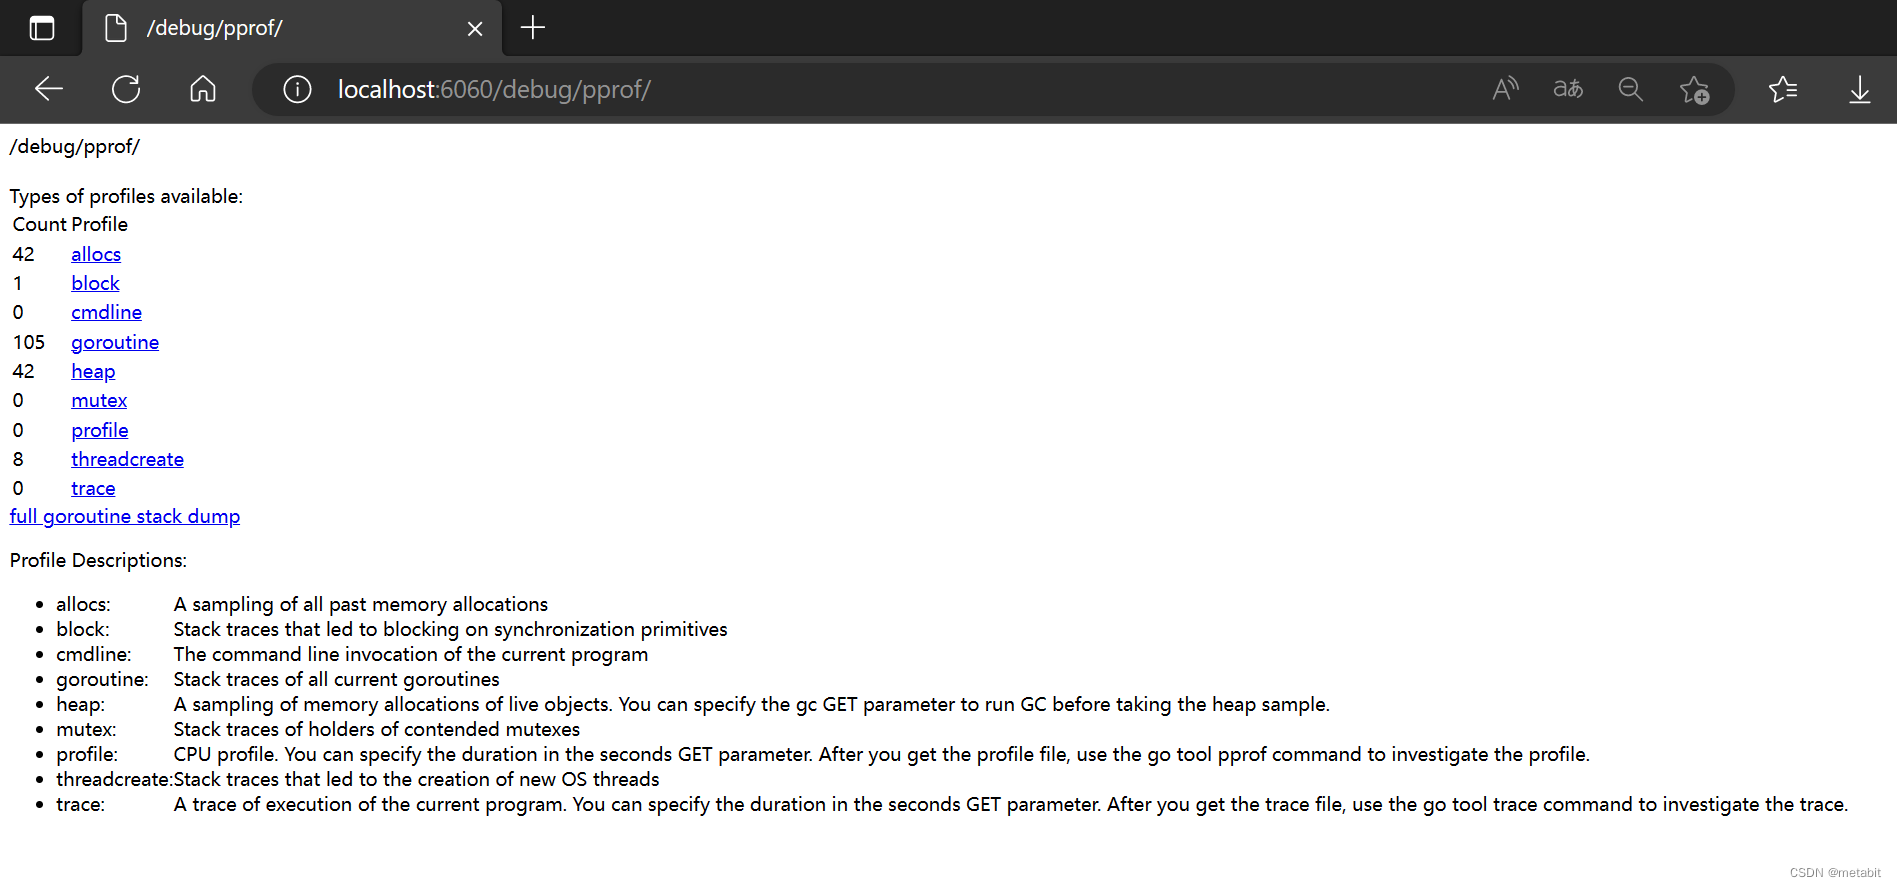
配置文件说明:
allocs(分配): 所有过去内存分配的样本
block(阻塞):导致同步基元阻塞的堆栈跟踪
cmdline(命令行程序):当前程序的命令行调用
goroutine(协程信息):当前所有 goroutines 的堆栈跟踪
heap(堆信息):活动对象的内存分配采样。您可以指定 gc GET 参数以在获取堆示例之前运行 GC
mutex(锁信息):争用互斥锁持有者的堆栈跟踪
profile(配置信息):CPU 配置文件。您可以在秒 GET 参数中指定持续时间。获取配置文件后,使用 go 工具 pprof 命令调查配置文件。
threadcreate(线程创建):导致创建新的操作系统线的程堆栈跟踪
trace(跟踪):当前程序执行的跟踪。您可以在秒 GET 参数中指定持续时间。获取跟踪文件后,使用 go 工具跟踪命令调查跟踪
full goroutine stack dump:dump 所有协程的栈信息
蓝色文字前的数字描述了该操作的“具体数量”
蓝色超链接是可以点击的,比如点击:goroutine
跳转到了http://localhost:6060/debug/pprof/goroutine?debug=1链接,这里展示了goroutine的跟踪信息。
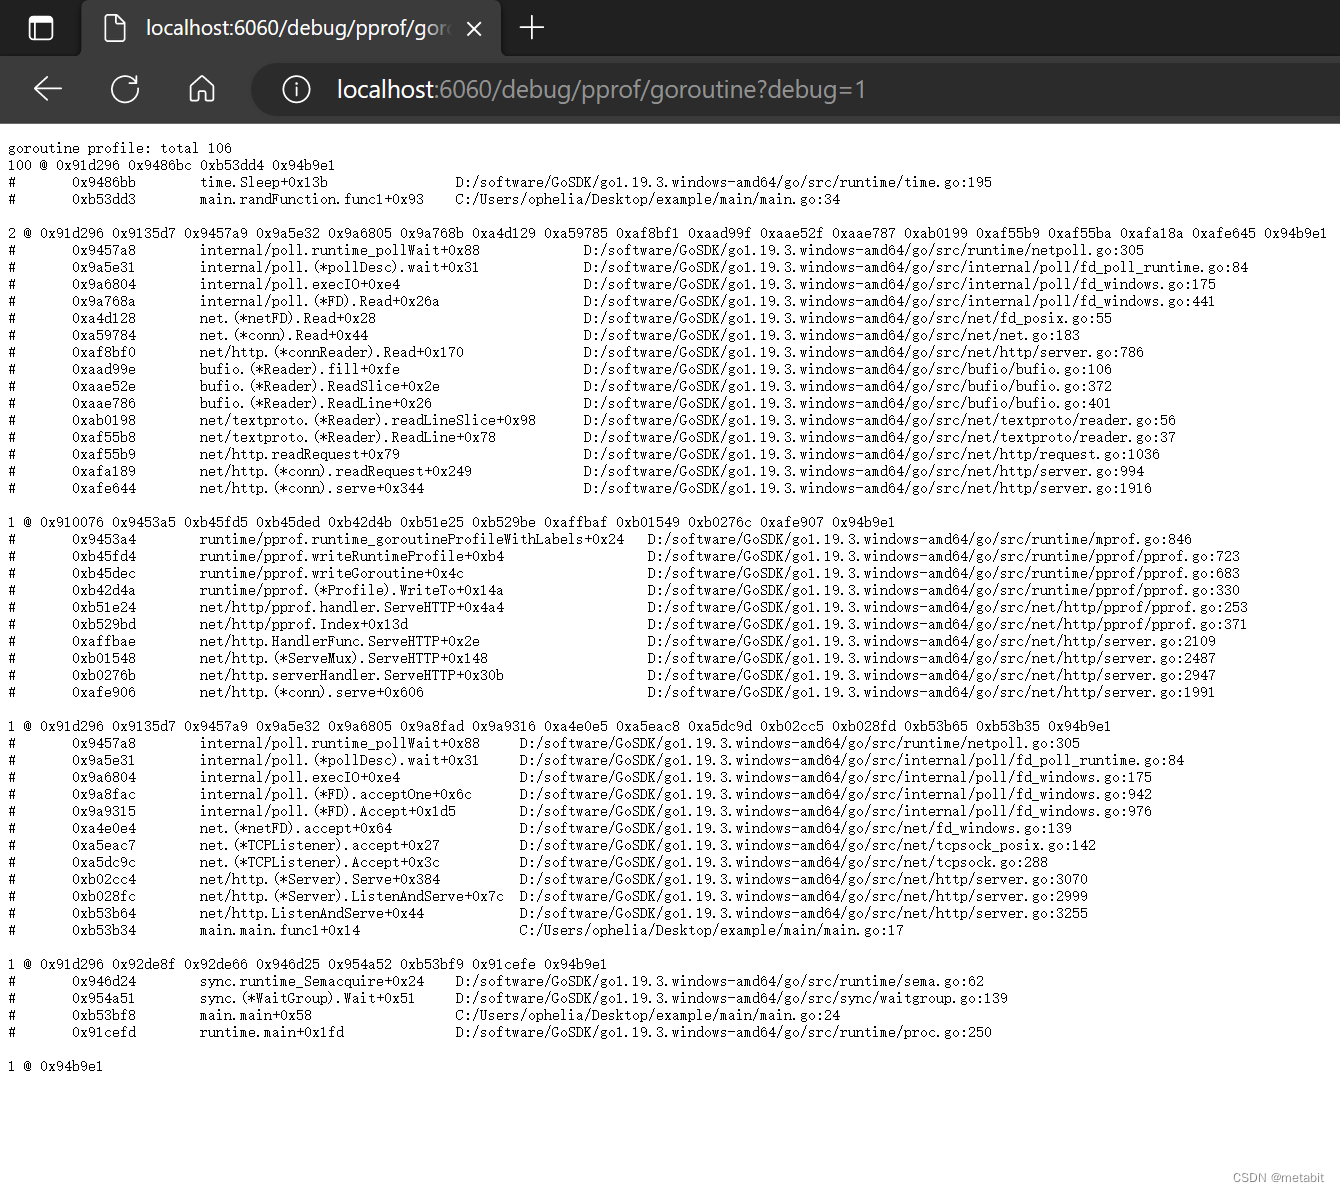
将http://localhost:6060/debug/pprof/goroutine?debug=1中结尾的?debug=1去掉,即可下载当前goroutine的跟踪信息到文件,可用具体的分析工具对其进行分析。
go tool pprof 分析工具
-h 选项可以查看帮助信息。
该工具可以静态分析数据文件,也可以动态的网络流分析。
可以看出pprof <format> [options] [binary] <source> ... pprof 其后可跟一个source,这个source可以是从浏览器下载(curl 也可以获取,或使用runtime/pprof生成)的数据问文件,也可以是一个链接
...\example>go tool pprof -h
usage:

Produce output in the specified format.

   pprof <format> [options] [binary] <source> ...

Omit the format to get an interactive shell whose commands can be used
to generate various views of a profile

   pprof [options] [binary] <source> ...

Omit the format and provide the "-http" flag to get an interactive web
interface at the specified host:port that can be used to navigate through
various views of a profile.

   pprof -http [host]:[port] [options] [binary] <source> ...

Details:
  Output formats (select at most one):
    -callgrind       Outputs a graph in callgrind format
    -comments        Output all profile comments
    -disasm          Output assembly listings annotated with samples
    -dot             Outputs a graph in DOT format
    -eog             Visualize graph through eog
    -evince          Visualize graph through evince
    -gif             Outputs a graph image in GIF format
    -gv              Visualize graph through gv
    -kcachegrind     Visualize report in KCachegrind
    -list            Output annotated source for functions matching regexp
    -pdf             Outputs a graph in PDF format
    -peek            Output callers/callees of functions matching regexp
    -png             Outputs a graph image in PNG format
    -proto           Outputs the profile in compressed protobuf format
    -ps              Outputs a graph in PS format
    -raw             Outputs a text representation of the raw profile
    -svg             Outputs a graph in SVG format
    -tags            Outputs all tags in the profile
    -text            Outputs top entries in text form
    -top             Outputs top entries in text form
    -topproto        Outputs top entries in compressed protobuf format
    -traces          Outputs all profile samples in text form
    -tree            Outputs a text rendering of call graph
    -web             Visualize graph through web browser
    -weblist         Display annotated source in a web browser

  Options:
    -call_tree       Create a context-sensitive call tree
    -compact_labels  Show minimal headers
    -divide_by       Ratio to divide all samples before visualization
    -drop_negative   Ignore negative differences
    -edgefraction    Hide edges below <f>*total
    -focus           Restricts to samples going through a node matching regexp
    -hide            Skips nodes matching regexp
    -ignore          Skips paths going through any nodes matching regexp
    -intel_syntax    Show assembly in Intel syntax
    -mean            Average sample value over first value (count)
    -nodecount       Max number of nodes to show
    -nodefraction    Hide nodes below <f>*total
    -noinlines       Ignore inlines.
    -normalize       Scales profile based on the base profile.
    -output          Output filename for file-based outputs
    -prune_from      Drops any functions below the matched frame.
    -relative_percentages Show percentages relative to focused subgraph
    -sample_index    Sample value to report (0-based index or name)
    -show            Only show nodes matching regexp
    -show_from       Drops functions above the highest matched frame.
    -source_path     Search path for source files
    -tagfocus        Restricts to samples with tags in range or matched by regexp
    -taghide         Skip tags matching this regexp
    -tagignore       Discard samples with tags in range or matched by regexp
    -tagleaf         Adds pseudo stack frames for labels key/value pairs at the callstack leaf.
    -tagroot         Adds pseudo stack frames for labels key/value pairs at the callstack root.
    -tagshow         Only consider tags matching this regexp
    -trim            Honor nodefraction/edgefraction/nodecount defaults
    -trim_path       Path to trim from source paths before search
    -unit            Measurement units to display

  Option groups (only set one per group):
    granularity
      -functions       Aggregate at the function level.
      -filefunctions   Aggregate at the function level.
      -files           Aggregate at the file level.
      -lines           Aggregate at the source code line level.
      -addresses       Aggregate at the address level.
    sort
      -cum             Sort entries based on cumulative weight
      -flat            Sort entries based on own weight

  Source options:
    -seconds              Duration for time-based profile collection
    -timeout              Timeout in seconds for profile collection
    -buildid              Override build id for main binary
    -add_comment          Free-form annotation to add to the profile
                          Displayed on some reports or with pprof -comments
    -diff_base source     Source of base profile for comparison
    -base source          Source of base profile for profile subtraction
    profile.pb.gz         Profile in compressed protobuf format
    legacy_profile        Profile in legacy pprof format
    http://host/profile   URL for profile handler to retrieve
    -symbolize=           Controls source of symbol information
      none                  Do not attempt symbolization
      local                 Examine only local binaries
      fastlocal             Only get function names from local binaries
      remote                Do not examine local binaries
      force                 Force re-symbolization
    Binary                  Local path or build id of binary for symbolization
    -tls_cert             TLS client certificate file for fetching profile and symbols
    -tls_key              TLS private key file for fetching profile and symbols
    -tls_ca               TLS CA certs file for fetching profile and symbols

  Misc options:
   -http              Provide web interface at host:port.
                      Host is optional and 'localhost' by default.
                      Port is optional and a randomly available port by default.
   -no_browser        Skip opening a browser for the interactive web UI.
   -tools             Search path for object tools

  Legacy convenience options:
   -inuse_space           Same as -sample_index=inuse_space
   -inuse_objects         Same as -sample_index=inuse_objects
   -alloc_space           Same as -sample_index=alloc_space
   -alloc_objects         Same as -sample_index=alloc_objects
   -total_delay           Same as -sample_index=delay
   -contentions           Same as -sample_index=contentions
   -mean_delay            Same as -mean -sample_index=delay

  Environment Variables:
   PPROF_TMPDIR       Location for saved profiles (default $HOME/pprof)
   PPROF_TOOLS        Search path for object-level tools
   PPROF_BINARY_PATH  Search path for local binary files
                      default: $HOME/pprof/binaries
                      searches $name, $path, $buildid/$name, $path/$buildid
   * On Windows, %USERPROFILE% is used instead of $HOME
使用go tool pprof http://localhost:6060/debug/pprof/allocs分析当前应用内存信息。
...\Desktop\example>go tool pprof http://localhost:6060/debug/pprof/allocs
Fetching profile over HTTP from http://localhost:6060/debug/pprof/allocs
Saved profile in
...\pprof\pprof.alloc_objects.alloc_space.inuse_objects.inuse_space.002.pb.gz
Type: alloc_space
Time: Jan 22, 2023 at 4:28pm (CST)
Entering interactive mode (type "help" for commands, "o" for options)
(pprof)
可以发现,该命令行是交互式的。
输入help 可以查看其支持的所有子命令。
(pprof) help
  Commands:
    callgrind        Outputs a graph in callgrind format
    comments         Output all profile comments
    disasm           Output assembly listings annotated with samples
    dot              Outputs a graph in DOT format
    eog              Visualize graph through eog
    evince           Visualize graph through evince
    gif              Outputs a graph image in GIF format
    gv               Visualize graph through gv
    kcachegrind      Visualize report in KCachegrind
    list             Output annotated source for functions matching regexp
    pdf              Outputs a graph in PDF format
    peek             Output callers/callees of functions matching regexp
    png              Outputs a graph image in PNG format
    proto            Outputs the profile in compressed protobuf format
    ps               Outputs a graph in PS format
    raw              Outputs a text representation of the raw profile
    svg              Outputs a graph in SVG format
    tags             Outputs all tags in the profile
    text             Outputs top entries in text form
    top              Outputs top entries in text form
    topproto         Outputs top entries in compressed protobuf format
    traces           Outputs all profile samples in text form
    tree             Outputs a text rendering of call graph
    web              Visualize graph through web browser
    weblist          Display annotated source in a web browser
    o/options        List options and their current values
    q/quit/exit/^D   Exit pprof

  Options:
    call_tree        Create a context-sensitive call tree
    compact_labels   Show minimal headers
    divide_by        Ratio to divide all samples before visualization
    drop_negative    Ignore negative differences
    edgefraction     Hide edges below <f>*total
    focus            Restricts to samples going through a node matching regexp
    hide             Skips nodes matching regexp
    ignore           Skips paths going through any nodes matching regexp
    intel_syntax     Show assembly in Intel syntax
    mean             Average sample value over first value (count)
    nodecount        Max number of nodes to show
    nodefraction     Hide nodes below <f>*total
    noinlines        Ignore inlines.
    normalize        Scales profile based on the base profile.
    output           Output filename for file-based outputs
    prune_from       Drops any functions below the matched frame.
    relative_percentages Show percentages relative to focused subgraph
    sample_index     Sample value to report (0-based index or name)
    show             Only show nodes matching regexp
    show_from        Drops functions above the highest matched frame.
    source_path      Search path for source files
    tagfocus         Restricts to samples with tags in range or matched by regexp
    taghide          Skip tags matching this regexp
    tagignore        Discard samples with tags in range or matched by regexp
    tagleaf          Adds pseudo stack frames for labels key/value pairs at the callstack leaf.
    tagroot          Adds pseudo stack frames for labels key/value pairs at the callstack root.
    tagshow          Only consider tags matching this regexp
    trim             Honor nodefraction/edgefraction/nodecount defaults
    trim_path        Path to trim from source paths before search
    unit             Measurement units to display

  Option groups (only set one per group):
    granularity
      functions        Aggregate at the function level.
      filefunctions    Aggregate at the function level.
      files            Aggregate at the file level.
      lines            Aggregate at the source code line level.
      addresses        Aggregate at the address level.
    sort
      cum              Sort entries based on cumulative weight
      flat             Sort entries based on own weight
  :   Clear focus/ignore/hide/tagfocus/tagignore

  type "help <cmd|option>" for more information
(pprof)
使用top,就可以查看所有内存占用信息
(pprof) top
Showing nodes accounting for 46504.27kB, 100% of 46504.27kB total
Showing top 10 nodes out of 34
      flat  flat%   sum%        cum   cum%
42900.35kB 92.25% 92.25% 42900.35kB 92.25%  main.randFunction.func1
  902.59kB  1.94% 94.19%  1553.21kB  3.34%  compress/flate.NewWriter
  650.62kB  1.40% 95.59%   650.62kB  1.40%  compress/flate.(*compressor).init
     514kB  1.11% 96.70%      514kB  1.11%  bufio.NewWriterSize (inline)
  512.50kB  1.10% 97.80%   512.50kB  1.10%  runtime.allocm
  512.20kB  1.10% 98.90%   512.20kB  1.10%  runtime.malg
  512.01kB  1.10%   100%   512.01kB  1.10%  runtime/pprof.printCountProfile.func1
         0     0%   100%  1553.21kB  3.34%  compress/gzip.(*Writer).Write
         0     0%   100%  2065.22kB  4.44%  net/http.(*ServeMux).ServeHTTP
         0     0%   100%  2579.22kB  5.55%  net/http.(*conn).serve
(pprof)
输入top n(1个有效的数字),可以查看前n项内存分配信息
(pprof) top 3
Showing nodes accounting for 44453.56kB, 95.59% of 46504.27kB total
Showing top 3 nodes out of 34
      flat  flat%   sum%        cum   cum%
42900.35kB 92.25% 92.25% 42900.35kB 92.25%  main.randFunction.func1
  902.59kB  1.94% 94.19%  1553.21kB  3.34%  compress/flate.NewWriter
  650.62kB  1.40% 95.59%   650.62kB  1.40%  compress/flate.(*compressor).init
(pprof)
可见,上边的信息最后一列是具体的包名.函数名
使用 list 包名.函数名 可以查看该函数具体内存分配信息
(pprof) list main.randFunction.func1
Total: 45.41MB
ROUTINE ======================== main.randFunction.func1 in
...\example\main\main.go
   41.89MB    41.89MB (flat, cum) 92.25% of Total
         .          .     28:   rand.Seed(time.Now().UnixNano())
         .          .     29:   for i := 0; i < 100; i++ {
         .          .     30:           wg.Add(1)
         .          .     31:           go func() {
         .          .     32:                   defer wg.Done()
   41.89MB    41.89MB     33:                   s := make([]int, rand.Intn(100000))
         .          .     34:                   time.Sleep(time.Second * time.Duration(rand.Intn(999999)))
         .          .     35:                   _ = s
         .          .     36:           }()
         .          .     37:   }
         .          .     38:}
(pprof)
可以看出导致大量内存分配的罪魁祸首是s := make([]int, rand.Intn(100000)),分配了41.89MB内存
41.89MB 41.89MB 33: s := make([]int, rand.Intn(100000))
输入 web 可以在web端以图的方式展现信息
(pprof) web
failed to execute dot. Is Graphviz installed? Error: exec: "dot": executable file not found in %PATH%
(pprof)
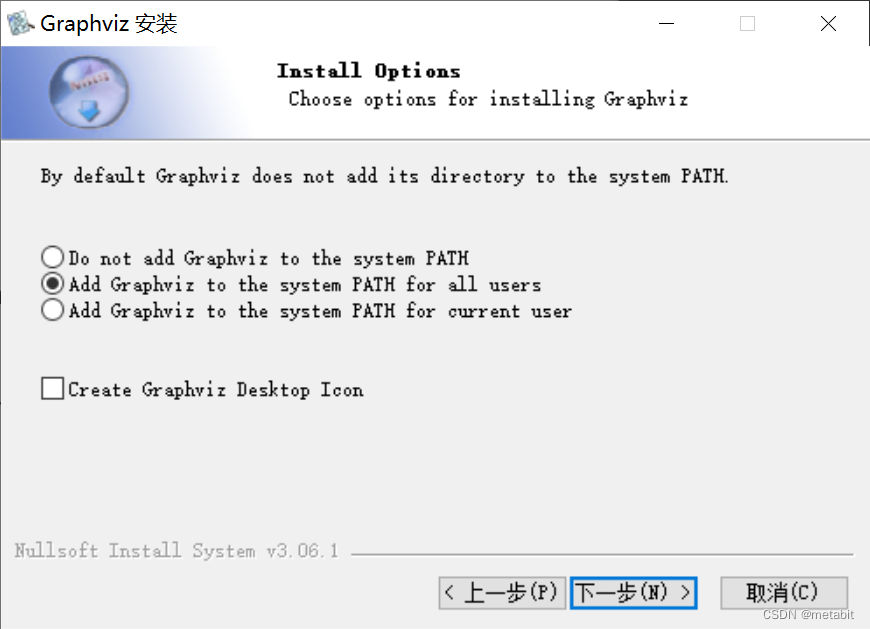
上边说的是让我们安装Graphviz这个工具。需把该命令加入环境变量的PATH中。
在http://www.graphviz.org/该网站中Download即可。
安装时根据个人喜好,选择环境变量。
此时重启一次命令行,并重新输入
...\example>go tool pprof http://localhost:6060/debug/pprof/allocs
Fetching profile over HTTP from http://localhost:6060/debug/pprof/allocs
Saved profile in
...\pprof\pprof.alloc_objects.alloc_space.inuse_objects.inuse_space.005.pb.gz
Type: alloc_space
Time: Jan 22, 2023 at 4:46pm (CST)
Entering interactive mode (type "help" for commands, "o" for options)
(pprof) web
(pprof)
便可查看具体函数内存占用。同理还可以查看其他指标的信息。
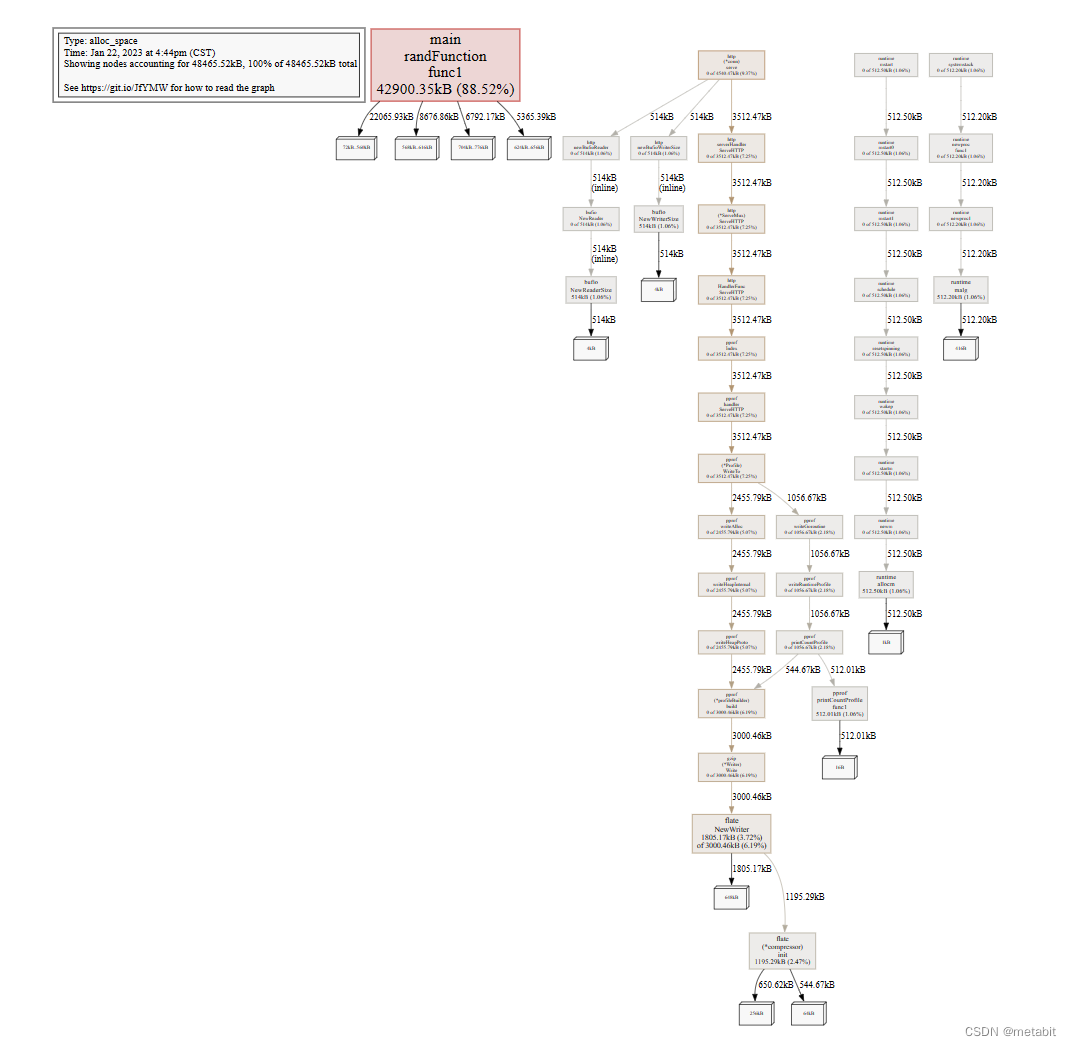
节点颜色:
红色:累计值cum为正,并且很大
绿色:累计值cum为负,并且很大
灰色:cum可以忽略不计
节点字体大小:
较大的字体表示当前值较大
较小的字体表示当前值较小
边框颜色:
红色:当前值较大并且为正
绿色:当前值较小并未为负
灰色:当前值接近0
箭头大小:
箭头越粗:当前路径消耗的资源越多
箭头越细:当前路径消耗的资源越少
箭头线性:
虚线:两个节点间某些节点可以被忽略,为间接调用
实现:两个节点间为直接调用
在url中可以使用second指定采样的时间:http://localhost:6060/debug/pprof/trace?seconds=5,采样时间为5秒。
使用tree命令可以查找到函数的调用链
(pprof) tree
Showing nodes accounting for 44816.50kB, 100% of 44816.50kB total
----------------------------------------------------------+-------------
      flat  flat%   sum%        cum   cum%   calls calls% + context

----------------------------------------------------------+-------------
43791.80kB 97.71% 97.71% 43791.80kB 97.71%                | main.randFunction.func1
----------------------------------------------------------+-------------
                                          512.50kB   100% |   runtime.newm
  512.50kB  1.14% 98.86%   512.50kB  1.14%                | runtime.allocm
----------------------------------------------------------+-------------
                                          512.20kB   100% |   runtime.newproc1
  512.20kB  1.14%   100%   512.20kB  1.14%                | runtime.malg
----------------------------------------------------------+-------------
         0     0%   100%   512.50kB  1.14%                | runtime.mstart
                                          512.50kB   100% |   runtime.mstart0
----------------------------------------------------------+-------------
                                          512.50kB   100% |   runtime.mstart
         0     0%   100%   512.50kB  1.14%                | runtime.mstart0
                                          512.50kB   100% |   runtime.mstart1
----------------------------------------------------------+-------------
                                          512.50kB   100% |   runtime.mstart0
         0     0%   100%   512.50kB  1.14%                | runtime.mstart1
                                          512.50kB   100% |   runtime.schedule
----------------------------------------------------------+-------------
                                          512.50kB   100% |   runtime.startm
         0     0%   100%   512.50kB  1.14%                | runtime.newm
                                          512.50kB   100% |   runtime.allocm
----------------------------------------------------------+-------------
                                          512.20kB   100% |   runtime.systemstack
         0     0%   100%   512.20kB  1.14%                | runtime.newproc.func1
                                          512.20kB   100% |   runtime.newproc1
----------------------------------------------------------+-------------
                                          512.20kB   100% |   runtime.newproc.func1
         0     0%   100%   512.20kB  1.14%                | runtime.newproc1
                                          512.20kB   100% |   runtime.malg
----------------------------------------------------------+-------------
                                          512.50kB   100% |   runtime.schedule
         0     0%   100%   512.50kB  1.14%                | runtime.resetspinning
                                          512.50kB   100% |   runtime.wakep
----------------------------------------------------------+-------------
                                          512.50kB   100% |   runtime.mstart1
         0     0%   100%   512.50kB  1.14%                | runtime.schedule
                                          512.50kB   100% |   runtime.resetspinning
----------------------------------------------------------+-------------
                                          512.50kB   100% |   runtime.wakep
         0     0%   100%   512.50kB  1.14%                | runtime.startm
                                          512.50kB   100% |   runtime.newm
----------------------------------------------------------+-------------
         0     0%   100%   512.20kB  1.14%                | runtime.systemstack
                                          512.20kB   100% |   runtime.newproc.func1
----------------------------------------------------------+-------------
                                          512.50kB   100% |   runtime.resetspinning
         0     0%   100%   512.50kB  1.14%                | runtime.wakep
                                          512.50kB   100% |   runtime.startm
----------------------------------------------------------+-------------
(pprof)
tree runtime.newm
(pprof) tree runtime.newm
Active filters:
   focus=runtime.newm
Showing nodes accounting for 512.50kB, 1.14% of 44816.50kB total
----------------------------------------------------------+-------------
      flat  flat%   sum%        cum   cum%   calls calls% + context
----------------------------------------------------------+-------------
                                          512.50kB   100% |   runtime.newm
  512.50kB  1.14%  1.14%   512.50kB  1.14%                | runtime.allocm
----------------------------------------------------------+-------------
         0     0%  1.14%   512.50kB  1.14%                | runtime.mstart
                                          512.50kB   100% |   runtime.mstart0
----------------------------------------------------------+-------------
                                          512.50kB   100% |   runtime.mstart
         0     0%  1.14%   512.50kB  1.14%                | runtime.mstart0
                                          512.50kB   100% |   runtime.mstart1
----------------------------------------------------------+-------------
                                          512.50kB   100% |   runtime.mstart0
         0     0%  1.14%   512.50kB  1.14%                | runtime.mstart1
                                          512.50kB   100% |   runtime.schedule
----------------------------------------------------------+-------------
                                          512.50kB   100% |   runtime.startm
         0     0%  1.14%   512.50kB  1.14%                | runtime.newm
                                          512.50kB   100% |   runtime.allocm
----------------------------------------------------------+-------------
                                          512.50kB   100% |   runtime.schedule
         0     0%  1.14%   512.50kB  1.14%                | runtime.resetspinning
                                          512.50kB   100% |   runtime.wakep
----------------------------------------------------------+-------------
                                          512.50kB   100% |   runtime.mstart1
         0     0%  1.14%   512.50kB  1.14%                | runtime.schedule
                                          512.50kB   100% |   runtime.resetspinning
----------------------------------------------------------+-------------
                                          512.50kB   100% |   runtime.wakep
         0     0%  1.14%   512.50kB  1.14%                | runtime.startm
                                          512.50kB   100% |   runtime.newm
----------------------------------------------------------+-------------
                                          512.50kB   100% |   runtime.resetspinning
         0     0%  1.14%   512.50kB  1.14%                | runtime.wakep
                                          512.50kB   100% |   runtime.startm
----------------------------------------------------------+-------------
(pprof)
火焰图
go tool 也内置了火焰图分析工具。
使用
go tool pprof -http :6061 http://localhost:6060/debug/pprof/profile?second=30
在收集30秒信息后会自动打开浏览器,显示火焰图。
在VIEW中选择Flame Graph。查看火焰图。
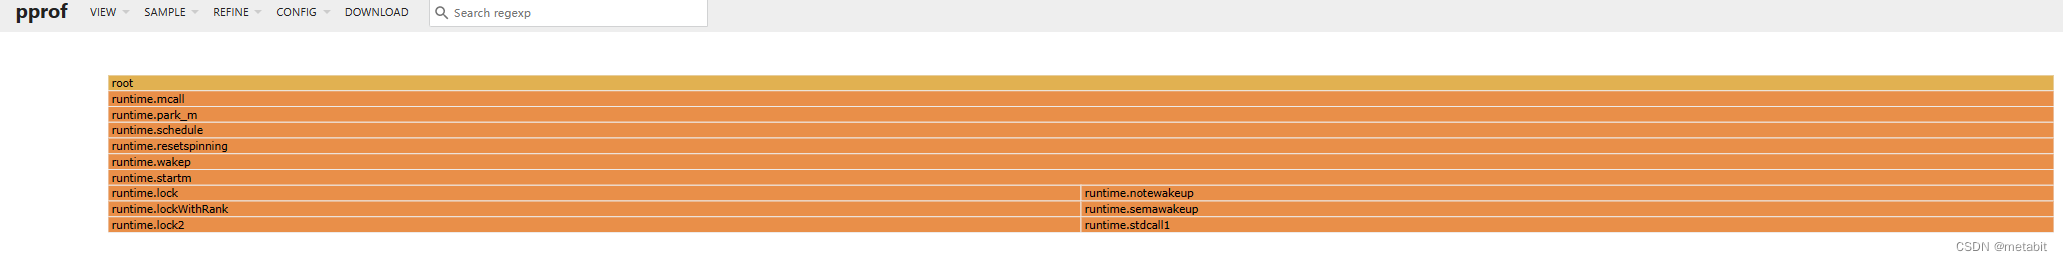
火焰图说明:
root代表程序的开始,单击每个函数可以查看具体信息。
其他框分别代表一个函数,每一层的函数都为平级的,下一层函数被上一层函数所调用。
函数调用栈越长,火焰越明亮。
框越长,颜色越深,代表该函数CPU时间占用越久。
trace 事件跟踪的简单使用
trace可以获取更加详细的调用链信息。
获取30秒trace信息:http://localhost:6060/debug/pprof/trace?second=30
通过浏览器下载该文件。
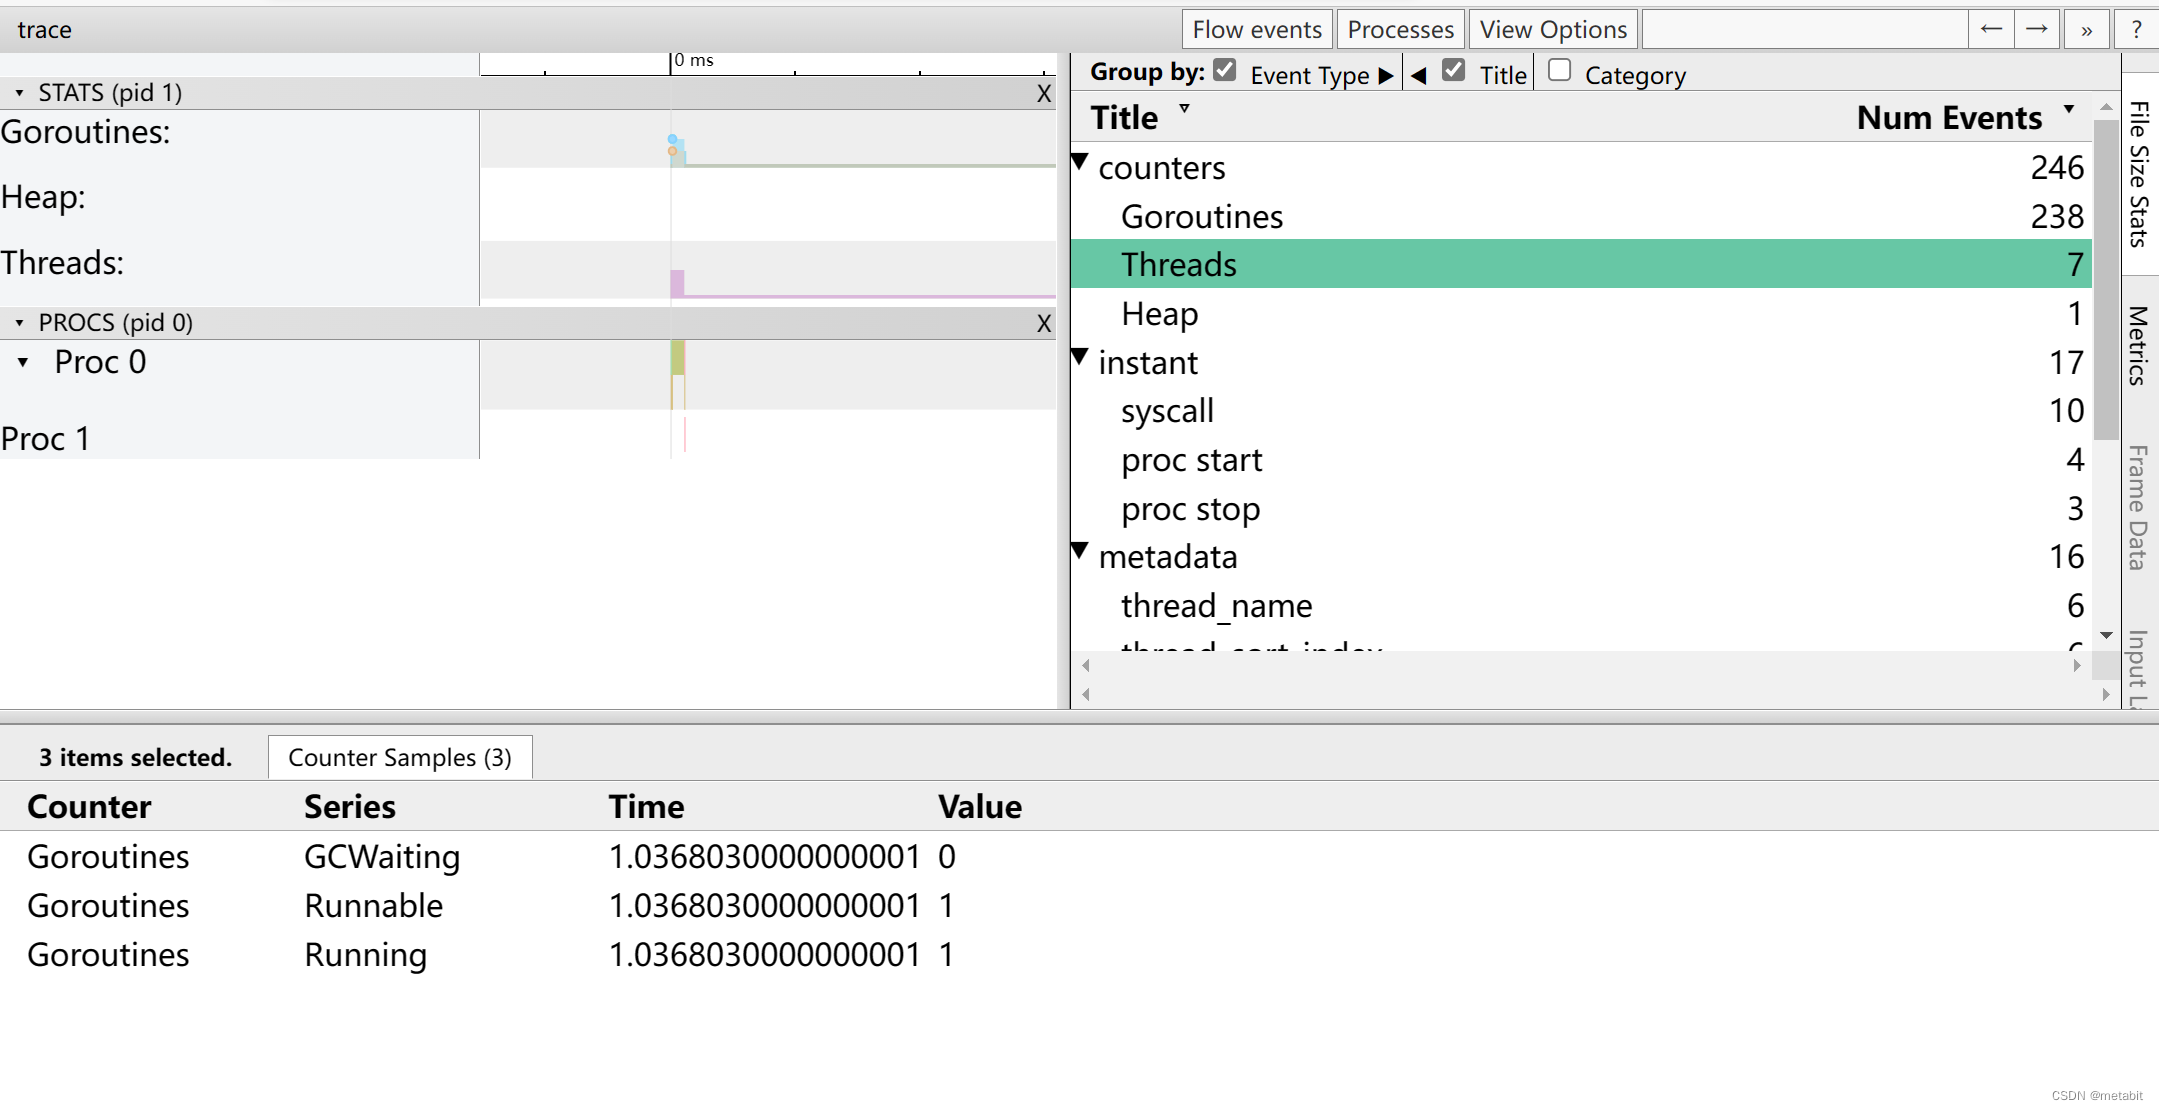
切换到文件所在路径,执行go tool trace trace最后的trace为刚刚下载的文件名。
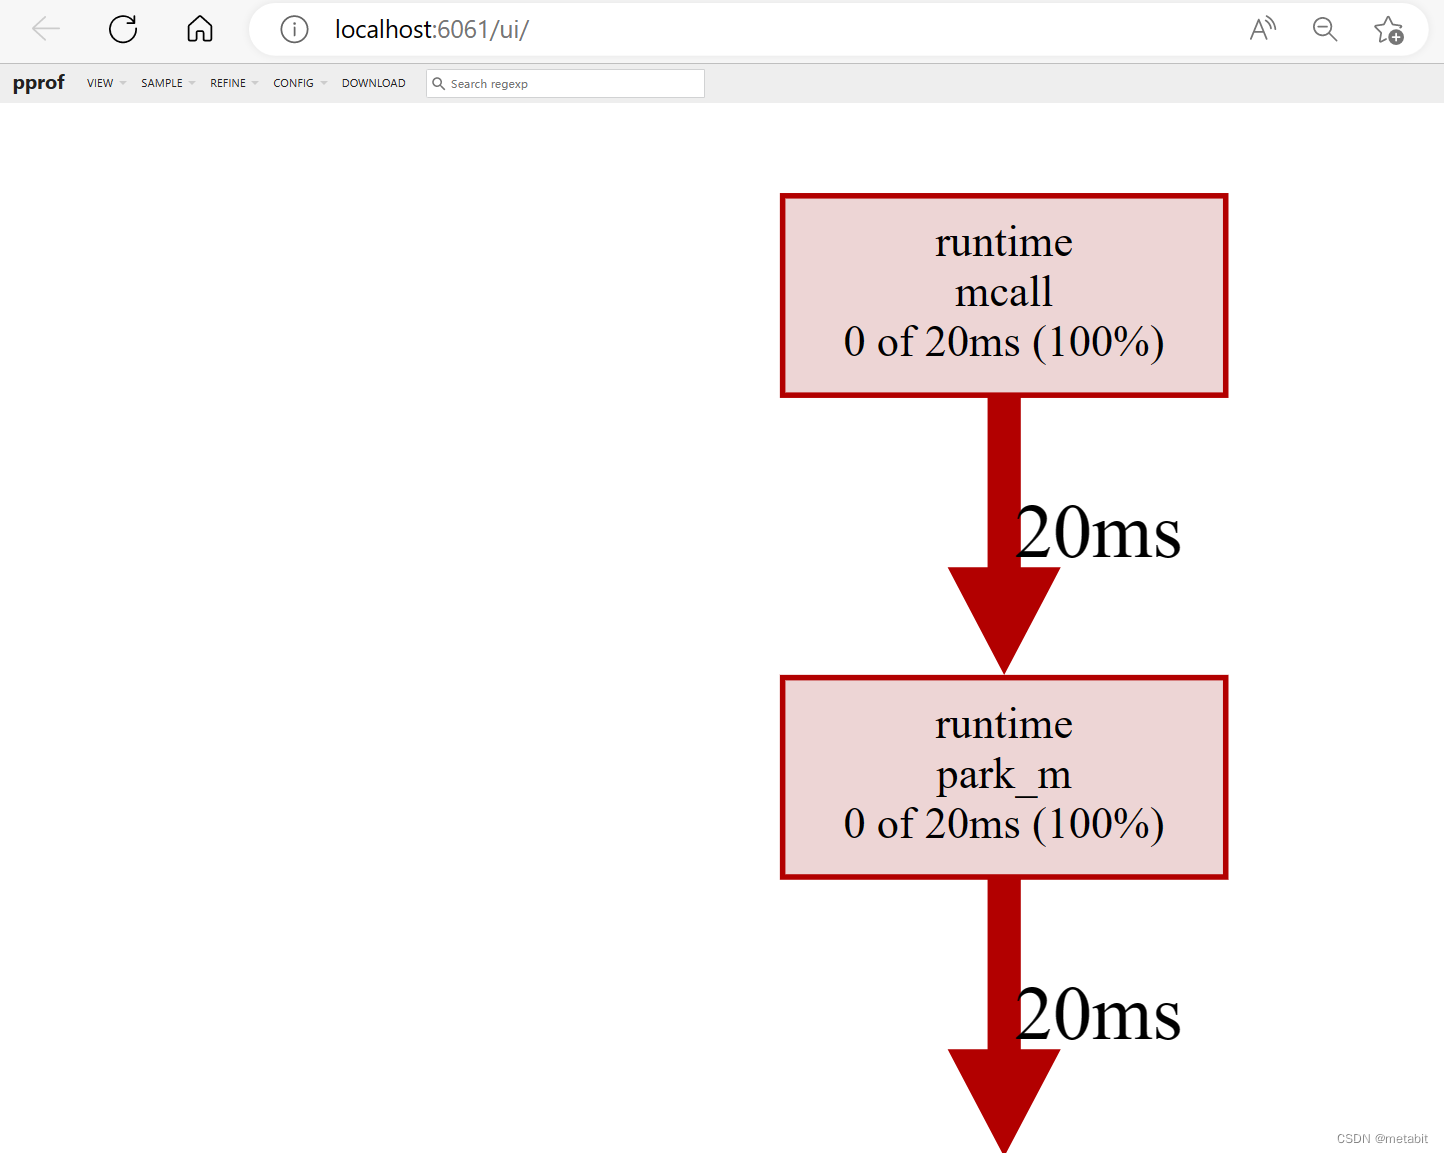
程序自动打开了浏览器:
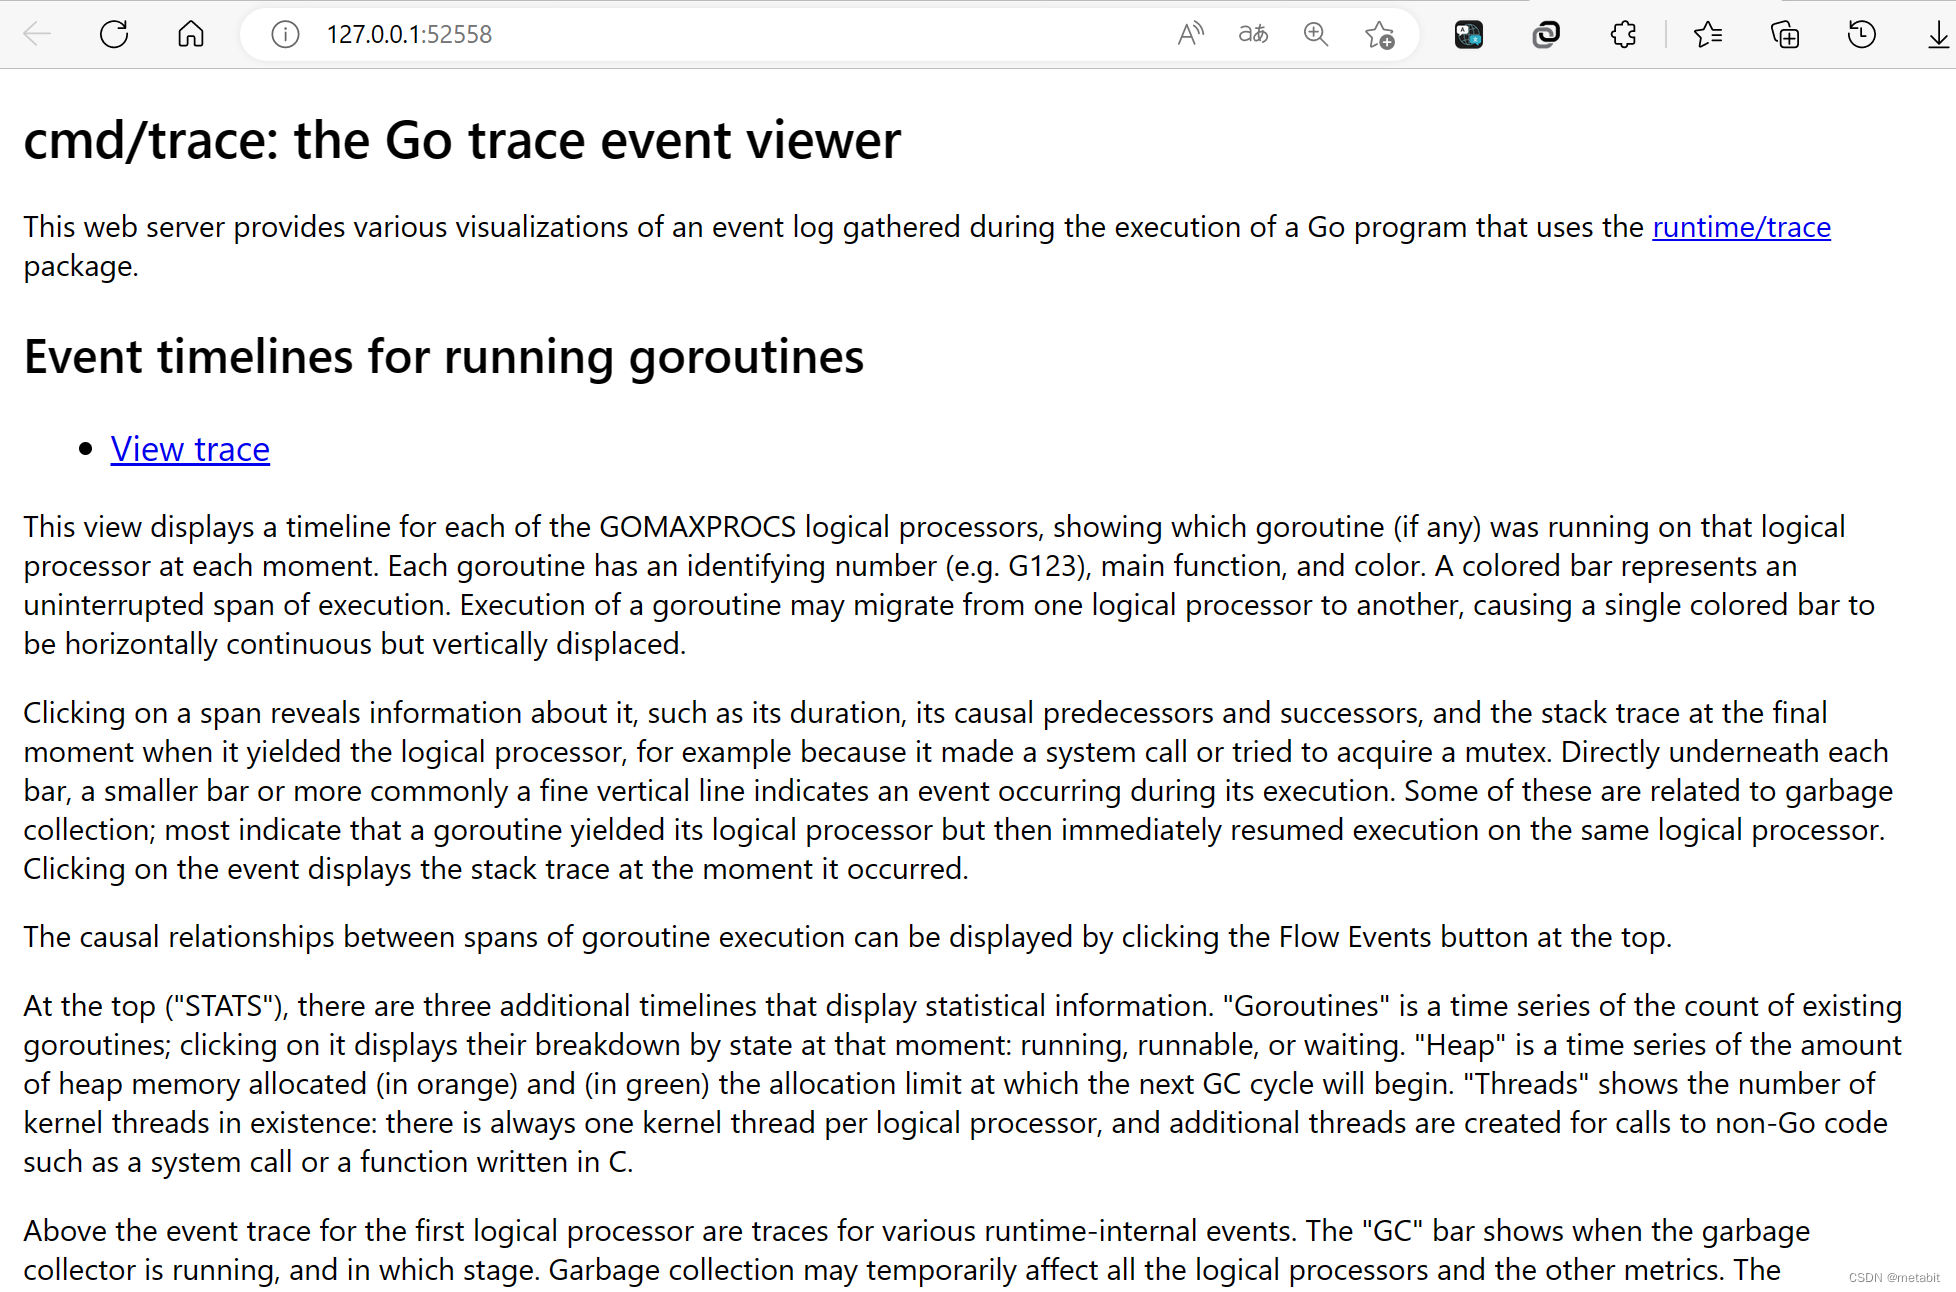
点击View trace,查看trace信息:
Reference
《Go 语言底层原理剖析》