🤵♂️ 个人主页:@艾派森的个人主页
✍🏻作者简介:Python学习者
🐋 希望大家多多支持,我们一起进步!😄
如果文章对你有帮助的话,
欢迎评论 💬点赞👍🏻 收藏 📂加关注+
喜欢大数据分析项目的小伙伴,希望可以多多支持该系列的其他文章
| 大数据分析案例-基于随机森林算法预测人类预期寿命 |
| 大数据分析案例-基于随机森林算法的商品评价情感分析 |
| 大数据分析案例-用RFM模型对客户价值分析(聚类) |
| 大数据分析案例-对电信客户流失分析预警预测 |
| 大数据分析案例-基于随机森林模型对北京房价进行预测 |
| 大数据分析案例-基于RFM模型对电商客户价值分析 |
| 大数据分析案例-基于逻辑回归算法构建垃圾邮件分类器模型 |
| 大数据分析案例-基于决策树算法构建员工离职预测模型 |
| 大数据分析案例-基于KNN算法对茅台股票进行预测 |
| 大数据分析案例-基于多元线性回归算法构建广告投放收益模型 |
| 大数据分析案例-基于随机森林算法构建返乡人群预测模型 |
| 大数据分析案例-基于决策树算法构建金融反欺诈分类模型 |
目录
1.项目背景
2.项目简介
2.1项目说明
2.2数据说明
2.3技术工具
3.算法原理
4.项目实施步骤
4.1理解数据
4.2数据预处理
4.3探索性数据分析
4.4特征工程
4.5模型构建
4.6模型评估
5.实验总结
源代码
1.项目背景
随着金融科技的发展和数字化浪潮的推进,银行和其他金融机构越来越依赖数据分析来做出决策,特别是在贷款审批领域。传统的贷款审批过程往往依赖于人工审核和有限的信用评分系统,这种方法不仅效率低下,而且可能受到主观偏见和人为错误的影响。因此,开发一种能够自动、准确并高效地评估贷款申请人信用风险的模型变得至关重要。
近年来,机器学习算法,特别是随机森林算法,在信用风险评估领域的应用逐渐受到关注。随机森林算法是一种集成学习方法,它通过构建多个决策树并结合它们的输出来提高预测精度和稳定性。该算法能够处理大量高维数据,自动捕捉数据中的非线性关系,并且对噪声和异常值具有较强的鲁棒性。
本研究不仅有助于推动银行贷款审批流程的数字化转型,还可为其他金融领域的风险管理提供有益的参考和借鉴。随着数据科学和人工智能技术的不断发展,未来贷款审批预测模型将更加精准、高效,为金融业的稳定发展提供有力支持。
2.项目简介
2.1项目说明
本项目旨在利用借款人的历史信用记录、财务状况、个人背景等多维度信息,通过机器学习和数据分析技术,构建一个自动化的贷款审批流程。该模型能够快速、准确地评估申请人的信用风险,帮助银行做出更加明智的贷款决策,减少坏账风险,提高贷款业务的盈利能力。
此外,该模型还有助于银行实现客户细分和个性化服务。通过对不同申请人群体进行特征分析和风险预测,银行可以更加精准地满足不同客户群体的需求,优化贷款产品设计和定价策略,提升客户满意度和忠诚度。因此,基于随机森林算法的银行贷款审批模型不仅具有重要的理论价值,还具有广阔的应用前景和巨大的市场潜力。
2.2数据说明
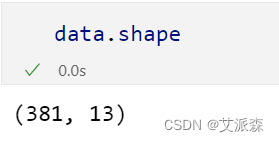
本数据集来源于Kaggle,在这个贷款状态预测数据集中,我们有以前根据property Loan的属性申请贷款的申请人的数据。银行将根据申请人的收入、贷款金额、以前的信用记录、共同申请人的收入等因素来决定是否向申请人提供贷款。我们的目标是建立一个机器学习模型来预测申请人的贷款被批准或被拒绝。原始数据集共有381条,13个变量。各变量含义如下:
Loan_ID:唯一的贷款ID。
Gender:男性或女性。
Married:天气结婚(是)或不结婚(否)。
Dependents:依赖于客户端的人数。
Education :申请人学历(研究生或本科)。
Self_Employed:自雇(是/否)。
ApplicantIncome:申请人收入。
CoapplicantIncome:共同申请人收入。
LoanAmount:以千为单位的贷款金额。
Loan_Amount_Term:以月为单位的贷款期限。
Credit_History:信用记录符合指导原则。
Property_Area:申请人居住在城市、半城市或农村。
Loan_Status:贷款批准(Y/N)。
2.3技术工具
Python版本:3.9
代码编辑器:jupyter notebook
3.算法原理
随机森林是一种有监督学习算法。就像它的名字一样,它创建了一个森林,并使它拥有某种方式随机性。所构建的“森林”是决策树的集成,大部分时候都是用“bagging”方法训练的。bagging 方法,即 bootstrapaggregating,采用的是随机有放回的选择训练数据然后构造分类器,最后组合学习到的模型来增加整体的效果。简而言之,随机森林建立了多个决策树,并将它们合并在一起以获得更准确和稳定的预测。其一大优势在于它既可用于分类,也可用于回归问题,这两类问题恰好构成了当前的大多数机器学习系统所需要面对的。
随机森林分类器使用所有的决策树分类器以及 bagging 分类器的超参数来控制整体结构。与其先构建 bagging分类器,并将其传递给决策树分类器,我们可以直接使用随机森林分类器类,这样对于决策树而言,更加方便和优化。要注意的是,回归问题同样有一个随机森林回归器与之相对应。
随机森林算法中树的增长会给模型带来额外的随机性。与决策树不同的是,每个节点被分割成最小化误差的最佳指标,在随机森林中我们选择随机选择的指标来构建最佳分割。因此,在随机森林中,仅考虑用于分割节点的随机子集,甚至可以通过在每个指标上使用随机阈值来使树更加随机,而不是如正常的决策树一样搜索最佳阈值。这个过程产生了广泛的多样性,通常可以得到更好的模型。
4.项目实施步骤
4.1理解数据
导入本次实验的第三方库
import numpy as np
import pandas as pd
import matplotlib.pyplot as plt
import seaborn as sns
import warnings
from sklearn.metrics import accuracy_score, confusion_matrix, roc_curve, auc
from sklearn.preprocessing import MinMaxScaler
from sklearn.feature_selection import SelectKBest, chi2
from sklearn.ensemble import ExtraTreesClassifier
from sklearn.linear_model import LogisticRegression
import xgboost as xgb
from xgboost import XGBClassifier
from sklearn.model_selection import RandomizedSearchCV
from sklearn.model_selection import train_test_split
from sklearn.tree import DecisionTreeClassifier
from sklearn.ensemble import RandomForestClassifier
from sklearn.preprocessing import LabelEncoder
import plotly.express as px
warnings.simplefilter(action='ignore', category=FutureWarning)
接着加载数据集
data = pd.read_csv("loan_data.csv")
data.head()
查看数据大小
查看数据基本信息
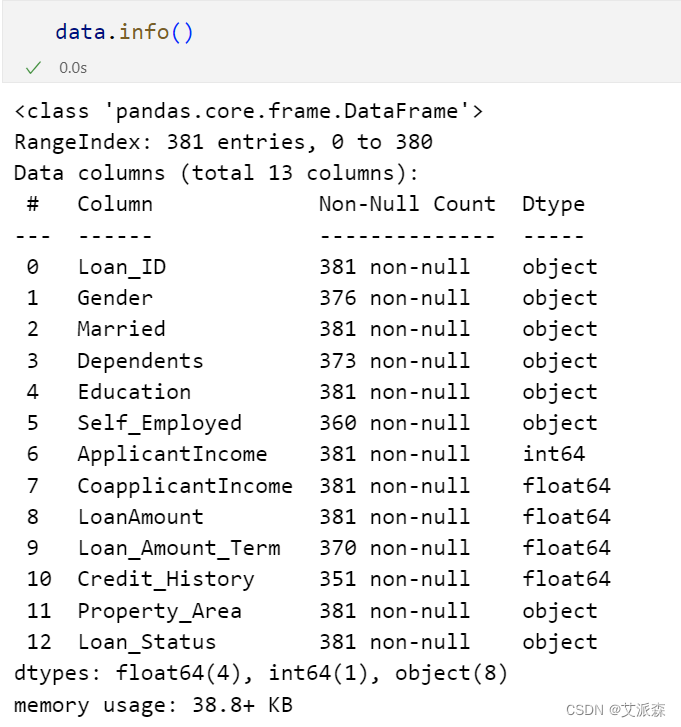
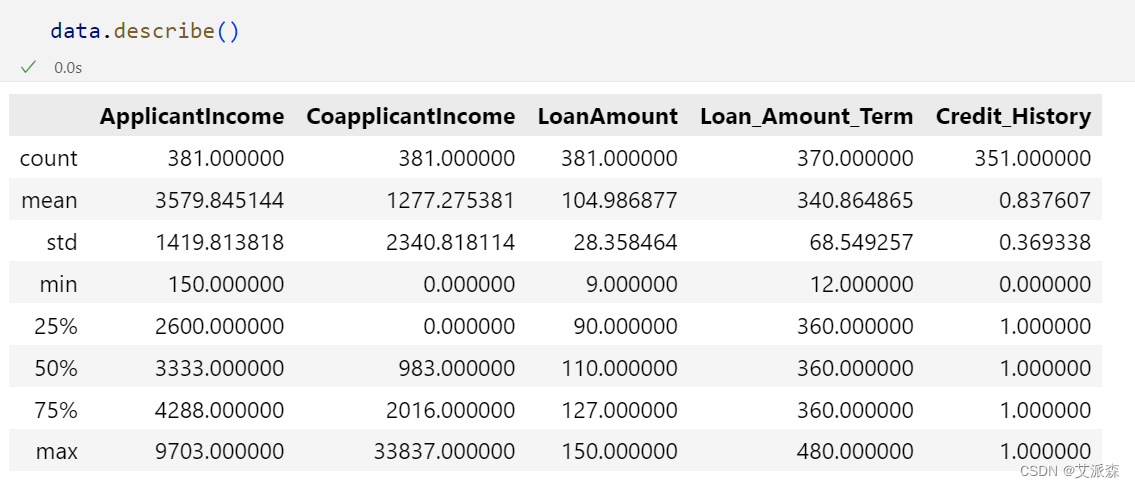
查看数值型变量的描述性统计
查看非数值型变量的描述性统计

4.2数据预处理
查看缺失值情况
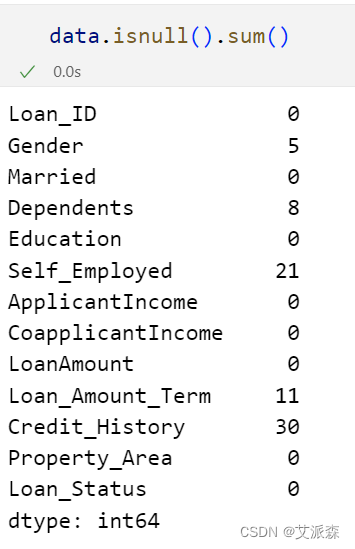
发现数据存在缺失值,需要进行处理
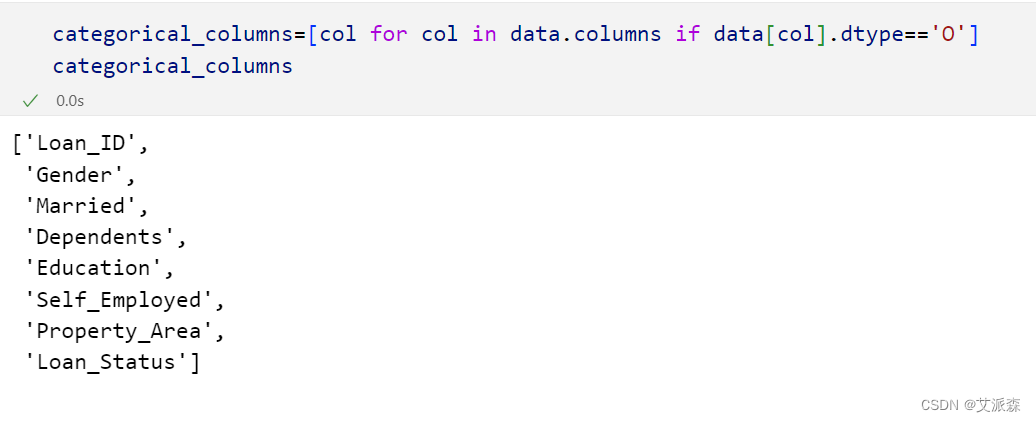
处理缺失值
# 处理分类列中缺失的值
for col in categorical_columns:
    data[col].fillna(data[col].mode()[0], inplace=True)

# 处理数值列中的缺失值
data['Loan_Amount_Term'].fillna(data['Loan_Amount_Term'].median(), inplace=True)
data['Credit_History'].fillna(data['Credit_History'].mode()[0], inplace=True)
data.isnull().sum() 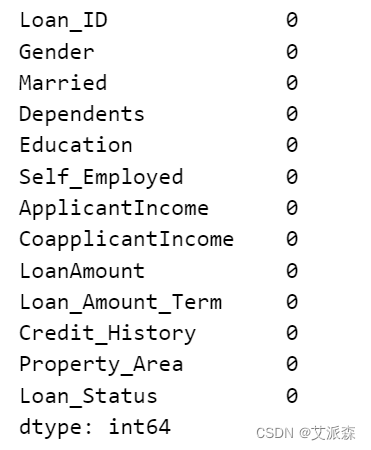

编码处理
# 编码处理
data['Dependents'] = data['Dependents'].replace(['0', '1', '2', '3+'], [0,1,2,3])
data['Credit_History'] = data['Credit_History'].astype(int)
label_encoder_columns = ['Gender', 'Married', 'Education', 'Self_Employed','Property_Area', 'Loan_Status']

label_encoder = LabelEncoder()
for col in label_encoder_columns:
    data[col] = label_encoder.fit_transform(data[col])

data.head()
4.3探索性数据分析
相关系数热力图
plt.figure(figsize=(10,8))
corr_df = data.corr()
sns.heatmap(corr_df,annot=True)
plt.show()
自定义两个绘图函数
# 自定义绘图函数
def violin(col):
    fig = px.violin(data, y=col, x="Loan_Status", color="Loan_Status", box=True)
    return fig.show()

def kde_plot(feature):
    grid = sns.FacetGrid(data, hue="Loan_Status",aspect=2)
    grid.map(sns.kdeplot, feature)
    grid.add_legend()
violin('LoanAmount')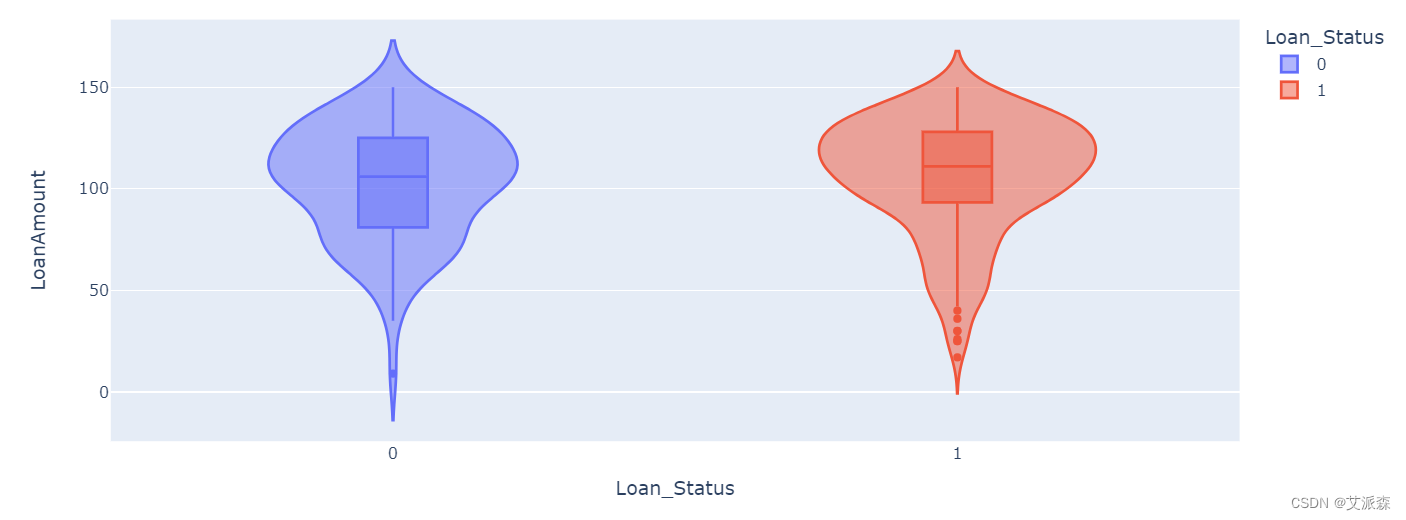
kde_plot('LoanAmount')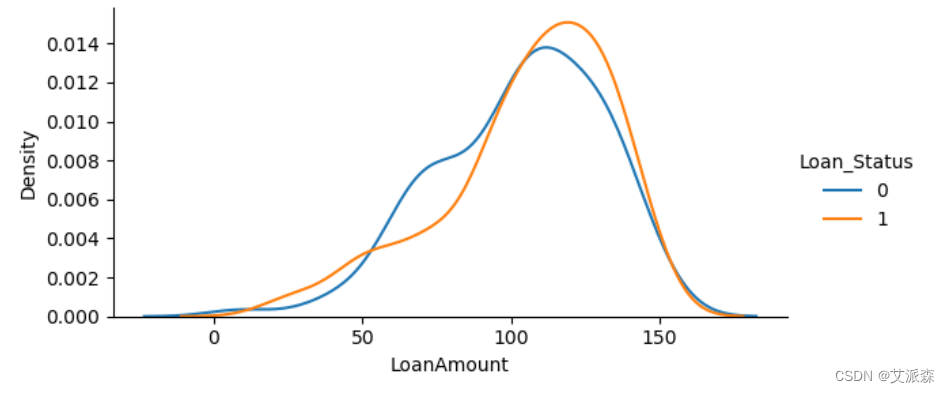
categorical_columns = ['Gender', 'Married', 'Education','Self_Employed', 'Loan_Status']

fig, ax = plt.subplots(3, 2, figsize=(12, 15))
for index, cat_col in enumerate(categorical_columns):
    row, col = index // 2, index % 2
    sns.countplot(x=cat_col, data=data, hue='Loan_Status', ax=ax[row, col], palette='Set2')
    ax[row, col].set_title(f'Distribution of Loan Approval by {cat_col}', fontsize=14)

    for p in ax[row, col].patches:
        ax[row, col].annotate(f'{p.get_height()}', (p.get_x() + p.get_width() / 2., p.get_height()),
                              ha='center', va='center', xytext=(0, 10), textcoords='offset points', fontsize=10)

plt.subplots_adjust(hspace=0.5, wspace=0.3)
plt.suptitle('Loan Approval Distribution Across Categorical Variables', fontsize=16, y=1.02)
plt.show()
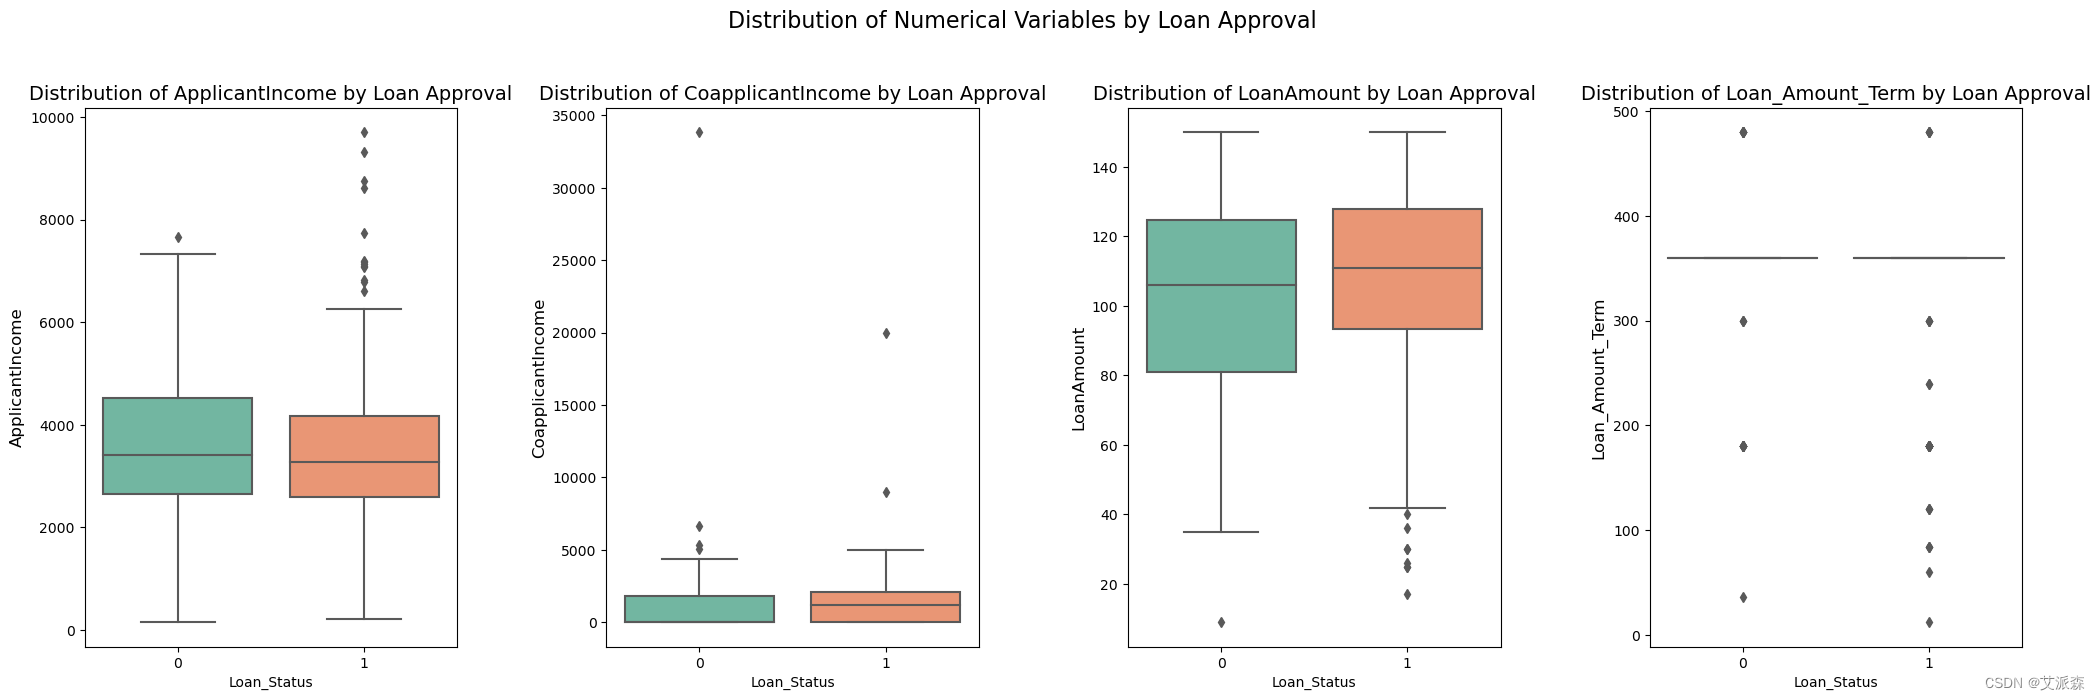
numerical_columns = ['ApplicantIncome', 'CoapplicantIncome', 'LoanAmount', 'Loan_Amount_Term']

fig, axes = plt.subplots(1, 4, figsize=(25, 7))

for idx, num_col in enumerate(numerical_columns):
    sns.boxplot(x='Loan_Status', y=num_col, data=data, ax=axes[idx], palette='Set2')
    axes[idx].set_title(f'Distribution of {num_col} by Loan Approval', fontsize=14)
    axes[idx].set_ylabel(num_col, fontsize=12)

plt.suptitle('Distribution of Numerical Variables by Loan Approval', fontsize=16, y=1.02)
plt.subplots_adjust(wspace=0.4)
print(data[numerical_columns].describe())
plt.show()
4.4特征工程
准备建模数据
# 准备建模数据
ind_col = [col for col in data.columns if col != 'Loan_Status']
dep_col = 'Loan_Status'
X = data[ind_col]
y = data[dep_col]
特征筛选
# 应用SelectKBest类提取前8个最佳特征
bestfeatures = SelectKBest(score_func=chi2, k=8)
fit = bestfeatures.fit(X, y)
# 创建一个DataFrame来显示所选的特性及其分数
featureScores = pd.DataFrame({'Specs': X.columns, 'Score': fit.scores_})
# 打印10个最佳特征
print(featureScores.nlargest(10, 'Score'))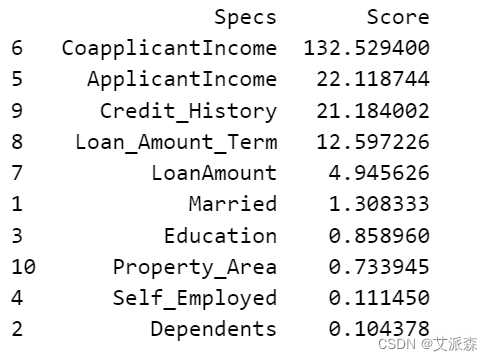
# 拟合ExtraTreesClassifier模型
model = ExtraTreesClassifier()
model.fit(X, y)

# 特征重要性
feat_importances = pd.Series(model.feature_importances_, index=X.columns)
feat_importances.nlargest(8).plot(kind='barh')
plt.show()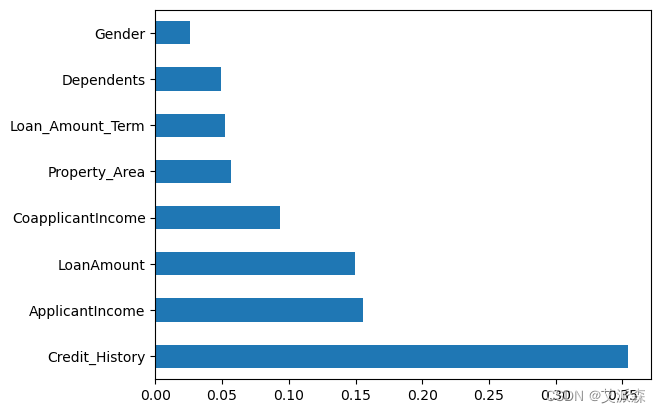
# 特征挑选
selected_features = feat_importances.nlargest(8).index
X_new = data.loc[:, selected_features].copy()
X_new.head()
数据标准化
# 数据标准化
scaler = MinMaxScaler()
for column in numerical_columns:
    X_new[column] = scaler.fit_transform(X_new[[column]])
X_new.head()
拆分数据集
# 拆分数据集为训练集和测试集
X_train, X_test, y_train, y_test = train_test_split(X_new,y,train_size=0.8,random_state=0)
print(X_train.shape)
print(X_test.shape)
4.5模型构建
确定各模型最优参数
## 关于XGBoost的超参数优化

XGBoost_params={
 "learning_rate"    : [0.05, 0.20, 0.25 ] ,
 "max_depth"        : [ 5, 8, 10, 12],
 "min_child_weight" : [ 1, 3, 5, 7 ],
 "gamma"            : [ 0.0, 0.1, 0.2 , 0.4 ],
 "colsample_bytree" : [ 0.3, 0.4, 0.7 ]

}

## 关于随机森林的超参数优化
RF_params = {
    'n_estimators': [50, 100, 200, 300],  # Number of trees in the forest
    'max_depth': [None, 10, 20, 30],  # Maximum depth of the tree
    'min_samples_split': [2, 5, 10],  # Minimum number of samples required to split an internal node
    'min_samples_leaf': [1, 2, 4],  # Minimum number of samples required to be at a leaf node
    'max_features': ['sqrt', 'log2', None],  # Number of features to consider at every split
    'bootstrap': [True, False]  # Method of selecting samples for training each tree
}

## 关于决策树的超参数优化
DT_params = {
    'criterion': ['gini', 'entropy','log_loss'],  # Measure of impurity
    'splitter': ['best', 'random'],  # Strategy to choose the split at each node
    'max_depth': [None, 10, 20, 30],  # Maximum depth of the tree
    'min_samples_split': [2, 5, 10],  # Minimum number of samples required to split an internal node
    'min_samples_leaf': [1, 2, 4],  # Minimum number of samples required to be at a leaf node
    'max_features': [None, 'sqrt', 'log2'],  # Number of features to consider at every split
}
初始化模型
# XGBoost
xgboost = XGBClassifier()
# Random Forest
random_forest = RandomForestClassifier()
# Decision Tree
decision_tree = DecisionTreeClassifier()
XGBoost模型的随机搜索
# RandomizedSearchCV for XGBoost
XGBoost_random_search = RandomizedSearchCV(xgboost,param_distributions=XGBoost_params,n_iter=5,scoring='roc_auc',n_jobs=-1,cv=5,verbose=3)
XGBoost_random_search.fit(X_train, y_train)
随机森林模型的随机搜索
# RandomizedSearchCV for Random Forest
RF_random_search = RandomizedSearchCV(random_forest, param_distributions=RF_params, n_iter=5, scoring='roc_auc', n_jobs=-1, cv=5, verbose=3)
RF_random_search.fit(X_train, y_train)
决策树模型的随机搜索
# RandomizedSearchCV for Decision Tree
DT_random_search = RandomizedSearchCV(decision_tree, param_distributions=DT_params, n_iter=5, scoring='roc_auc', n_jobs=-1, cv=5, verbose=3)
DT_random_search.fit(X_train, y_train)
打印模型的最佳参数
# 打印每个模型的最佳参数
print("Best Parameters for XGBoost:")
print(XGBoost_random_search.best_params_)

print("\nBest Parameters for Random Forest:")
print(RF_random_search.best_params_)

print("\nBest Parameters for Decision Tree:")
print(DT_random_search.best_params_)
定义模型
# Define final XGBoost Classifier
xgboost_classifier = XGBClassifier(min_child_weight = 1, max_depth = 5, learning_rate = 0.2, gamma = 0.2, colsample_bytree  = 0.7)

# Define final Random Forest Classifier
rf_classifier = RandomForestClassifier(n_estimators = 50, min_samples_split = 10, min_samples_leaf = 4, max_features = 'sqrt', max_depth = 30, bootstrap = True)

# Define final Decision Tree Classifier
dt_classifier = DecisionTreeClassifier(splitter =  'best', min_samples_split = 10, min_samples_leaf = 4, max_features = None, max_depth = 10, criterion = 'log_loss')

# Define Logistic Regression Classifier
lr_classifier = LogisticRegression()
训练模型
# Train XGBoost Classifier
xgboost_classifier.fit(X_train, y_train)

# Train Random Forest Classifier
rf_classifier.fit(X_train, y_train)

# Train Decision Tree Classifier
dt_classifier.fit(X_train, y_train)

# Train Logistic Regression Classifier
lr_classifier.fit(X_train, y_train)
4.6模型评估
打印模型混淆矩阵
xgboost_pred = xgboost_classifier.predict(X_test)
rf_pred = rf_classifier.predict(X_test)
dt_pred = dt_classifier.predict(X_test)
lr_pred = lr_classifier.predict(X_test)
# Confusion Matrix for XGBoost
confusion_xgboost = confusion_matrix(y_test, xgboost_pred)
print('Confusion Matrix for XGBoost:')
print(confusion_xgboost)

# Confusion Matrix for Random Forest
confusion_rf = confusion_matrix(y_test, rf_pred)
print('\nConfusion Matrix for Random Forest:')
print(confusion_rf)

# Confusion Matrix for Decision Tree
confusion_dt = confusion_matrix(y_test, dt_pred)
print('\nConfusion Matrix for Decision Tree:')
print(confusion_dt)

# Confusion Matrix for Logistic Regression
confusion_lr = confusion_matrix(y_test, lr_pred)
print('\nConfusion Matrix for Logistic Regression:')
print(confusion_lr)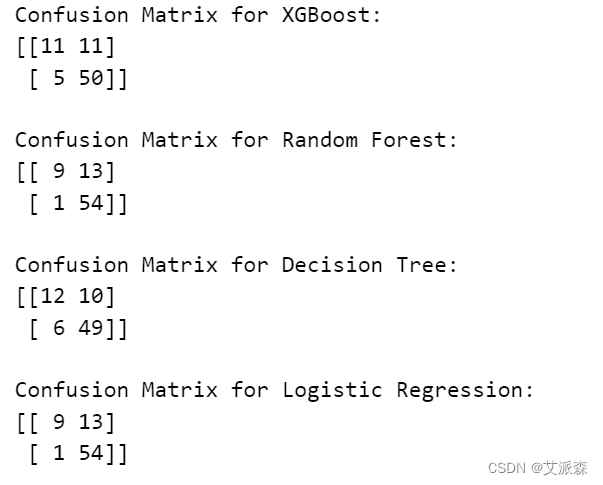
打印模型准确率
# Accuracy of XGBoost
xgboost_accuracy = accuracy_score(y_test, xgboost_pred)
print("Accuracy of XGBoost:")
print(xgboost_accuracy)

# Accuracy of Random Forest
RF_accuracy = accuracy_score(y_test, rf_pred)
print("Accuracy of Random Forest:")
print(RF_accuracy)

# Accuracy of Decision Tree
DT_accuracy = accuracy_score(y_test, dt_pred)
print("Accuracy of Decision Tree:")
print(DT_accuracy)

# Accuracy of Logistic Regression
LR_accuracy = accuracy_score(y_test, lr_pred)
print("Accuracy of Logistic Regression:")
print(LR_accuracy)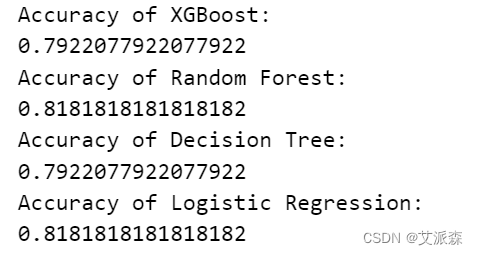
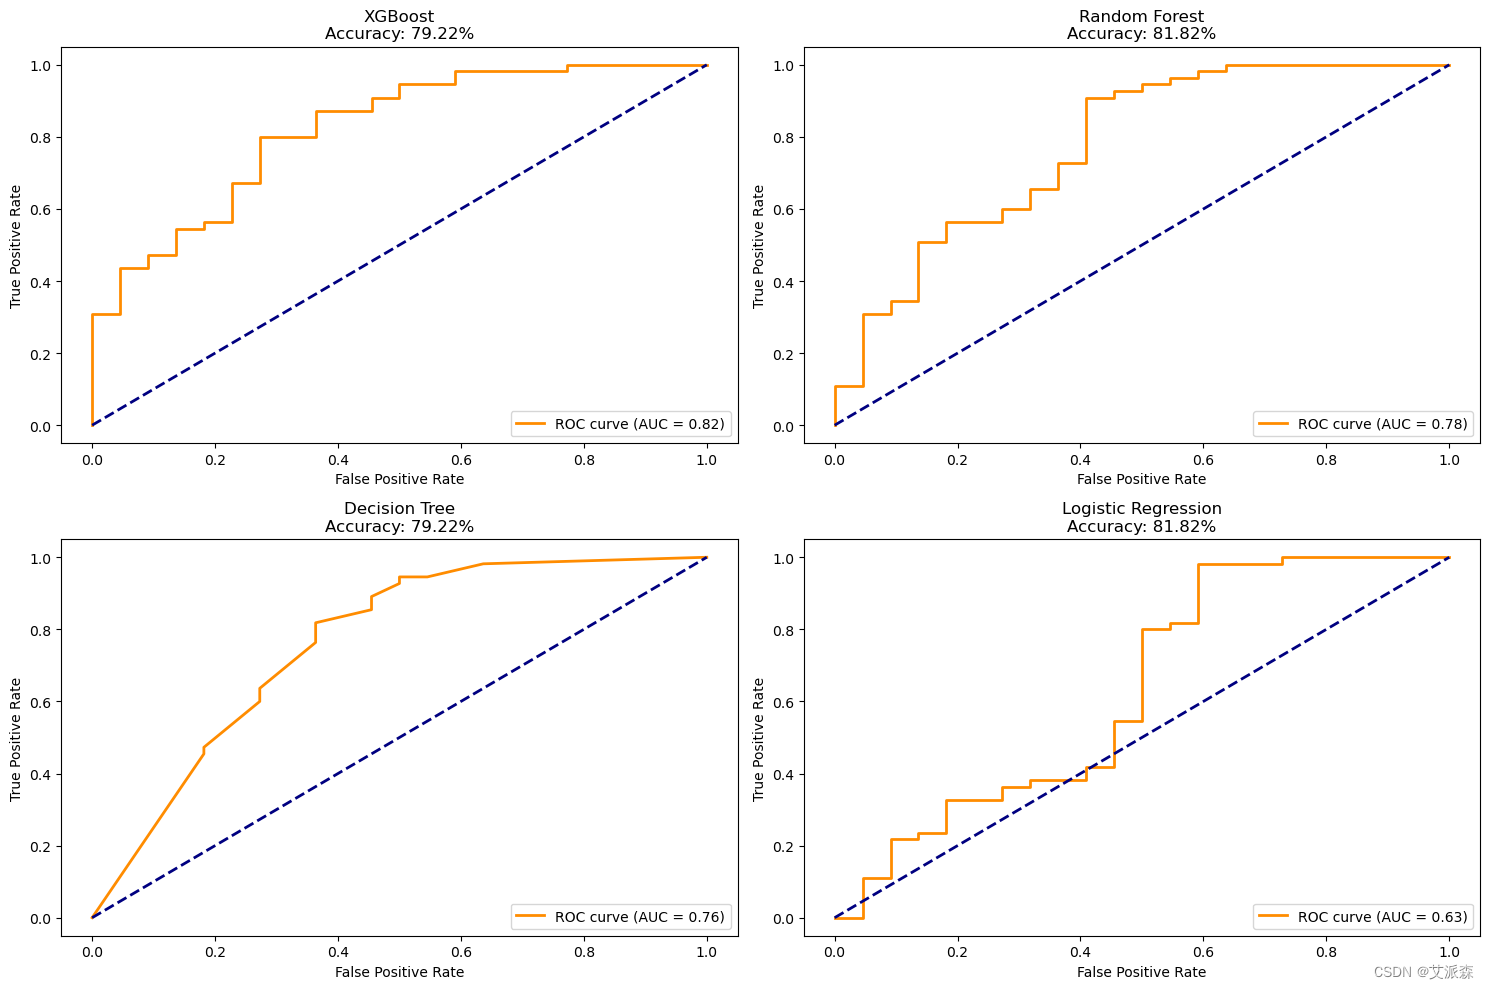
ROC曲线
# XGBoost
y_prob_xgb = xgboost_classifier.predict_proba(X_test)[:, 1]
fpr_xgb, tpr_xgb, thresholds_xgb = roc_curve(y_test, y_prob_xgb)
roc_auc_xgb = auc(fpr_xgb, tpr_xgb)

# RandomForestClassifier
y_prob_rf = rf_classifier.predict_proba(X_test)[:, 1]
fpr_rf, tpr_rf, thresholds_rf = roc_curve(y_test, y_prob_rf)
roc_auc_rf = auc(fpr_rf, tpr_rf)

# Decision Tree Classifier
y_prob_dt = dt_classifier.predict_proba(X_test)[:, 1]
fpr_dt, tpr_dt, thresholds_dt = roc_curve(y_test, y_prob_dt)
roc_auc_dt = auc(fpr_dt, tpr_dt)

# Logistic Regression
y_prob_lr = lr_classifier.predict_proba(X_test)[:, 1]
fpr_lr, tpr_lr, thresholds_lr = roc_curve(y_test, y_prob_lr)
roc_auc_lr = auc(fpr_lr, tpr_lr)

# Create a subplot with 2 rows and 2 columns
plt.figure(figsize=(15, 10))

# Plot for XGBoost
plt.subplot(2, 2, 1)
plt.plot(fpr_xgb, tpr_xgb, color='darkorange', lw=2, label='ROC curve (AUC = {:.2f})'.format(roc_auc_xgb))
plt.plot([0, 1], [0, 1], color='navy', lw=2, linestyle='--')
plt.xlabel('False Positive Rate')
plt.ylabel('True Positive Rate')
plt.title('XGBoost\nAccuracy: {:.2f}%'.format(xgboost_accuracy * 100))
plt.legend(loc="lower right")

# Plot for RandomForestClassifier
plt.subplot(2, 2, 2)
plt.plot(fpr_rf, tpr_rf, color='darkorange', lw=2, label='ROC curve (AUC = {:.2f})'.format(roc_auc_rf))
plt.plot([0, 1], [0, 1], color='navy', lw=2, linestyle='--')
plt.xlabel('False Positive Rate')
plt.ylabel('True Positive Rate')
plt.title('Random Forest\nAccuracy: {:.2f}%'.format(RF_accuracy * 100))
plt.legend(loc="lower right")

# Plot for Decision Tree
plt.subplot(2, 2, 3)
plt.plot(fpr_dt, tpr_dt, color='darkorange', lw=2, label='ROC curve (AUC = {:.2f})'.format(roc_auc_dt))
plt.plot([0, 1], [0, 1], color='navy', lw=2, linestyle='--')
plt.xlabel('False Positive Rate')
plt.ylabel('True Positive Rate')
plt.title('Decision Tree\nAccuracy: {:.2f}%'.format(DT_accuracy * 100))
plt.legend(loc="lower right")

# Plot for Logistic Regression
plt.subplot(2, 2, 4)
plt.plot(fpr_lr, tpr_lr, color='darkorange', lw=2, label='ROC curve (AUC = {:.2f})'.format(roc_auc_lr))
plt.plot([0, 1], [0, 1], color='navy', lw=2, linestyle='--')
plt.xlabel('False Positive Rate')
plt.ylabel('True Positive Rate')
plt.title('Logistic Regression\nAccuracy: {:.2f}%'.format(LR_accuracy * 100))
plt.legend(loc="lower right")

# Adjust layout to prevent overlap
plt.tight_layout()

# Show the plots
plt.show()
5.实验总结
心得与体会:
通过这次Python项目实战,我学到了许多新的知识,这是一个让我把书本上的理论知识运用于实践中的好机会。原先,学的时候感叹学的资料太难懂,此刻想来,有些其实并不难,关键在于理解。
在这次实战中还锻炼了我其他方面的潜力,提高了我的综合素质。首先,它锻炼了我做项目的潜力,提高了独立思考问题、自我动手操作的潜力,在工作的过程中,复习了以前学习过的知识,并掌握了一些应用知识的技巧等
在此次实战中,我还学会了下面几点工作学习心态:
1)继续学习,不断提升理论涵养。在信息时代,学习是不断地汲取新信息,获得事业进步的动力。作为一名青年学子更就应把学习作为持续工作
用心性的重要途径。走上工作岗位后,我会用心响应单位号召,结合工作实际,不断学习理论、业务知识和社会知识,用先进的理论武装头脑,用精良的业务知识提升潜力,以广博的社会知识拓展视野。
2)努力实践,自觉进行主角转化。只有将理论付诸于实践才能实现理论自身的价值,也只有将理论付诸于实践才能使理论得以检验。同样,一个人的价值也是透过实践活动来实现的,也只有透过实践才能锻炼人的品质,彰显人的意志。
3)提高工作用心性和主动性。实习,是开端也是结束。展此刻自我面前的是一片任自我驰骋的沃土,也分明感受到了沉甸甸的职责。在今后的工作和生活中,我将继续学习,深入实践,不断提升自我,努力创造业绩,继续创造更多的价值。
这次Python实战不仅仅使我学到了知识,丰富了经验。也帮忙我缩小了实践和理论的差距。在未来的工作中我会把学到的理论知识和实践经验不断的应用到实际工作中,为实现理想而努力。
源代码
import numpy as np
import pandas as pd
import matplotlib.pyplot as plt
import seaborn as sns
import warnings
from sklearn.metrics import accuracy_score, confusion_matrix, roc_curve, auc
from sklearn.preprocessing import MinMaxScaler
from sklearn.feature_selection import SelectKBest, chi2
from sklearn.ensemble import ExtraTreesClassifier
from sklearn.linear_model import LogisticRegression
import xgboost as xgb
from xgboost import XGBClassifier
from sklearn.model_selection import RandomizedSearchCV
from sklearn.model_selection import train_test_split
from sklearn.tree import DecisionTreeClassifier
from sklearn.ensemble import RandomForestClassifier
from sklearn.preprocessing import LabelEncoder
import plotly.express as px
warnings.simplefilter(action='ignore', category=FutureWarning)
data = pd.read_csv("loan_data.csv")
data.head()
data.shape
data.info()
data.describe()
data.describe(include='O')
data.isnull().sum()
categorical_columns=[col for col in data.columns if data[col].dtype=='O']
categorical_columns
# 处理分类列中缺失的值
for col in categorical_columns:
    data[col].fillna(data[col].mode()[0], inplace=True)

# 处理数值列中的缺失值
data['Loan_Amount_Term'].fillna(data['Loan_Amount_Term'].median(), inplace=True)
data['Credit_History'].fillna(data['Credit_History'].mode()[0], inplace=True)
data.isnull().sum()
# 删除不相关的列
data.drop('Loan_ID', axis=1, inplace=True)
# 编码处理
data['Dependents'] = data['Dependents'].replace(['0', '1', '2', '3+'], [0,1,2,3])
data['Credit_History'] = data['Credit_History'].astype(int)
label_encoder_columns = ['Gender', 'Married', 'Education', 'Self_Employed','Property_Area', 'Loan_Status']

label_encoder = LabelEncoder()
for col in label_encoder_columns:
    data[col] = label_encoder.fit_transform(data[col])

data.head()
plt.figure(figsize=(10,8))
corr_df = data.corr()
sns.heatmap(corr_df,annot=True)
plt.show()
# 自定义绘图函数
def violin(col):
    fig = px.violin(data, y=col, x="Loan_Status", color="Loan_Status", box=True)
    return fig.show()

def kde_plot(feature):
    grid = sns.FacetGrid(data, hue="Loan_Status",aspect=2)
    grid.map(sns.kdeplot, feature)
    grid.add_legend()
violin('LoanAmount')
kde_plot('LoanAmount')
categorical_columns = ['Gender', 'Married', 'Education','Self_Employed', 'Loan_Status']

fig, ax = plt.subplots(3, 2, figsize=(12, 15))
for index, cat_col in enumerate(categorical_columns):
    row, col = index // 2, index % 2
    sns.countplot(x=cat_col, data=data, hue='Loan_Status', ax=ax[row, col], palette='Set2')
    ax[row, col].set_title(f'Distribution of Loan Approval by {cat_col}', fontsize=14)

    for p in ax[row, col].patches:
        ax[row, col].annotate(f'{p.get_height()}', (p.get_x() + p.get_width() / 2., p.get_height()),
                              ha='center', va='center', xytext=(0, 10), textcoords='offset points', fontsize=10)

plt.subplots_adjust(hspace=0.5, wspace=0.3)
plt.suptitle('Loan Approval Distribution Across Categorical Variables', fontsize=16, y=1.02)
plt.show()
numerical_columns = ['ApplicantIncome', 'CoapplicantIncome', 'LoanAmount', 'Loan_Amount_Term']

fig, axes = plt.subplots(1, 4, figsize=(25, 7))

for idx, num_col in enumerate(numerical_columns):
    sns.boxplot(x='Loan_Status', y=num_col, data=data, ax=axes[idx], palette='Set2')
    axes[idx].set_title(f'Distribution of {num_col} by Loan Approval', fontsize=14)
    axes[idx].set_ylabel(num_col, fontsize=12)

plt.suptitle('Distribution of Numerical Variables by Loan Approval', fontsize=16, y=1.02)
plt.subplots_adjust(wspace=0.4)
print(data[numerical_columns].describe())
plt.show()
# 准备建模数据
ind_col = [col for col in data.columns if col != 'Loan_Status']
dep_col = 'Loan_Status'
X = data[ind_col]
y = data[dep_col]
# 应用SelectKBest类提取前8个最佳特征
bestfeatures = SelectKBest(score_func=chi2, k=8)
fit = bestfeatures.fit(X, y)
# 创建一个DataFrame来显示所选的特性及其分数
featureScores = pd.DataFrame({'Specs': X.columns, 'Score': fit.scores_})
# 打印10个最佳特征
print(featureScores.nlargest(10, 'Score'))
# 拟合ExtraTreesClassifier模型
model = ExtraTreesClassifier()
model.fit(X, y)

# 特征重要性
feat_importances = pd.Series(model.feature_importances_, index=X.columns)
feat_importances.nlargest(8).plot(kind='barh')
plt.show()
# 特征挑选
selected_features = feat_importances.nlargest(8).index
X_new = data.loc[:, selected_features].copy()
X_new.head()
# 数据标准化
scaler = MinMaxScaler()
for column in numerical_columns:
    X_new[column] = scaler.fit_transform(X_new[[column]])
X_new.head()
# 拆分数据集为训练集和测试集
X_train, X_test, y_train, y_test = train_test_split(X_new,y,train_size=0.8,random_state=0)
print(X_train.shape)
print(X_test.shape)
## 关于XGBoost的超参数优化

XGBoost_params={
 "learning_rate"    : [0.05, 0.20, 0.25 ] ,
 "max_depth"        : [ 5, 8, 10, 12],
 "min_child_weight" : [ 1, 3, 5, 7 ],
 "gamma"            : [ 0.0, 0.1, 0.2 , 0.4 ],
 "colsample_bytree" : [ 0.3, 0.4, 0.7 ]

}

## 关于随机森林的超参数优化
RF_params = {
    'n_estimators': [50, 100, 200, 300],  # Number of trees in the forest
    'max_depth': [None, 10, 20, 30],  # Maximum depth of the tree
    'min_samples_split': [2, 5, 10],  # Minimum number of samples required to split an internal node
    'min_samples_leaf': [1, 2, 4],  # Minimum number of samples required to be at a leaf node
    'max_features': ['sqrt', 'log2', None],  # Number of features to consider at every split
    'bootstrap': [True, False]  # Method of selecting samples for training each tree
}

## 关于决策树的超参数优化
DT_params = {
    'criterion': ['gini', 'entropy','log_loss'],  # Measure of impurity
    'splitter': ['best', 'random'],  # Strategy to choose the split at each node
    'max_depth': [None, 10, 20, 30],  # Maximum depth of the tree
    'min_samples_split': [2, 5, 10],  # Minimum number of samples required to split an internal node
    'min_samples_leaf': [1, 2, 4],  # Minimum number of samples required to be at a leaf node
    'max_features': [None, 'sqrt', 'log2'],  # Number of features to consider at every split
}
# XGBoost
xgboost = XGBClassifier()
# Random Forest
random_forest = RandomForestClassifier()
# Decision Tree
decision_tree = DecisionTreeClassifier()
# RandomizedSearchCV for XGBoost
XGBoost_random_search = RandomizedSearchCV(xgboost,param_distributions=XGBoost_params,n_iter=5,scoring='roc_auc',n_jobs=-1,cv=5,verbose=3)
XGBoost_random_search.fit(X_train, y_train)
# RandomizedSearchCV for Random Forest
RF_random_search = RandomizedSearchCV(random_forest, param_distributions=RF_params, n_iter=5, scoring='roc_auc', n_jobs=-1, cv=5, verbose=3)
RF_random_search.fit(X_train, y_train)
# RandomizedSearchCV for Decision Tree
DT_random_search = RandomizedSearchCV(decision_tree, param_distributions=DT_params, n_iter=5, scoring='roc_auc', n_jobs=-1, cv=5, verbose=3)
DT_random_search.fit(X_train, y_train)
# 打印每个模型的最佳参数
print("Best Parameters for XGBoost:")
print(XGBoost_random_search.best_params_)

print("\nBest Parameters for Random Forest:")
print(RF_random_search.best_params_)

print("\nBest Parameters for Decision Tree:")
print(DT_random_search.best_params_)
# Define final XGBoost Classifier
xgboost_classifier = XGBClassifier(min_child_weight = 1, max_depth = 5, learning_rate = 0.2, gamma = 0.2, colsample_bytree  = 0.7)

# Define final Random Forest Classifier
rf_classifier = RandomForestClassifier(n_estimators = 50, min_samples_split = 10, min_samples_leaf = 4, max_features = 'sqrt', max_depth = 30, bootstrap = True)

# Define final Decision Tree Classifier
dt_classifier = DecisionTreeClassifier(splitter =  'best', min_samples_split = 10, min_samples_leaf = 4, max_features = None, max_depth = 10, criterion = 'log_loss')

# Define Logistic Regression Classifier
lr_classifier = LogisticRegression()
# Train XGBoost Classifier
xgboost_classifier.fit(X_train, y_train)

# Train Random Forest Classifier
rf_classifier.fit(X_train, y_train)

# Train Decision Tree Classifier
dt_classifier.fit(X_train, y_train)

# Train Logistic Regression Classifier
lr_classifier.fit(X_train, y_train)
xgboost_pred = xgboost_classifier.predict(X_test)
rf_pred = rf_classifier.predict(X_test)
dt_pred = dt_classifier.predict(X_test)
lr_pred = lr_classifier.predict(X_test)
# Confusion Matrix for XGBoost
confusion_xgboost = confusion_matrix(y_test, xgboost_pred)
print('Confusion Matrix for XGBoost:')
print(confusion_xgboost)

# Confusion Matrix for Random Forest
confusion_rf = confusion_matrix(y_test, rf_pred)
print('\nConfusion Matrix for Random Forest:')
print(confusion_rf)

# Confusion Matrix for Decision Tree
confusion_dt = confusion_matrix(y_test, dt_pred)
print('\nConfusion Matrix for Decision Tree:')
print(confusion_dt)

# Confusion Matrix for Logistic Regression
confusion_lr = confusion_matrix(y_test, lr_pred)
print('\nConfusion Matrix for Logistic Regression:')
print(confusion_lr)
# Accuracy of XGBoost
xgboost_accuracy = accuracy_score(y_test, xgboost_pred)
print("Accuracy of XGBoost:")
print(xgboost_accuracy)

# Accuracy of Random Forest
RF_accuracy = accuracy_score(y_test, rf_pred)
print("Accuracy of Random Forest:")
print(RF_accuracy)

# Accuracy of Decision Tree
DT_accuracy = accuracy_score(y_test, dt_pred)
print("Accuracy of Decision Tree:")
print(DT_accuracy)

# Accuracy of Logistic Regression
LR_accuracy = accuracy_score(y_test, lr_pred)
print("Accuracy of Logistic Regression:")
print(LR_accuracy)
# XGBoost
y_prob_xgb = xgboost_classifier.predict_proba(X_test)[:, 1]
fpr_xgb, tpr_xgb, thresholds_xgb = roc_curve(y_test, y_prob_xgb)
roc_auc_xgb = auc(fpr_xgb, tpr_xgb)

# RandomForestClassifier
y_prob_rf = rf_classifier.predict_proba(X_test)[:, 1]
fpr_rf, tpr_rf, thresholds_rf = roc_curve(y_test, y_prob_rf)
roc_auc_rf = auc(fpr_rf, tpr_rf)

# Decision Tree Classifier
y_prob_dt = dt_classifier.predict_proba(X_test)[:, 1]
fpr_dt, tpr_dt, thresholds_dt = roc_curve(y_test, y_prob_dt)
roc_auc_dt = auc(fpr_dt, tpr_dt)

# Logistic Regression
y_prob_lr = lr_classifier.predict_proba(X_test)[:, 1]
fpr_lr, tpr_lr, thresholds_lr = roc_curve(y_test, y_prob_lr)
roc_auc_lr = auc(fpr_lr, tpr_lr)

# Create a subplot with 2 rows and 2 columns
plt.figure(figsize=(15, 10))

# Plot for XGBoost
plt.subplot(2, 2, 1)
plt.plot(fpr_xgb, tpr_xgb, color='darkorange', lw=2, label='ROC curve (AUC = {:.2f})'.format(roc_auc_xgb))
plt.plot([0, 1], [0, 1], color='navy', lw=2, linestyle='--')
plt.xlabel('False Positive Rate')
plt.ylabel('True Positive Rate')
plt.title('XGBoost\nAccuracy: {:.2f}%'.format(xgboost_accuracy * 100))
plt.legend(loc="lower right")

# Plot for RandomForestClassifier
plt.subplot(2, 2, 2)
plt.plot(fpr_rf, tpr_rf, color='darkorange', lw=2, label='ROC curve (AUC = {:.2f})'.format(roc_auc_rf))
plt.plot([0, 1], [0, 1], color='navy', lw=2, linestyle='--')
plt.xlabel('False Positive Rate')
plt.ylabel('True Positive Rate')
plt.title('Random Forest\nAccuracy: {:.2f}%'.format(RF_accuracy * 100))
plt.legend(loc="lower right")

# Plot for Decision Tree
plt.subplot(2, 2, 3)
plt.plot(fpr_dt, tpr_dt, color='darkorange', lw=2, label='ROC curve (AUC = {:.2f})'.format(roc_auc_dt))
plt.plot([0, 1], [0, 1], color='navy', lw=2, linestyle='--')
plt.xlabel('False Positive Rate')
plt.ylabel('True Positive Rate')
plt.title('Decision Tree\nAccuracy: {:.2f}%'.format(DT_accuracy * 100))
plt.legend(loc="lower right")

# Plot for Logistic Regression
plt.subplot(2, 2, 4)
plt.plot(fpr_lr, tpr_lr, color='darkorange', lw=2, label='ROC curve (AUC = {:.2f})'.format(roc_auc_lr))
plt.plot([0, 1], [0, 1], color='navy', lw=2, linestyle='--')
plt.xlabel('False Positive Rate')
plt.ylabel('True Positive Rate')
plt.title('Logistic Regression\nAccuracy: {:.2f}%'.format(LR_accuracy * 100))
plt.legend(loc="lower right")

# Adjust layout to prevent overlap
plt.tight_layout()

# Show the plots
plt.show()
