背景
Legend数据太长,影响整体图表体验,为改善用户体验,需要实现:1.数据省略展示,‘...’表示,鼠标悬停时,展示完整信息 2:文本内容从左向右滚动展示
柱状图优化
柱状图来自第三方Echarts插件,效果展示
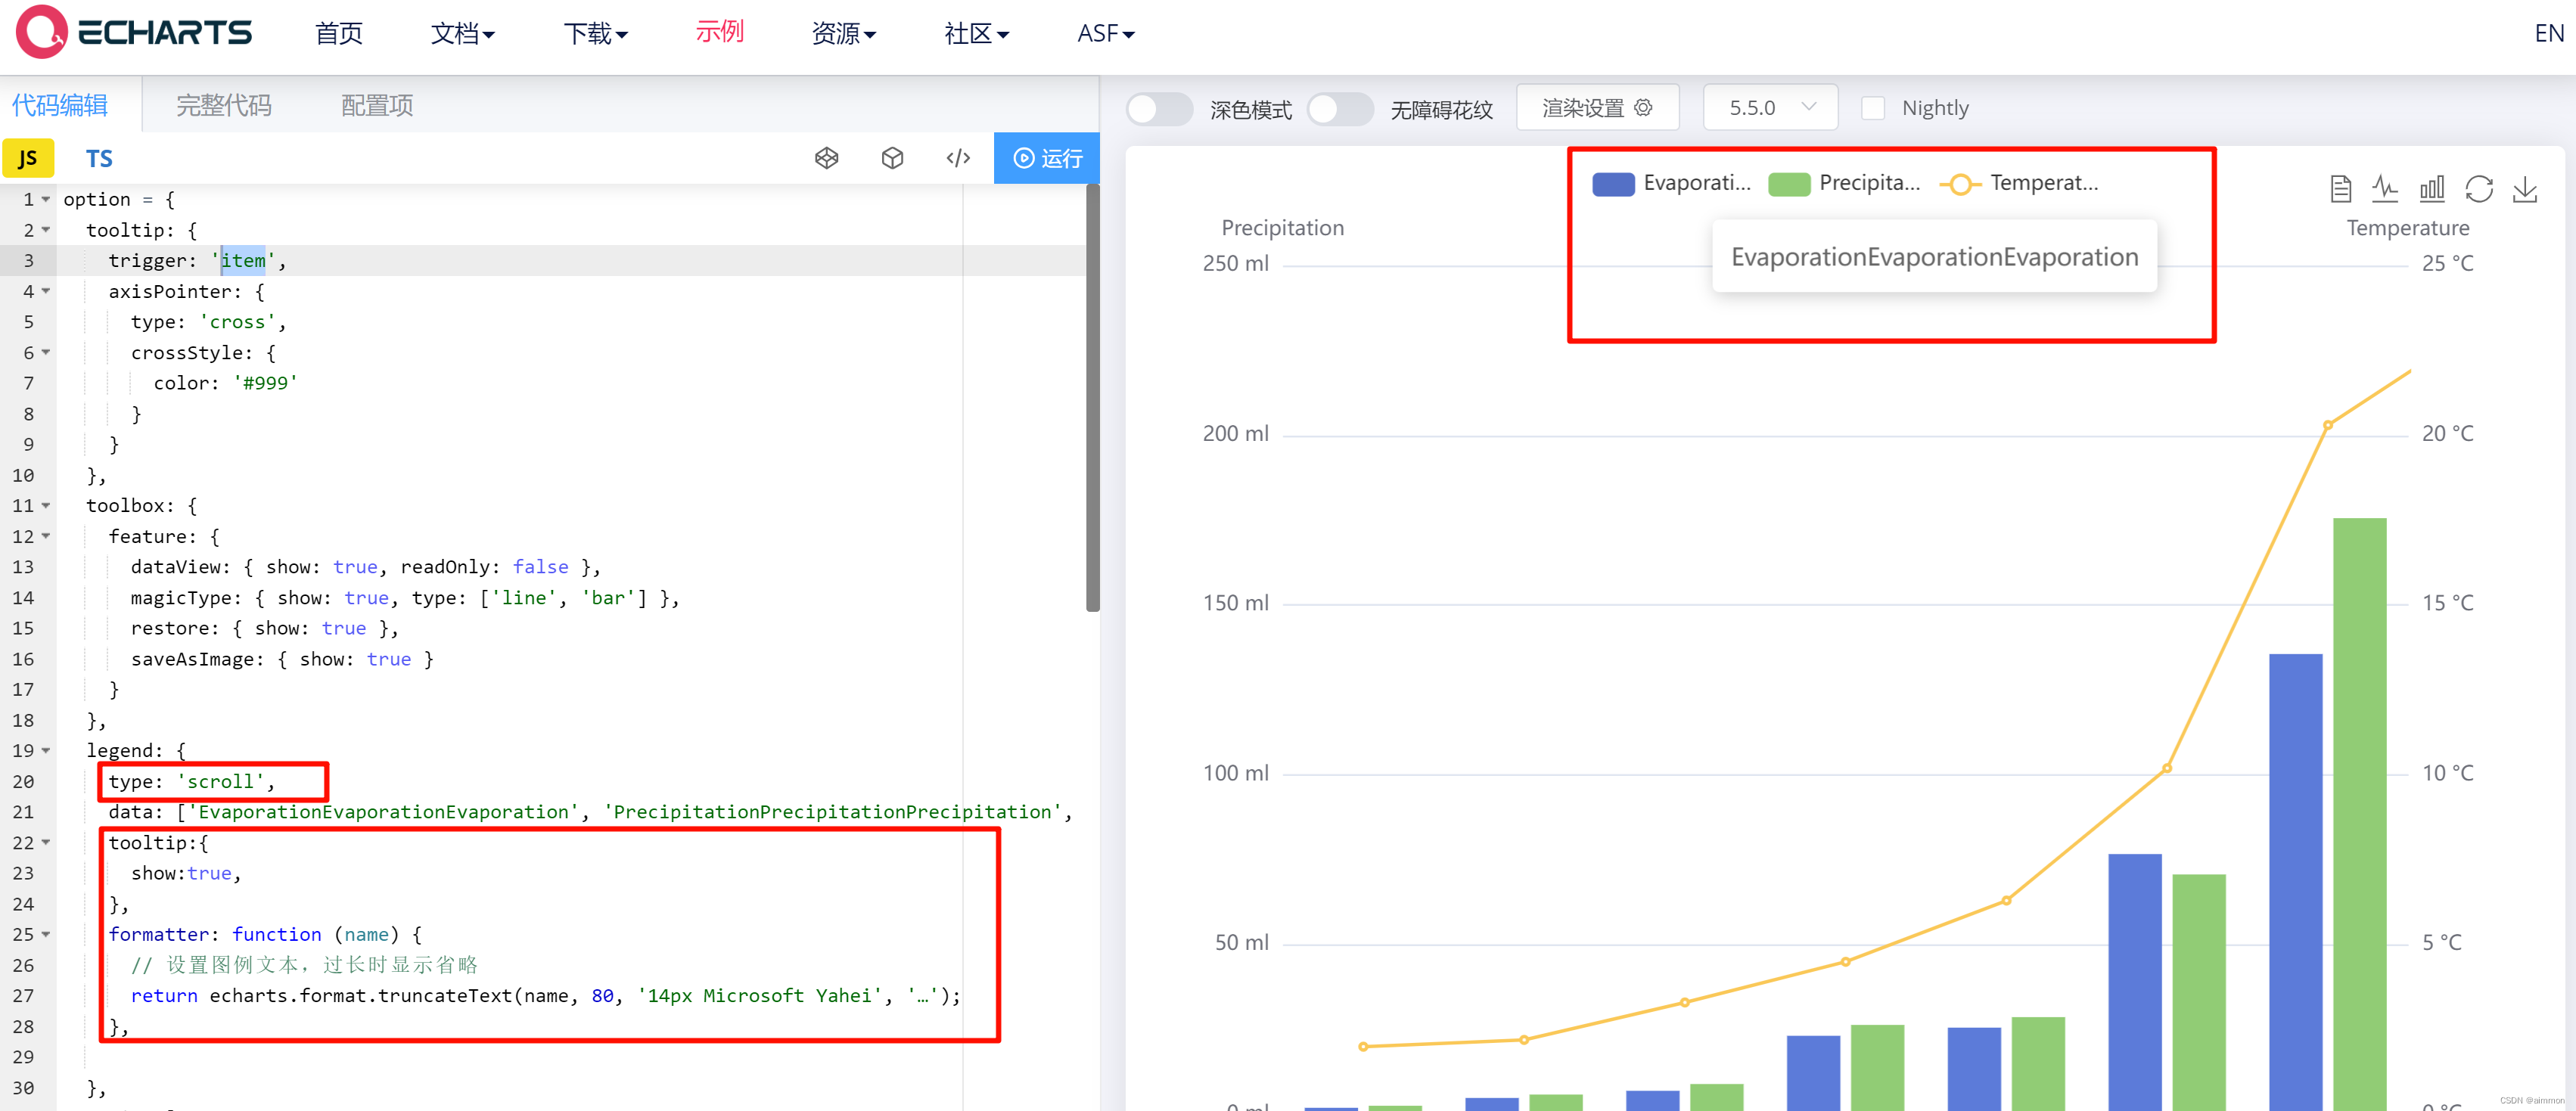
功能核心在于红框的内容
option = {
  tooltip: {
    trigger: 'item',
    axisPointer: {
      type: 'cross',
      crossStyle: {
        color: '#999'
      }
    }
  },
  toolbox: {
    feature: {
      dataView: { show: true, readOnly: false },
      magicType: { show: true, type: ['line', 'bar'] },
      restore: { show: true },
      saveAsImage: { show: true }
    }
  },
  legend: {
    type: 'scroll',
    data: ['EvaporationEvaporationEvaporation', 'PrecipitationPrecipitationPrecipitation', 'TemperatureTemperatureTemperature'],
    tooltip:{
      show:true,
    },
    formatter: function (name) {
      // 设置图例文本,过长时显示省略
      return echarts.format.truncateText(name, 80, '14px Microsoft Yahei', '…');
    },

  },
  xAxis: [
    {
      type: 'category',
      data: ['Mon', 'Tue', 'Wed', 'Thu', 'Fri', 'Sat', 'Sun'],
      axisPointer: {
        type: 'shadow'
      }
    }
  ],
  yAxis: [
    {
      type: 'value',
      name: 'Precipitation',
      min: 0,
      max: 250,
      interval: 50,
      axisLabel: {
        formatter: '{value} ml'
      }
    },
    {
      type: 'value',
      name: 'Temperature',
      min: 0,
      max: 25,
      interval: 5,
      axisLabel: