一、数据大屏
国内echarts镜像站:ISQQW.COM x ECharts 文档(国内同步镜像) - 配置项
echarts图表集:echarts图表集
1.数据大屏适配问题解决
(1)vw与vh单位解决适配问题
vw/vh:新增单位,要求ie8
比如box内部有两个自适应的盒子top和bottom,他们的宽和高都是随着父容器的变化而变化.将box的宽和高设为视图的宽高100vw,100vh.
那么top和bottom的宽高就要计算一个vw是多少。比如100vw=1920px,那么1vw=19.2px,5.2vw=100px.宽就是5.2vw。
缺点:需要计算子容器的宽高;子容器里面的文字不能进行缩放。
.box{
            width: 100vw;
            height: 100vh;
            background-color: blue;
        }
        .top{
            width: 5.2vw;
            height: 9.26vh;
            background-color: black;
            margin-bottom: 2.6vw;
        }
        .bottom{
            width: 5.2vw;
            height: 9.26vh;
            background-color: white;
        }
(2)css3:scale缩放实现
需要计算出缩放比例(返回的比例需要判断用ww还是wh,原则是根据小的这样不会破坏比例),根据比例放大缩小。
缺点:会留白
   <style>
      * {
        margin: 0;
        padding: 0;
      }
      .container {
        width: 100vw;
        height: 100vh;
        background: url(./bg.png) no-repeat;
        background-size: cover;
      }
      .box {
        position: fixed;
        width: 1920px;
        height: 1080px;
        background-color: red;
        transform-origin: left top;
        left: 50%;
        top: 50%;
      }
      .top {
        width: 100px;
        height: 100px;
        background-color: hotpink;
        margin-left: 50px;
      }
      .bottom {
        width: 100px;
        height: 100px;
        background-color: skyblue;
        margin-left: 50px;
        margin-top: 50px;
      }
    </style>
<script>
// 控制数据大屏缩放
let box = document.querySelector('.box')
box.style.transform=`scale(${getScale()}) translate(-50%,-50%)`
// 计算缩放比例
function getScale (w=1920,h=1080){
// 宽缩放比例
const ww = window.innerWidth/w;
// 高缩放比例
const wh = window.innerHeight/h;
return ww<wh?ww:wh;
}
window.onresize = () => {
box.style.transform = `scale(${getScale()}) translate(-50%,-50%)`
}
</script>2.screen
(1)写好静态,引入image,screen/images
(2)将子组件封装再引入
src/views/screen/index.vue
<template>
    <div class="container">
        <!-- 数据大屏展示内容区域 -->
        <div class="screen" ref="screen">
            <!-- 数据大屏顶部 -->
            <div class="top">
                <Top />
            </div>
            <div class="bottom">
                <div class="left">
                    <Tourist class="tourist"></Tourist>
                    <Sex class="sex"></Sex>
                    <Age class="age"></Age>
                </div>
                <div class="center">
                    <Map class="map"></Map>
                    <Line class="line"></Line>
                </div>
                <div class="right">
                    <Rank class="rank"></Rank>
                    <Year class="year"></Year>
                    <Counter class="count"></Counter>
                </div>
            </div>
        </div>
    </div>
</template>

<script setup lang="ts">
import { ref, onMounted } from "vue";
//引入顶部的子组件
import Top from './components/top/index.vue';
//引入左侧三个子组件
import Tourist from './components/tourist/index.vue';
import Sex from './components/sex/index.vue';
import Age from './components/age/index.vue'

//引入中间两个子组件
import Map from './components/map/index.vue';
import Line from './components/line/index.vue';

//引入右侧三个子组件
import Rank from './components/rank/index.vue';
import Year from './components/year/index.vue';
import Counter from './components/couter/index.vue'
//获取数据大屏展示内容盒子的DOM元素
let screen = ref();
onMounted(() => {
    screen.value.style.transform = `scale(${getScale()}) translate(-50%,-50%)`
});
//定义大屏缩放比例
function getScale(w = 1920, h = 1080) {
    const ww = window.innerWidth / w;
    const wh = window.innerHeight / h;
    return ww < wh ? ww : wh;
}
//监听视口变化
window.onresize = () => {
    screen.value.style.transform = `scale(${getScale()}) translate(-50%,-50%)`
}


</script>

<style scoped lang="scss">
.container {
    width: 100vw;
    height: 100vh;
    background: url(./images/bg.png) no-repeat;
    background-size: cover;

    .screen {
        position: fixed;
        width: 1920px;
        height: 1080px;
        left: 50%;
        top: 50%;
        transform-origin: left top;

        .top {
            width: 100%;
            height: 40px;
        }

        .bottom {
            display: flex;

            .right {
                flex: 1;
                display: flex;
                flex-direction: column;
                margin-left: 40px;

                .rank {
                    flex: 1.5;
                }

                .year {
                    flex: 1;

                }

                .count {
                    flex: 1;
                }
            }

            .left {
                flex: 1;
                height: 1040px;
                display: flex;
                flex-direction: column;

                .tourist {
                    flex: 1.2;
                }

                .sex {
                    flex: 1;

                }

                .age {
                    flex: 1;
                }
            }

            .center {
                flex: 1.5;
                display: flex;
                flex-direction: column;

                .map {
                    flex: 4;
                }

                .line {
                    flex: 1;
                }
            }
        }
    }
}
</style>
3.顶部组件Top
(1)pnpm i moment
(2)关于时间动态展示》先存储当前时间》组件挂载完毕利用定时器,每隔一秒刷新时间》展示时间
(3)跳转首页
src/views/screen/components/top/index.vue
<template>
    <div class="top">
        <div class="left">
            <span class="lbtn" @click="goHome">首页</span>
        </div>
        <div class="center">
            <div class="title">智慧旅游可视化大数据平台</div>
        </div>
        <div class="right">
            <span class="rbtn">统计报告</span>
            <span class="time">当前时间:{{ time }}</span>
        </div>
    </div>
</template>

<script setup lang="ts">
//@ts-ignore
import moment from 'moment';
//点击首页按钮回到首页
import { useRouter } from 'vue-router';
import { ref, onMounted, onBeforeUnmount } from 'vue';
//获取路由器对象
let $router = useRouter();

//存储当前时间
let time = ref(moment().format('YYYY年MM月DD日 hh:mm:ss'));
let timer = ref(0);
//按钮的点击回调
const goHome = () => {
    $router.push('/home')
}
//组件挂载完毕更新当前的事件
onMounted(() => {
    timer.value = setInterval(() => {
        time.value = moment().format('YYYY年MM月DD日 hh:mm:ss');
    }, 1000);
});
// 销毁定时器
onBeforeUnmount(() => {
    clearInterval(timer.value);
})
</script>

<style scoped lang="scss">
.top {
    width: 100%;
    height: 40px;
    display: flex;

    .left {
        flex: 1.5;
        background: url(../../images/dataScreen-header-left-bg.png) no-repeat;
        background-size: cover;

        .lbtn {
            width: 150px;
            height: 40px;
            float: right;
            background: url(../../images/dataScreen-header-btn-bg-l.png) no-repeat;
            background-size: 100% 100%;
            text-align: center;
            line-height: 40px;
            color: #29fcff;
            font-size: 20px;
        }
    }

    .center {
        flex: 2;

        .title {
            width: 100%;
            height: 74px;
            background: url(../../images/dataScreen-header-center-bg.png) no-repeat;
            background-size: 100% 100%;
            text-align: center;
            line-height: 74px;
            color: #29fcff;
            font-size: 30px;
        }
    }

    .right {
        flex: 1.5;
        background: url(../../images/dataScreen-header-left-bg.png) no-repeat;
        background-size: cover;
        display: flex;
        justify-content: space-between;
        align-items: center;

        .rbtn {
            width: 150px;
            height: 40px;
            background: url(../../images/dataScreen-header-btn-bg-r.png) no-repeat;
            background-size: 100% 100%;
            text-align: center;
            line-height: 40px;
            color: #29fcff;
        }

        .time {
            color: #29fcff;
            font-size: 20px;
        }


    }
}
</style>
4.左侧三个子组件
4.1游客统计组件tourist
(1)pnpm i echarts
(2)pnpm i echarts-liquidfill水球图组件
Apache ECharts
GitHub - ecomfe/echarts-liquidfill: Liquid Fill Chart for Apache ECharts
src/views/screen/components/tourist/index.vue
<template>
    <div class="box">
        <div class="top">
            <p class="title">实时游客统计</p>
            <p class="bg"></p>
            <p class="right">可预约总量<span>99999</span>人</p>
        </div>
        <div class="number">
            <span v-for="(item, index) in people" :key="index">{{ item }}</span>
        </div>
        <!-- 盒子将来echarts展示图形图标的节点 -->
        <div class="charts" ref="charts">123</div>
    </div>
</template>

<script setup lang="ts">
import 'echarts-liquidfill'
import * as echarts from 'echarts';
import { ref, onMounted } from 'vue';
let people = ref('215908人');

//水球图拓展插件

//获取节点
let charts = ref();
onMounted(() => {
    //获取echarts类的实例
    let mycharts = echarts.init(charts.value);
    //设置实例的配置项
    mycharts.setOption({
        //标题组件
        title: {
            text: '水球图'
        },
        //x|y轴组件
        xAxis: {},
        yAxis: {},
        //系列:决定你展示什么样的图形图标
        series: {
            type: 'liquidFill',//系列
            data: [0.6, 0.4, 0.2],//展示的数据
            waveAnimation: true,//动画
            animationDuration: 3,
            animationDurationUpdate: 0,
            radius: '100%',//半径
            outline: {//外层边框颜色设置
                show: true,
                borderDistance: 8,
                itemStyle: {
                    color: 'skyblue',
                    borderColor: '#294D99',
                    borderWidth: 8,
                    shadowBlur: 20,
                    shadowColor: 'rgba(0, 0, 0, 0.25)'
                }
            },
        },
        //布局组件
        grid: {
            left: 0,
            right: 0,
            top: 0,
            bottom: 0
        }

    })
})
</script>

<style scoped lang="scss">
.box {
    background: url(../../images/dataScreen-main-lb.png) no-repeat;
    background-size: 100% 100%;
    margin-top: 10px;

    .top {
        margin-left: 20px;

        .title {
            color: white;
            font-size: 20px;

        }

        .bg {
            width: 68px;
            height: 7px;
            background: url(../../images/dataScreen-title.png) no-repeat;
            background-size: 100% 100%;
            margin-top: 10px;
        }

        .right {
            float: right;
            color: white;
            font-size: 20px;

            span {
                color: yellowgreen;
            }
        }
    }

    .number {
        padding: 10px;
        margin-top: 30px;
        display: flex;


        span {
            flex: 1;
            height: 40px;
            text-align: center;
            line-height: 40px;
            background: url(../../images/total.png) no-repeat;
            background-size: 100% 100%;
            color: #29fcff;
        }
    }

    .charts {
        width: 100%;
        height: 270px;
    }
}
</style>
4.2Sex组件
(1)基础柱状图 - 柱状图 - 常用图表类型 - 应用篇 - 使用手册 - Apache ECharts
(2)柱状图 的使用
src/views/screen/components/sex/index.vue
<template>
  <div class="box1">
    <div class="title">
      <p>男女比例</p>
      <img src="../../images/dataScreen-title.png" alt="">
    </div>
    <div class="sex">
      <div class="man">
        <img src="../../images/man.png" alt="">
      </div>
      <div class="women">
        <img src="../../images/woman.png" alt="">
      </div>

    </div>
    <div class="rate">
      <p>男士58%</p>
      <p>女士42%</p>
    </div>
    <div class="charts" ref='charts'></div>
  </div>
</template>

<script setup lang="ts">
import { ref, onMounted } from 'vue';
import * as echarts from 'echarts';
//获取图形图标的DOM节点
let charts = ref();
onMounted(() => {
  //初始化echarts实例
  let mycharts = echarts.init(charts.value);
  //设置配置项
  mycharts.setOption({
    //组件标题
    title: {
      text: '男女比例',//主标题
      textStyle: {//主标题颜色
        color: 'skyblue'
      },
      left: '40%'
    },
    //x|y
    xAxis: {
      show: false,
      min: 0,
      max: 100
    },
    yAxis: {
      show: false,
      type: 'category'
    },
    series: [
      {
        type: 'bar',
        data: [58],
        barWidth: 20,
        z: 100,
        itemStyle: {
          color: 'skyblue',
          borderRadius: 20
        }
      }
      ,
      {
        type: 'bar',
        data: [100],
        barWidth: 20,
        //调整女士柱条位置
        barGap: '-100%',
        itemStyle: {
          color: 'pink',
          borderRadius: 20
        }
      }
    ],
    grid: {
      left: 0,
      top: 0,
      right: 0,
      bottom: 0
    }
  });
})


</script>

<style scoped lang="scss">
.box1 {
  width: 100%;
  height: 100%;
  background: url(../../images/dataScreen-main-cb.png) no-repeat;
  background-size: 100% 100%;
  margin: 20px 0px;

  .title {
    margin-left: 20px;

    p {
      color: white;
      font-size: 20px;
    }
  }

  .sex {
    display: flex;
    justify-content: center;

    .man {
      margin: 20px;
      width: 111px;
      height: 115px;
      background: url(../../images/man-bg.png) no-repeat;
      display: flex;
      justify-content: center;
      align-items: center;
    }

    .women {
      margin: 20px;
      width: 111px;
      height: 115px;
      background: url(../../images/woman-bg.png) no-repeat;
      display: flex;
      justify-content: center;
      align-items: center;
    }

  }

  .rate {
    display: flex;
    justify-content: space-between;
    color: white;
  }

  .charts {
    height: 100px;
  }
}
</style>
4.3Age组件
(1)饼图
圆环图 - 饼图 - 常用图表类型 - 应用篇 - 使用手册 - Apache ECharts
src/views/screen/components/age/index.vue
<template>
    <div class="box2">
        <div class="title">
            <p>年龄比例</p>
            <img src="../../images/dataScreen-title.png" alt="">
        </div>
        <!-- 图形图标的容器 -->
        <div class="charts" ref="charts"></div>
    </div>
</template>

<script setup lang="ts">
import { ref, onMounted } from 'vue';
//引入echarts
import * as echarts from 'echarts';
let charts = ref();
//组件挂载完毕初始化图形图标
onMounted(() => {
    let mychart = echarts.init(charts.value);
    //设置配置项
    let option = {
        tooltip: {
            trigger: 'item'
        },
        legend: {
            right: 30,
            top: 40,
            orient: 'vertical',//图例组件方向的设置
            textStyle: {
                color: 'white',
                fontSize: 14
            }
        },
        series: [
            {
                name: 'Access From',
                type: 'pie',
                radius: ['40%', '70%'],
                avoidLabelOverlap: false,
                itemStyle: {
                    borderRadius: 10,
                    borderColor: '#fff',
                    borderWidth: 2
                },
                label: {
                    show: true,
                    position: 'inside',
                    color:'white'
                },

                labelLine: {
                    show: false
                },
                data: [
                    { value: 1048, name: '军事' },
                    { value: 735, name: '新闻' },
                    { value: 580, name: '直播' },
                    { value: 484, name: '娱乐' },
                    { value: 300, name: '财经' }
                ]
            }
        ],
        //调整图形图标的位置
        grid: {
            left: 0,
            top: 0,
            right: 0,
            bottom: 0
        }
    };
    mychart.setOption(option);
});
</script>

<style scoped lang="scss">
.box2 {
    width: 100%;
    height: 100%;
    background: url(../../images/dataScreen-main-cb.png) no-repeat;
    background-size: 100% 100%;

    .title {
        margin-left: 20px;

        p {
            color: white;
            font-size: 20px;
        }
    }

    .charts {
        height: 260px;
    }

}
</style>
5.中间两个子组件
5.1Map组件中国地图
(1)ISQQW.COM x ECharts 文档(国内同步镜像) - 配置项
(2)阿里云网站提供中国地图数据
http://datav.aliyun.com/portal/school/atlas/area_selector
将数据放入map/china.json
注册中国地图》引入json数据》onMounted设置配置项》地图组件
src/views/screen/components/map/index.vue
<template>
    <div class="box4" ref="map">
        我是地图组件
    </div>
</template>

<script setup lang="ts">
import { ref, onMounted } from 'vue';
import * as echarts from 'echarts';
//引入中国地图的JSON数据
import chinaJSON from './china.json'
//获取DOM元素
let map = ref();
//注册中国地图
echarts.registerMap('china', chinaJSON as any)
onMounted(() => {
    let mychart = echarts.init(map.value);
    //设置配置项
    mychart.setOption({
        //地图组件
        geo: {
            map: 'china',//中国地图
            roam: true,//鼠标缩放的效果
            //地图的位置调试
            left: 150,
            top: 150,
            right: 150,
            zoom:1.2,
            bottom: 0,
            //地图上的文字的设置
            label: {
                show: true,//文字显示出来
                color: 'white',
                fontSize: 14
            },

            itemStyle: {
                //每一个多边形的样式
                color: {
                    type: 'linear',
                    x: 0,
                    y: 0,
                    x2: 0,
                    y2: 1,
                    colorStops: [{
                        offset: 0, color: 'red' // 0% 处的颜色
                    }, {
                        offset: 1, color: 'blue' // 100% 处的颜色
                    }],
                    global: false // 缺省为 false
                },
                opacity: .8
            },
            //地图高亮的效果
            emphasis: {
                itemStyle: {
                    color: 'red'
                },
                label: {
                    fontSize: 40
                }
            }
        },
        //布局位置
        grid: {
            left: 0,
            top: 0,
            right: 0,
            bottom: 0
        },
        series: [
            {
                type: 'lines',//航线的系列
                data: [
                    {
                        coords: [
                            [116.405285, 39.904989],  // 起点
                            [119.306239, 26.075302]   // 终点

                        ],
                        // 统一的样式设置
                        lineStyle: {
                            color: 'orange',
                            width: 5
                        }
                    },
                    {
                        coords: [
                            [116.405285, 39.904989],  // 起点
                            [114.298572,30.584355]   // 终点

                        ],
                        // 统一的样式设置
                        lineStyle: {
                            color: 'yellow',
                            width: 5
                        }
                    }
                ],
                //开启动画特效
                effect: {
                    show: true,
                    symbol: 'arrow',
                    color: 'black',
                    symbolSize: 10
                }
            }
        ]
    })

});
</script>

<style scoped></style>
5.2Line组件游客趋势折线图
src/views/screen/components/line/index.vue
<template>
    <div class="box5">
        <div class="title">
            <p>未来七天游客数量趋势图</p>
            <img src="../../images/dataScreen-title.png" alt="">
        </div>
        <div class="charts" ref='line'></div>
    </div>
</template>

<script setup lang="ts">
import * as echarts from 'echarts';
import { ref, onMounted } from 'vue';
//获取图形图标的节点
let line = ref();
onMounted(() => {
    let mycharts = echarts.init(line.value);
    //设置配置项
    mycharts.setOption({
        //标题组件
        title: {
            text: '访问量'
        },
        //x|y轴
        xAxis: {
            type: 'category',
            //两侧不留白
            boundaryGap: false,
            //分割线不要
            splitLine: {
                show: false
            },
            data: ['周一', '周二', '周三', '周四', '周五', '周六', '周日'],
            //轴线的设置
            axisLine: {
                show: true
            },
            //刻度
            axisTick: {
                show: true
            }
        },
        yAxis: {
            splitLine: {
                show: false
            },
            //轴线的设置
            axisLine: {
                show: true
            },
            //刻度
            axisTick: {
                show: true
            }
        },
        grid: {
            left: 40,
            top: 0,
            right: 20,
            bottom: 20
        },
        //系列
        series: [
            {
                type: 'line',
                data: [120, 1240, 66, 2299, 321, 890, 1200],
                //平滑曲线的设置
                smooth: true,
                //区域填充样式
                areaStyle: {
                    color: {
                        type: 'linear',
                        x: 0,
                        y: 0,
                        x2: 0,
                        y2: 1,
                        colorStops: [{
                            offset: 0, color: 'red' // 0% 处的颜色
                        }, {
                            offset: 1, color: 'blue' // 100% 处的颜色
                        }],
                        global: false // 缺省为 false
                    }
                }
            }
        ]
    })
})
</script>

<style scoped lang="scss">
.box5 {
    width: 100%;
    height: 100%;
    background: url(../../images/dataScreen-main-cb.png) no-repeat;
    background-size: 100% 100%;
    margin: 0px 20px;

    .title {
        margin-left: 10px;

        p {
            color: white;
            font-size: 20px;
        }
    }

    .charts {
        height: calc(100% - 40px);
    }

}
</style>
6.右侧三个子组件
6.1Rank组件
src/views/screen/components/rank/index.vue
<template>
    <div class="box6">
        <div class="title">
            <p>热门景区排行</p>
            <img src="../../images/dataScreen-title.png" alt="">
        </div>
        <!-- 图形图标的容器 -->
        <div class="charts" ref='charts'></div>
    </div>
</template>

<script setup lang="ts">
import * as echarts from 'echarts';
import { ref, onMounted } from 'vue';
//获取DOM节点
let charts = ref();
//组件挂载完毕
onMounted(() => {
    //一个容器可以同时展示多种类型的图形图标
    let mychart = echarts.init(charts.value);
    //设置配置项
    mychart.setOption({
        //标题组件
        title: {
            //主标题
            text: '景区排行',
            link: 'http://www.baidu.com',
            //标题的位置
            left: '50%',
            //主标题文字样式
            textStyle: {
                color: 'yellowgreen',
                fontSize: 20
            },
            //子标题
            subtext: "各大景区排行",
            //子标题的样式
            subtextStyle: {
                color: 'yellowgreen',
                fontSize: 16
            }
        },
        //x|y轴组件
        xAxis: {
            type: 'category',//图形图标在x轴均匀分布展示
        },
        yAxis: {},
        //布局组件
        grid: {
            left: 20,
            bottom: 20,
            right: 20
        },
        //系列:决定显示图形图标是哪一种的
        series: [
            {
                type: 'bar',
                data: [10, 20, 30, 40, 50, 60, 70],
                //柱状图的:图形上的文本标签,
                label: {
                    show: true,
                    //文字的位置
                    position: 'insideTop',
                    //文字颜色
                    color: 'yellowgreen'
                },
                //是否显示背景颜色
                showBackground: true,
                backgroundStyle: {
                    //底部背景的颜色
                    color: {
                        type: 'linear',
                        x: 0,
                        y: 0,
                        x2: 0,
                        y2: 1,
                        colorStops: [{
                            offset: 0, color: 'black' // 0% 处的颜色
                        }, {
                            offset: 1, color: 'blue' // 100% 处的颜色
                        }],
                        global: false // 缺省为 false
                    }
                },
                //柱条的样式
                itemStyle: {
                    borderRadius:[10, 10, 0, 0],
                    //柱条颜色
                    color:function(data:any){
                        //给每一个柱条这是背景颜色
                        let arr =['red','orange','yellowgreen','green','purple','hotpink','skyblue']
                         return arr[data.dataIndex];
                    }
                }
            },
            {
                type:'line',
                data:[10,20,30,40,50,60,90],
                smooth:true,//平滑曲线
            },
            {
                type: 'bar',
                data: [10, 20, 30, 40, 50, 60, 70],
                //柱状图的:图形上的文本标签,
                label: {
                    show: true,
                    //文字的位置
                    position: 'insideTop',
                    //文字颜色
                    color: 'yellowgreen'
                },
                //是否显示背景颜色
                showBackground: true,
                backgroundStyle: {
                    //底部背景的颜色
                    color: {
                        type: 'linear',
                        x: 0,
                        y: 0,
                        x2: 0,
                        y2: 1,
                        colorStops: [{
                            offset: 0, color: 'black' // 0% 处的颜色
                        }, {
                            offset: 1, color: 'blue' // 100% 处的颜色
                        }],
                        global: false // 缺省为 false
                    }
                },
                //柱条的样式
                itemStyle: {
                    borderRadius:[10, 10, 0, 0],
                    //柱条颜色
                    color:function(data:any){
                        //给每一个柱条这是背景颜色
                        let arr =['red','orange','yellowgreen','green','purple','hotpink','skyblue']
                         return arr[data.dataIndex];
                    }
                }
            },
        ],
        tooltip:{
            backgroundColor:'rgba(50,50,50,0.7)'
        }
    })
})
</script>

<style scoped lang="scss">
.box6 {
    width: 100%;
    height: 100%;
    background: url(../../images/dataScreen-main-cb.png) no-repeat;
    background-size: 100% 100%;
    margin: 20px 0px;

    .title {
        margin-left: 5px;

        p {
            color: white;
            font-size: 20px;
        }
    }

    .charts {
        height: calc(100% - 30px);
    }
}
</style>
6.2Year组件
src/views/screen/components/year/index.vue
<template>
  <div class="box7">
    <div class="title">
      <p>年度游客量对比</p>
      <img src="../../images/dataScreen-title.png" alt="">
    </div>
    <div class="charts" ref="charts"></div>
  </div>
</template>

<script setup lang="ts">
import * as echarts from 'echarts';
import { ref, onMounted } from 'vue';
//获取DOM节点
let charts = ref();
//组件挂载完毕
onMounted(() => {
  //一个容器可以同时展示多种类型的图形图标
  let mychart = echarts.init(charts.value);
  //设置配置项
  mychart.setOption({
    title: {
      text: '散点图',
      left: '40%',
      textStyle: {
        color: 'white'
      }
    },
    xAxis: {
      type: 'category',
      show: true,
    },
    yAxis: {
      show: false
    },
    grid: {
      left: 20,
      top: 20,
      right: 0,
      bottom: 20
    },
    series: {
      type: 'scatter',
      data: [33, 88, 21, 9, 88, 234, 113, 1231, 674, 3, 88, 33, 21, 888, 3332, 313, 123, 5, 657, 7],
      //标记图形设置
      symbol: 'diamond',
      symbolSize: 16,
      //图文标签
      label: {
        show: true,
        position: 'top',
        color: 'red'
      },
      //散点图标记的颜色
      itemStyle: {
        color: {
          type: 'linear',
          x: 0,
          y: 0,
          x2: 0,
          y2: 1,
          colorStops: [{
            offset: 0, color: 'red' // 0% 处的颜色
          }, {
            offset: 1, color: 'blue' // 100% 处的颜色
          }],
          global: false // 缺省为 false
        }
      }
    }

  })
})
</script>

<style scoped lang="scss">
.box7 {
  width: 100%;
  height: 100%;
  background: url(../../images/dataScreen-main-cb.png) no-repeat;
  background-size: 100% 100%;
  margin: 20px 0px;

  .title {
    p {
      color: white;
      font-size: 18px;
    }
  }

  .charts {
    height: calc(100% - 30px);
  }

}
</style>
6.3Couter组件
src/views/screen/components/couter/index.vue
<template>
<div class="box8">
<div class="title">
<p>数据统计</p>
<img src="../../images/dataScreen-title.png" alt="">
</div>
<div class="charts" ref="charts"></div>
</div>
</template>
<script setup lang="ts">
import * as echarts from 'echarts';
import { ref, onMounted } from 'vue';
//获取DOM节点
let charts = ref();
//组件挂载完毕
onMounted(() => {
//一个容器可以同时展示多种类型的图形图标
let mychart = echarts.init(charts.value);
let option = {
title: {
text: '游客消费统计',
textStyle:{
color:'white'
}
},
radar: {
// shape: 'circle',
indicator: [
{ name: '消费', max: 6500 },
{ name: '好感', max: 16000 },
{ name: '出行', max: 30000 },
{ name: '小吃', max: 38000 },
{ name: '爱好', max: 52000 },
{ name: '景点', max: 25000 }
]
},
series: [
{
name: 'Budget vs spending',
type: 'radar',
data: [
{
value: [4200, 3000, 20000, 35000, 50000, 18000],
name: '购物'
},
{
value: [5000, 14000, 28000, 26000, 42000, 21000],
name: '吃饭'
}
]
}
]
};
//设置配置项
mychart.setOption(option)
})
</script>
<style scoped lang="scss">
.box8 {
width: 100%;
height: 100%;
background: url(../../images/dataScreen-main-cb.png) no-repeat;
background-size: 100% 100%;
margin-top: 20px;
.title {
p {
color: white;
font-size: 18px;
}
}
.charts {
height: calc(100% - 30px);
}
}
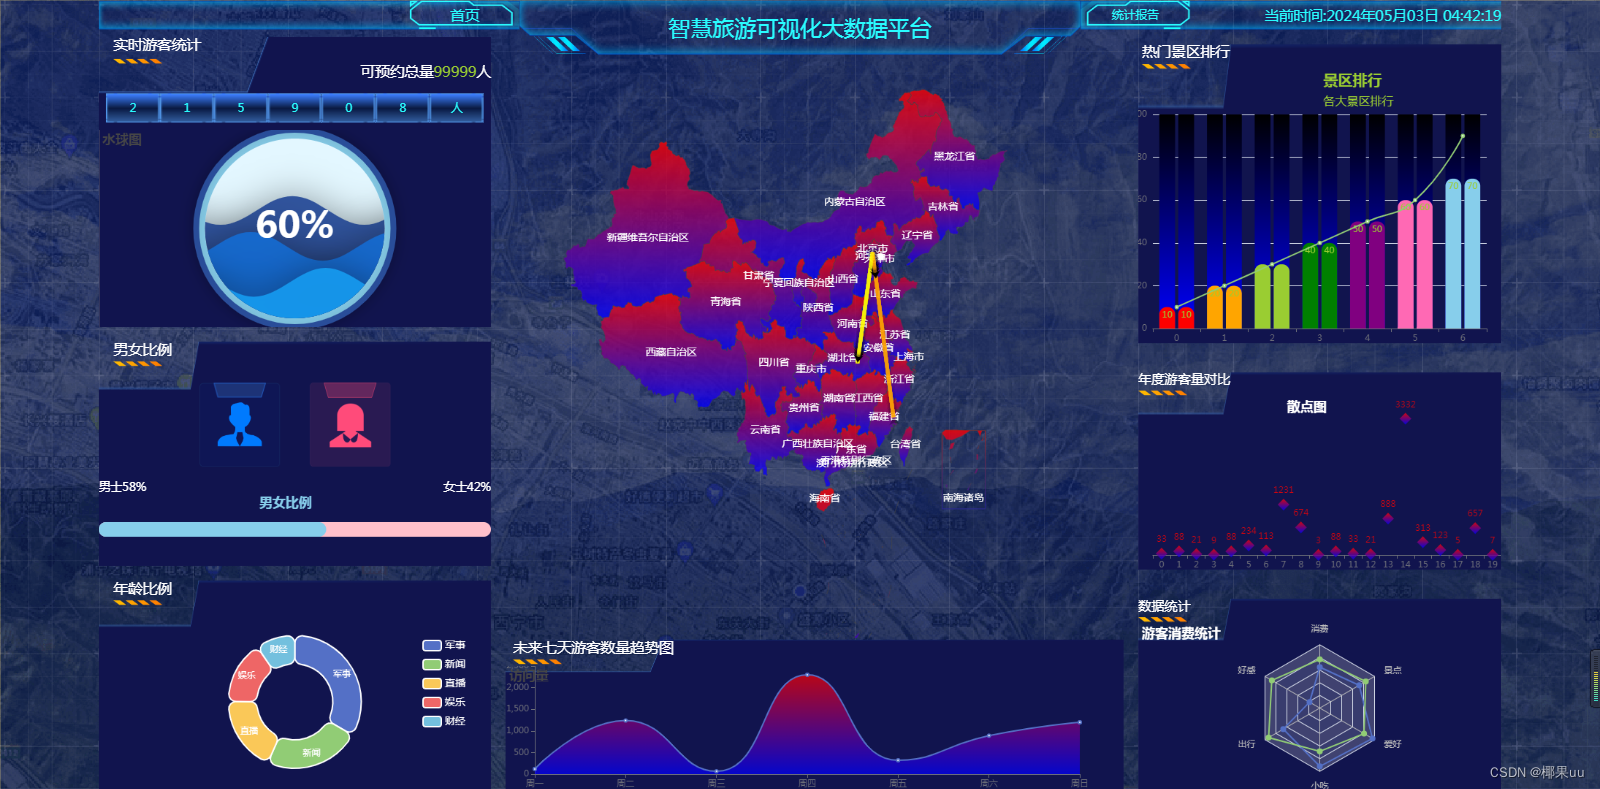
</style>效果图
二、菜单权限
1. 路由拆分
将项目路由拆分为:
- 静态路由:login、404、home、screen
- 异步路由:权限管理(包含三个子路由)、商品管理(包含四个子路由)
- 任意路由:任意路由
src/router/routes.ts
// 对外暴露配置路由(常量路由):全部用户都可以访问到的路由
export const constantRoute = [
  {
    // 登录
    path: '/login',
    component: () => import('@/views/login/index.vue'),
    name: 'login',
    meta: {
      title: '登录',
      hidden: true,
      icon: 'Moon',
    },
  },
  {
    // 登录成功以后展示数据的路由
    path: '/',
    component: () => import('@/layout/index.vue'),
    name: 'layout',
    meta: {
      title: '',
      hidden: false,
      icon: '', // 菜单文字左侧的图标,支持element-plus全部图标
    },
    redirect: '/home',
    children: [
      {
        path: '/home',
        component: () => import('@/views/home/index.vue'),
        meta: {
          title: '首页',
          hidden: false,
          icon: 'Sunny',
        },
      },
    ],
  },
  {
    // 404
    path: '/404',
    component: () => import('@/views/404/index.vue'),
    name: '404',
    meta: {
      title: '404',
      hidden: true,
      icon: 'Moon',
    },
  },
  {
    path: '/screen',
    component: () => import('@/views/screen/index.vue'),
    name: 'Screen',
    meta: {
      title: '数据大屏',
      hidden: false,
      icon: 'Platform',
    },
  }
]
//异步路由
export const asnycRoute = [
   {
    path: '/acl',
    component: () => import('@/layout/index.vue'),
    name: 'Acl',
    meta: {
      title: '权限管理',
      icon: 'Lock',
    },
    redirect: '/acl/user',
    children: [
      {
        path: '/acl/user',
        component: () => import('@/views/acl/user/index.vue'),
        name: 'User',
        meta: {
          title: '用户管理',
          icon: 'User',
        },
      },
      {
        path: '/acl/role',
        component: () => import('@/views/acl/role/index.vue'),
        name: 'Role',
        meta: {
          title: '角色管理',
          icon: 'UserFilled',
        },
      },
      {
        path: '/acl/permission',
        component: () => import('@/views/acl/permission/index.vue'),
        name: 'Permission',
        meta: {
          title: '菜单管理',
          icon: 'Monitor',
        },
      },
    ],
  },
  {
    path: '/product',
    component: () => import('@/layout/index.vue'),
    name: 'Product',
    meta: {
      title: '商品管理',
      icon: 'Goods',
    },
    redirect: '/product/trademark',
    children: [
      {
        path: '/product/trademark',
        component: () => import('@/views/product/trademark/index.vue'),
        name: 'Trademark',
        meta: {
          title: '品牌管理',
          icon: 'ShoppingCartFull',
        },
      },
      {
        path: '/product/attr',
        component: () => import('@/views/product/attr/index.vue'),
        name: 'Attr',
        meta: {
          title: '属性管理',
          icon: 'ChromeFilled',
        },
      },
      {
        path: '/product/spu',
        component: () => import('@/views/product/spu/index.vue'),
        name: 'Spu',
        meta: {
          title: 'SPU管理',
          icon: 'Calendar',
        },
      },
      {
        path: '/product/sku',
        component: () => import('@/views/product/sku/index.vue'),
        name: 'Sku',
        meta: {
          title: 'SKU管理',
          icon: 'Orange',
        },
      },
    ],
  },

]
// 任意路由
export const anyRoute =
  {
    // 任意路由
    path: '/:pathMatch(.*)*',
    redirect: '/404',
    name: 'Any',
    meta: {
      title: '任意路由',
      hidden: true,
      icon: 'Moon',
    },
  }
2 . 菜单权限业务实现
src/store/modules/user.ts
//创建用户相关的小仓库
import { defineStore } from 'pinia'
//引入接口
import { reqLogin, reqUserInfo, reqLogout } from '@/api/user'
import type {
  loginFormData,
  loginResponseData,
  userInfoResponseData,
} from '@/api/user/type'
import type { UserState } from './types/type'
//引入操作本地存储的工具方法
import { SET_TOKEN, GET_TOKEN, REMOVE_TOKEN } from '@/utils/token'
//引入路由(常量路由)
import { constantRoute, asnycRoute, anyRoute } from '@/router/routes'

//引入深拷贝方法
//@ts-expect-error
import cloneDeep from 'lodash/cloneDeep'
import router from '@/router'
//用于过滤当前用户需要展示的异步路由
function filterAsyncRoute(asnycRoute: any, routes: any) {
  return asnycRoute.filter((item: any) => {
    if (routes.includes(item.name)) {
      if (item.children && item.children.length > 0) {
        //硅谷333账号:product\trademark\attr\sku
        item.children = filterAsyncRoute(item.children, routes)
      }
      return true
    }
  })
}

//创建用户小仓库
const useUserStore = defineStore('User', {
  //小仓库存储数据地方
  state: (): UserState => {
    return {
      token: GET_TOKEN(), //用户唯一标识token
      menuRoutes: constantRoute, //仓库存储生成菜单需要数组(路由)
      username: '',
      avatar: '',
      //存储当前用户是否包含某一个按钮
      buttons: [],
    }
  },
  //异步|逻辑的地方
  actions: {
    //用户登录的方法
    async userLogin(data: loginFormData) {
      //登录请求
      const result: loginResponseData = await reqLogin(data)
      //登录请求:成功200->token
      //登录请求:失败201->登录失败错误的信息
      if (result.code == 200) {
        //pinia仓库存储一下token
        //由于pinia|vuex存储数据其实利用js对象
        this.token = result.data as string
        //本地存储持久化存储一份
        SET_TOKEN(result.data as string)
        //能保证当前async函数返回一个成功的promise
        return 'ok'
      } else {
        return Promise.reject(new Error(result.data))
      }
    },
    //获取用户信息方法
    async userInfo() {
      //获取用户信息进行存储仓库当中[用户头像、名字]
      const result: userInfoResponseData = await reqUserInfo()
      //如果获取用户信息成功,存储一下用户信息
      if (result.code == 200) {
        this.username = result.data.name
        this.avatar = result.data.avatar
        this.buttons = result.data.buttons
        //计算当前用户需要展示的异步路由
        const userAsyncRoute = filterAsyncRoute(
          cloneDeep(asnycRoute),
          result.data.routes,
        )
        //菜单需要的数据整理完毕
        this.menuRoutes = [...constantRoute, ...userAsyncRoute, anyRoute]
        //目前路由器管理的只有常量路由:用户计算完毕异步路由、任意路由动态追加
        ;[...userAsyncRoute, anyRoute].forEach((route: any) => {
          router.addRoute(route)
        })
        return 'ok'
      } else {
        return Promise.reject(new Error(result.message))
      }
    },
    //退出登录
    async userLogout() {
      //退出登录请求
      const result: any = await reqLogout()
      if (result.code == 200) {
        //目前没有mock接口:退出登录接口(通知服务器本地用户唯一标识失效)
        this.token = ''
        this.username = ''
        this.avatar = ''
        REMOVE_TOKEN()
        return 'ok'
      } else {
        return Promise.reject(new Error(result.message))
      }
    },
  },
  getters: {},
})
//对外暴露获取小仓库方法
export default useUserStore
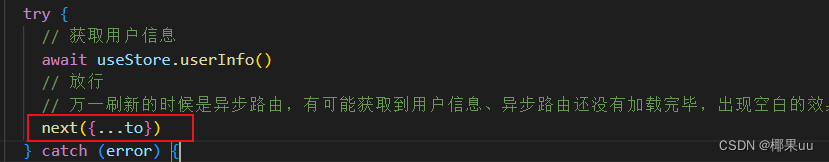
刷新的时候是异步路由,有可能获取到用户信息,异步路由还没有加载完毕,出现空白的效果!!
解决方法:在全局前置守卫中,获取用户信息后改成next({...to})
next() :直接放行(这种写法会导致刷新产生空白的效果)
next({...to}):等待路由加载完毕再放行
src/permission.ts
三、按钮权限
1.用户按钮权限信息存储
src/store/modules/user.ts
......
state: (): UserState => {
    return {
      ......
      //存储当前用户是否包含某一个按钮
      buttons: [],
    }
......
async userInfo() {
      ......
      // 如果获取信息成功,存储下用户信息
      if (result.code === 200) {
        ......
        this.buttons = result.data.buttons
        ......
      }
2.定义全局自定义指令
src/directive/has.ts
import pinia from "@/store"
import useUserStore from "@/store/modules/user"
const userStore = useUserStore(pinia)
export const isHasButton = (app: any) => {
    // 获取对应的用户仓库
    // 全局自定义指令:实现按钮的权限
    app.directive('has', {
        // 代表使用这个全局指令的DOM|组件挂载完毕的时候会执行一次
        mounted(el: any, options: any) {
            // 自定义指令右侧的数值:如果在用户信息buttons数组中没有
            // 从DOM树上干掉
            if (!userStore.buttons.includes(options.value)) {
                el.parentNode.removeChild(el)
            }
        },
    })
}
在main.ts文件中引入自定义指令文件
// 引入自定义指令文件
import { isHasButton } from '@/directive/has'
isHasButton(app)
3.使用自定义指令配置按钮权限
此处以trademark作为例子,项目中其他按钮的权限都需要配置
src/views/product/trademark/index.vue
<el-button type="primary" size="default" icon="Plus" @click="addTrademark" v-has="'btn.Trademark.add'">完结!后续还会复习项目总结一波!也会在做一个项目,有需要的可以关注!