Title
题目
Brain tumor segmentation and grading of lower-grade glioma using deeplearning in MRI images
使用深度学习在 MRI 图像中进行低级别胶质瘤的脑肿瘤分割和分级
01文献速递介绍
胶质瘤是最常见的脑肿瘤,根据肿瘤的恶性程度和生长速率具有不同的分级。根据世界卫生组织(WHO)的分类,胶质瘤分为四个等级:I级通常可以通过手术切除治愈;IV级,即多形性胶质母细胞瘤(GBM),是最具侵袭性的,存活率最低;以及低级别胶质瘤(LGG),II级和III级的侵袭性和浸润性均低于IV级。低级别胶质瘤(LGG)有不同的组织学类型,如星形细胞瘤、少突神经胶质细胞瘤和少突胶质细胞瘤。胶质瘤的分级以及肿瘤的位置、形状和大小是确定存活和治疗计划的必需信息,这些计划包括手术、化疗、放疗或多种方法的组合。因此,开发非侵入性技术,自动化肿瘤分割和分级对于诊断和适应性治疗计划的临床应用将是有益的,以优化患者的治疗结果。MRI是一种非侵入性技术,可以提供详细的脑部图像。因此,它通常用于诊断和肿瘤的初步特征描述。使用MRI进行脑肿瘤分割可以提供关于肿瘤的信息,例如其形状和大小,以及用于进行病理学分级的活检取样的肿瘤位置。肿瘤分割的金标准是手工分割。然而,这种方法成本高、耗时且存在观察者间变异。因此,尤其是在需要大量数据处理和持续监测肿瘤以及适应性治疗计划时,自动肿瘤分割更受青睐。然而,由于肿瘤位置、形状和结构的高度可变性,准确的自动肿瘤分割通常具有挑战性。使用病理学检查进行肿瘤分级需要活检,因此这是一种侵入性、耗时的技术,并且可能会因取样不准确和观察者间变异而受到影响。因此,直接从MRI获取的自动肿瘤分割和分级对临床使用非常有益。
使用MRI进行自动肿瘤分割的方法主要基于生成模型或判别模型。生成模型,如基于图谱的模型,需要解剖学的先验知识,并使用体素的后验概率进行分类,伴随图像配准进行肿瘤分割。另一方面,判别模型,如基于机器学习的支持向量机(SVM)和随机森林,不需要解剖学的先验知识,而是使用从MRI提取的成像特征而非原始MRI数据进行体素的分类。
Abstract
摘要
Gliomas are the most common malignant brain tumors with different grades that highly determine the rate of survival in patients. Tumor segmentation and grading using magnetic resonance imaging (MRI) are common and essential for diagnosis and treatment planning. To achieve this clinical need, a deep learning approach that combines convolutional neural networks (CNN) based on the U-net for tumor segmentation and transfer learning based on a pre-trained convolution-base of Vgg16 and a fully connected classifier for tumor grading was developed. The segmentation and grading models use the same pipeline of T1-precontrast, fluid attenuated inversion recovery (FLAIR), and T1-postcontrast MRI images of 110 patients of lower-grade glioma (LGG) for training and evaluations. The mean dice similarity coefficient (DSC) and tumor detection accuracy achieved by the segmentation model are 0.84 and 0.92, respectively. The grading model classifies LGG into grade II and grade III with accuracy, sensitivity, and specificity of 0.89, 0.87, and 0.92, respectively at the MRI images’ level and 0.95, 0.97, and 0.98 at the patients’ level. This work demonstrates the potential of using deep learning in MRI images to provide a non-invasive tool for simultaneous and automated tumor segmentation, detection, andgrading of LGG for clinical applications.
胶质瘤是最常见的恶性脑肿瘤,具有不同的等级,这些等级极大地决定了患者的生存率。使用磁共振成像(MRI)进行肿瘤分割和分级是诊断和治疗计划中常见且必不可少的。为了满足这一临床需求,开发了一种深度学习方法,该方法结合了基于 U-net 的卷积神经网络(CNN)进行肿瘤分割,以及基于预训练的卷积基底 Vgg16 和全连接分类器的迁移学习进行肿瘤分级。分割和分级模型使用相同的流程,对 110 名低级别胶质瘤(LGG)患者的 T1-前对比、液体衰减反转恢复(FLAIR)和 T1-后对比 MRI 图像进行训练和评估。分割模型的平均 Dice 相似性系数(DSC)和肿瘤检测准确率分别为 0.84 和 0.92。分级模型将 LGG 分为 II 级和 III 级,其在 MRI 图像级别的准确率、敏感性和特异性分别为 0.89、0.87 和 0.92,在患者级别分别为 0.95、0.97 和 0.98。这项工作展示了使用深度学习在 MRI 图像中进行肿瘤的同时自动分割、检测和分级的潜力,为临床应用提供了一种非侵入性工具。
Conclusions
结论
This work illustrates the potential of using deep learning and transfer
learning models in MRI images to provide accurate automatic tumor
segmentation, detection and grading of LGG brain tumors. The use of
one pipeline of MRI images by the segmentation and grading models
allows full automation and simultaneous segmentation and grading of
the brain tumors. Additionally, given a segmentation DSC mean value of0.84, tumor detection accuracy of 0.92, and tumor grading accuracy atimage and patient levels of 0.89 and 0.95, respectively, the proposed
approach shows a promise as a non-invasive tool for tumor character
ization in LGG.
这项工作展示了使用深度学习和迁移学习模型在 MRI 图像中进行准确的自动肿瘤分割、检测和分级低级别胶质瘤(LGG)脑肿瘤的潜力。通过一个管道使用 MRI 图像的分割和分级模型允许完全自动化并同时进行脑肿瘤的分割和分级。此外,鉴于分割的 Dice 相似系数(DSC)平均值为 0.84,肿瘤检测准确率为 0.92,以及图像和患者层面上的肿瘤分级准确率分别为 0.89 和 0.95,所提出的方法显示了作为一种非侵入性工具用于 LGG 肿瘤特征化的前景。
Results
结果
3.1. Tumor segmentation
The DSC values’ distributions obtained by the segmentation model for the 5 test data sets are illustrated in Fig. 3A. The DSC median values for Set 1 to Set 5 are 0.95, 1, 0.97, 1 and 1, respectively, while the DSC mean values are 0.80, 0.84, 0.82, 0.87 and 0.86, respectively. The DSC median and mean values for all test data sets are 0.98 and 0.84, respectively, with standard deviations of 0.02 and 0.03, respectively. The confusion matrix for tumor detection results aggregated using all the test data sets and obtained by the segmentation model is shown in Fig. 3B. The classification accuracy, tumor detection sensitivity and normal tissue specificity are 0.92 for all of them, as summarized in Table 2. To illustrate the performance of the segmentation model, samples of heatmaps and overlays of FLAIR MRI images with the outlines of tumor masks using manual and model segmentations for the test data sets are shown in Fig. 4. At the left of each panel in Fig. 4, a heat map image shows the highlighted tumor in pink, while the overlay image with tumor outlines (red – manual segmentation and green – model segmentation) is given at the right. The tumor grade and the DSC value are given at the top and the top right corner of each panel. The first, second, and third rows show representative segmentation results for DSC values below, similar, and above the segmentation model’s mean DSC value of 0.84. The confusion matrix for tumor grading results aggregated using all MRI images of the test data sets S1 to S5 and obtained by the grading model is shown in Fig. 5A. The classification accuracy, grade III tumor detection sensitivity, and grade II tumor detection specificity are 0.89, 0.87, and 0.92, respectively, as shown in Table 2. The Receiver Operating Characteristics (ROC) curves for the grading model using the 5 test data sets S1 to S5 are given in Fig. 5B. The areas under the curves (AUCs) for S1 to S5 are 0.98, 0.96, 0.97, 0.96, and 0.97, respectively, and the mean AUC is 0.97.3.1.
肿瘤分割分割
模型针对5个测试数据集所获得的DSC值分布在图3A中展示。集合1至集合5的DSC中位数分别为0.95、1、0.97、1和1,而DSC的平均值分别为0.80、0.84、0.82、0.87和0.86。所有测试数据集的DSC中位数和平均值分别为0.98和0.84,标准差分别为0.02和0.03。使用所有测试数据集并由分割模型得出的肿瘤检测结果的混淆矩阵显示在图3B中。分类准确率、肿瘤检测敏感性和正常组织特异性均为0.92,如表2所总结。为了展示分割模型的性能,图4显示了使用手工和模型分割为测试数据集的FLAIR MRI图像勾画的肿瘤掩模的热图和叠加图样本。在图4的每个面板左侧,热图显示粉红色突出的肿瘤,而带有肿瘤轮廓的叠加图(红色 - 手工分割和绿色 - 模型分割)在右侧给出。每个面板的顶部和右上角分别给出了肿瘤等级和DSC值。第一、二、三行展示了DSC值低于、接近和高于分割模型平均DSC值0.84的代表性分割结果。使用所有测试数据集S1至S5的MRI图像并由分级模型得出的肿瘤分级结果的混淆矩阵显示在图5A中。分类准确率、III级肿瘤检测敏感性和II级肿瘤检测特异性分别为0.89、0.87和0.92,如表2所示。使用5个测试数据集S1至S5的分级模型的接收者操作特性(ROC)曲线给出在图5B中。S1至S5的曲线下面积(AUCs)分别为0.98、0.96、0.97、0.96和0.97,平均AUC为0.97。
Method
方法
An overview of the proposed approach used for tumor segmentation and grading is summarized in Fig. 1. In brief, the brain MRI images and the corresponding tumor masks generated using manual segmentation were processed and then used for training the segmentationmodel . The trained segmentation model and the processed MRIimages were then used to automatically generate tumor masks. The grading model used a sub-set of the processed MRI images based on the generated tumor masks for classifying images with different grades .
所提出的用于肿瘤分割和分级的方法概述在图1中进行了总结。简而言之,使用手工分割生成的脑部MRI图像及其相应的肿瘤掩模被处理,然后用于训练分割模型。训练好的分割模型和处理过的MRI图像随后被用来自动生成肿瘤掩模。分级模型使用基于生成的肿瘤掩模的一部分处理过的MRI图像来对不同等级的图像进行分类。
Figure
图
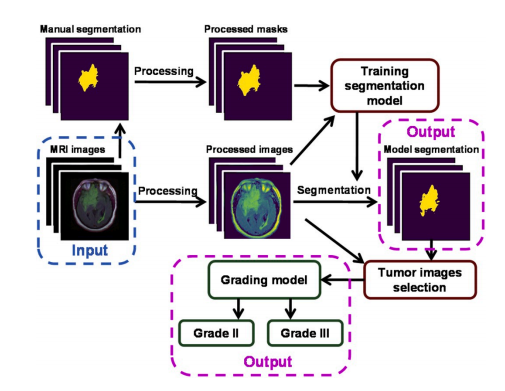
Fig. 1. An illustration of the workflow used for tumor segmentationand grading.
图 1. 用于肿瘤分割和分级的工作流程示意图。
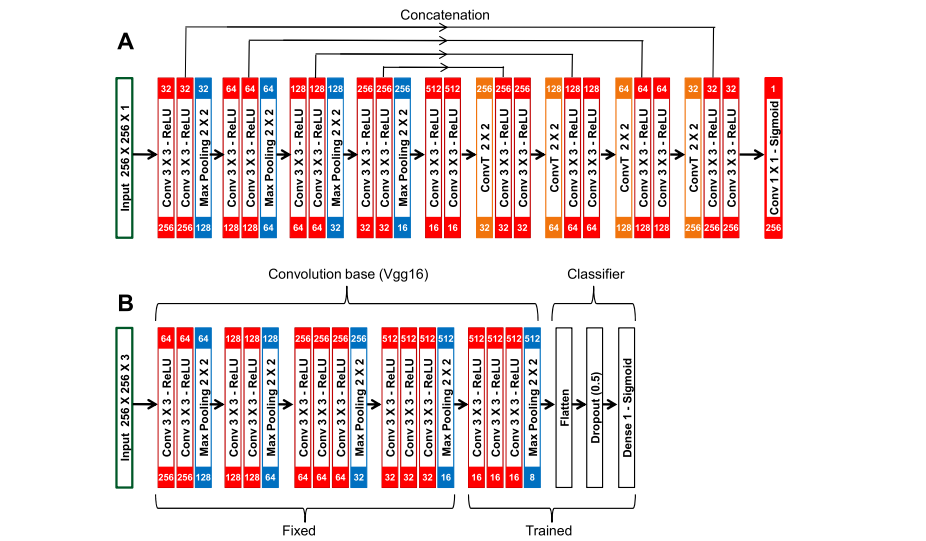
Fig. 2. Illustrations of (A) the segmentation model (U-net architecture) and (B) the grading model (a densely connected neural network classifier on top of the Vgg16 convolution-base).
图 2. 示意图:(A)分割模型(U-net 架构)和(B)分级模型(在 Vgg16 卷积基础之上的密集连接神经网络分类器)。

Fig. 3. (A) Boxplots of the DSC distribution for the 5 test data sets (Set 1 to Set 5) used for segmentation model validation. The DSC mean values are given in the boxes and the orange lines refer to the DSC median values. (B) Confusion matrix for the tumor detection showing the number of images of the true and predicted normal and tumor labels. (For interpretation of the references to colour in this figure legend, the reader is referred to the Web version of this article.)
图 3. (A) 用于验证分割模型的5个测试数据集(集合1至集合5)的DSC分布的箱形图。箱内给出了DSC的平均值,橙色线表示DSC的中位数。(B) 肿瘤检测的混淆矩阵,显示真实和预测的正常与肿瘤标签的图像数量。(关于此图例中颜色引用的解释,读者可参考本文的网络版本。)
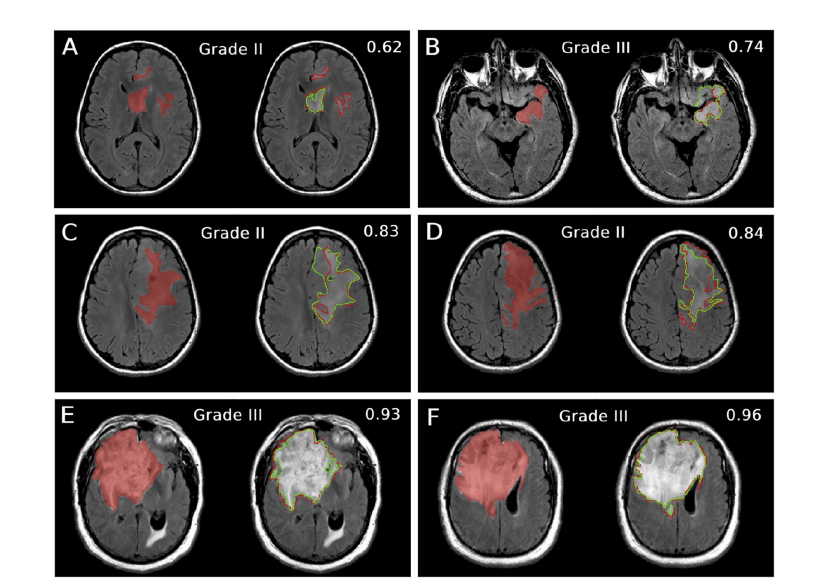
Fig. 4. Samples from the test data sets showing heatmaps of FLAIR images for highlighted tumor regions and overlays of FLAIR images and tumor masks’ outlines(red – manual segmentation and green – model segmentation) for DSC values (A) and (B) lower than, (C) and (D) similar, and (E) and (F) larger than model DSC mean value (0.84). The heat maps are shown at the left while the overlays are shown at the right of each panel. The tumor grade and the DSC value are given at the top and top right of each panel.
图 4. 展示来自测试数据集的样本,其中FLAIR图像的热图突出显示了肿瘤区域,以及FLAIR图像与肿瘤掩模轮廓的叠加图(红色 - 手工分割,绿色 - 模型分割)对应于DSC值(A)和(B)低于、(C)和(D)接近以及(E)和(F)高于模型DSC平均值(0.84)。热图显示在每个面板的左侧,而叠加图显示在右侧。每个面板的顶部和右上角给出了肿瘤等级和DSC值。
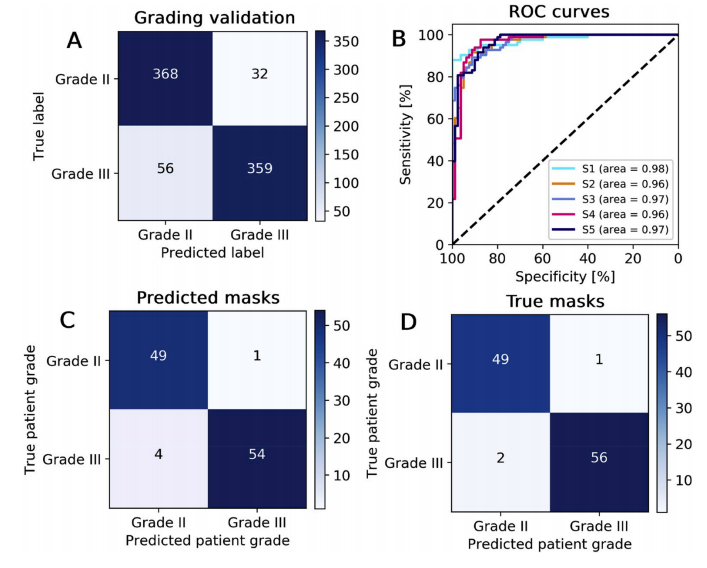
Fig. 5. (A) Confusion matrix for the grading models showing the number of images of the true and predicted tumor grades, (B) Receiver Operating Characteristics (ROC) curves for the grading model using the 5 different test data sets S1 – S5. The area under the curves are given in the figure label, (C), and (D) Confusions matrix for the patient tumor grading using MRI images selection based on predicted tumor masks (model segmentation) and true tumor masks (manual segmentation), respectively.
图 5. (A) 分级模型的混淆矩阵,显示真实和预测肿瘤等级的图像数量,(B) 使用5个不同测试数据集S1至S5的分级模型的接收者操作特性(ROC)曲线。曲线下面积在图例中给出,(C) 和 (D) 分别使用基于预测肿瘤掩模(模型分割)和真实肿瘤掩模(手工分割)的MRI图像选择进行患者肿瘤分级的混淆矩阵。
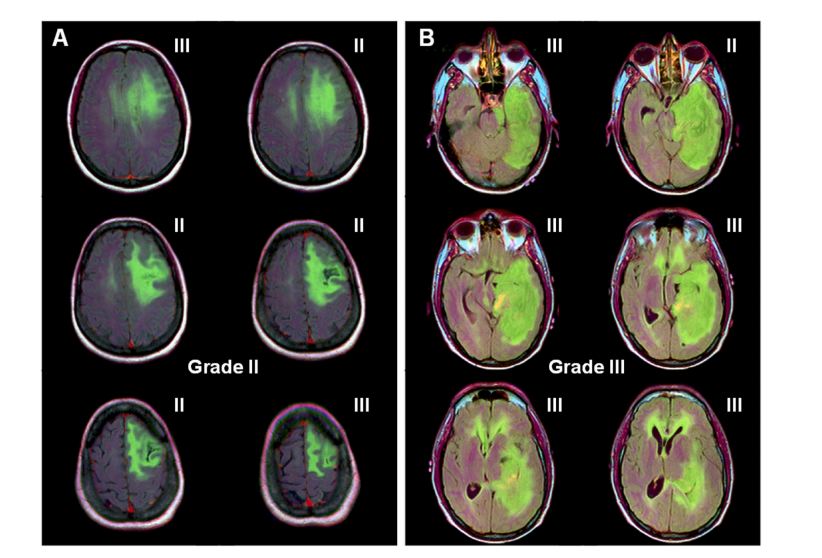
Fig. 6. (A) A sample patient classified with grade II tumor (4 out of six images classified with grade II tumor). (B) A sample patient classified with grade III tumor (5out of six images classified with grade III tumor).
图 6. (A) 一个被分类为II级肿瘤的样本患者(六张图像中有四张被分类为II级肿瘤)。(B) 一个被分类为III级肿瘤的样本患者(六张图像中有五张被分类为III级肿瘤)。
Table
表
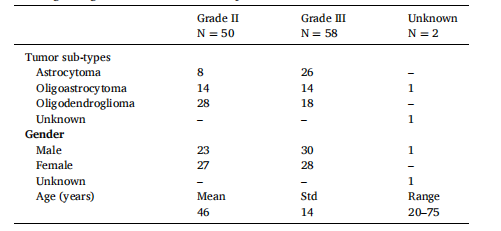
Table 1 Lower-grade glioma tumor (LGG) and patient characteristics.
表 1低级别胶质瘤(LGG)肿瘤和患者特征。

Table 2 Tumor detection and grading results.
表 2肿瘤检测和分级结果
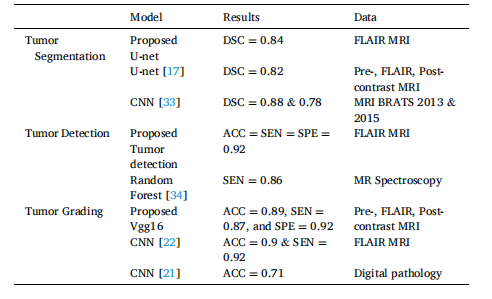
Table 3 Summary of results’ comparisons: DSC, accuracy (acc), Sensitivity (sen), andSpecificity (spe).
表 3结果比较总结:Dice 相似系数(DSC)、准确率(acc)、敏感性(sen)和特异性(spe)。

