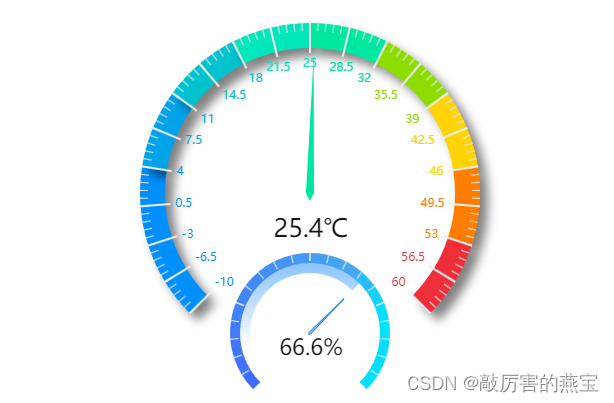
示例:
代码:
TemperatureAndHumidity.vue组件
//温湿度仪表盘
<template>
  <div>
    <!-- 在这里放置你的图表组件 -->
    <div ref="echarts" style="width: 100%; height: 400px;"></div>
  </div>
</template>

<script>
export default {
  name: 'TemperatureAndHumidity',
  props: {
    data: {
      type: Object,
      //包含value和text
      required: true
    }
  },


  mounted() {
    this.renderChart();
  },
  methods: {
    renderChart() {
      const echarts = require('echarts');
      const myChart = echarts.init(this.$refs.echarts);

      var data1 = this.data.data1
      var data2 = this.data.data2

      var axislineColor = new echarts.graphic.LinearGradient(0, 0, 1, 0, [{
        offset: 0,
        color: "#25ABAA",
      },
        {
          offset: 0.2,
          color: "#25ABB4",
        },
        {
          offset: 0.3,
          color: "#FBB8AA",
        },
        {
          offset: 0.5,
          color: "#F89700",
        },

        {
          offset: 1,
          color: "#F63332",
        },
      ]);

      const option ={
          // backgroundColor: "rgba(0,0,0)",
          grid: { // 让图表占满容器
            // height: "80%", // 高度
            // left: "6%",
            // right: "6%",
            bottom: "0%",
            top: "0%",
            // height: "85%",
            containLabel: true,
          },
          tooltip: {
            formatter: "{当前温度}: {c}%",
          },
          series: [
            {
            name: "大的进度条进度条",
            type: "gauge",
            center: ['50%', '45%'],
            radius: "85%",
            splitNumber: 20,
            min: -10, //最小刻度
            max: 60, //最大刻度
            axisLine: {
              lineStyle: {
                color: [
                  [0.2, '#008FFF'],
                  [0.3, '#00A2E8'],
                  [0.4, '#00C3CD'],
                  [0.5, '#00E7BB'],
                  [0.6, '#00E79F'],
                  [0.7, '#8CDC00'],
                  [0.8, '#FFD306'],
                  [0.9, '#FF7D00'],
                  [1, '#ee2e38']
                  // [0.4, '#00A2E8'],
                  // [0.6, '#95EC69'],
                  // [1, '#ee2e38']
                  // [data1 / 60, colorSet.color],
                  // [1, "#5A5A89"],
                ],
                //大刻度盘加宽
                width: 25,
                //图形阴影的模糊大小。会变立体
                shadowColor: 'rgba(0, 0, 0, 0.5)',
                shadowBlur: 10,
                //阴影水平方向上的偏移距离
                shadowOffsetX: 8,
                //阴影垂直方向上的偏移距离。
                shadowOffsetY: 8,
                opacity: 1,
              },
            },
            axisLabel: {
              show: true,
            },
            axisTick: {
              show: true,
            },
              //白色标记长线
            splitLine: {
              show: true,
              //分隔线线长。支持相对半径的百分比
              length: 30,
              distance:20,

            },
            itemStyle: {
              show: false,
            },
            detail: {

              formatter: function (value) {
                if (value !== 0) {
                  //四舍五入
                  // var num = Math.round(value);
                  // return parseInt(num).toFixed(0) + "℃";
                  return value + "℃";
                } else {
                  return 0;
                }
              },
              // offsetCenter: [0, 50],
              offsetCenter: [1, "22%"],

              textStyle: {
                padding: [0, 0, 0, 0],
                fontSize: 25,
                fontWeight: "400",

                color: "#131313",
              },
            },
            title: {
              //标题
              show: true,
              offsetCenter: [0, '35%'], //设置标题位置
              textStyle: {
                color: "#fff",
                fontSize: 18, //表盘上的标题文字大小
                fontFamily: "PingFangSC",
              },
            },
            data: [{
              // name: "温度",
              value: data1,
            },],
            pointer: {
              show: true,
              length: "80%",
              radius: "15%",
              width: 4, //指针粗细
              color: [
                axislineColor
                  [1, new echarts.graphic.LinearGradient(0, 0, 1, 0, [{
                  offset: 0.1,
                  color: "#FFC600"
                },
                  {
                    offset: 0.6,
                    color: "#30D27C"
                  },
                  {
                    offset: 1,
                    color: "#0B95FF"
                  }
                ])]
              ]
            },
            animationDuration: 4000,
          },

            // 下面圆环
            {
              name: "小的内圈",
              type: "gauge",
              radius: "40%",
              center: ['50%', '80%'],
              startAngle: 225,
              endAngle: -45,
              min: 0,
              max: 100,
              axisLine: {
                show: true,
                lineStyle: {
                  // 阴影范围
                  width: 20,
                  color: [
                    [
                      data2 / 100,
                      new echarts.graphic.LinearGradient(0, 1, 0, 0, [{
                        offset: 0,
                        color: "rgba(69, 161, 255,0)",
                      },
                        {
                          offset: 0.3,
                          color: "rgba(69, 161, 255,0)",
                        },
                        {
                          offset: 1,
                          color: "rgba(69, 161, 255,0.7)",
                        },
                      ]),
                    ],
                    [1, "rgba(28,128,245,.0)"],
                  ],
                },
              },
              axisTick: {
                show: false,
              },
              splitLine: {
                show: 0,
              },
              axisLabel: {
                show: 0,
              },
              pointer: {
                show: true,
                width: 1,
                length: '60%',
                shadowColor: '#ccc', //默认透明
                shadowBlur: 1,
                shadowOffsetX: 1,
                shadowOffsetY: 3

              },
              detail: {
                show: true,
                offsetCenter: [1, "20%"],
                textStyle: {
                  fontSize: 22,
                  color: "#131313",
                },
                formatter: function (value) {
                  if (value !== 0) {
                    // var num = Math.round(value);
                    // return parseInt(num).toFixed(0) + "%";
                    return value + "%";
                  } else {
                    return 0;
                  }
                },
              },
              itemStyle: {
                color: "rgba(28, 128, 245,.3)",
                borderColor: "rgba(28, 128, 245,1)",
              },
              data: [{
                value: data2,
                // name: '湿度'
              },],
              title: {
                //标题
                show: true,
                offsetCenter: [0, '45%'], //设置标题位置
                textStyle: {
                  color: "#fff",
                  fontSize: 16, //表盘上的标题文字大小
                  fontFamily: "PingFangSC",
                },
              },
            },

            {
              name: "小的外圈",
              type: "gauge",
              radius: "40%",
              center: ['50%', '80%'],
              splitNumber: 4,
              splitLine: {
                show: false,
              },
              min: 0,
              max: 100,
              startAngle: 225,
              endAngle: -45,
              axisLabel: {
                show: false,
              },
              axisLine: {
                show: true,
                lineStyle: {
                  //小的宽度
                  width: 10,
                  color: [
                    // [0.4, '#00A2E8'],
                    // [0.7, '#93FE94'],
                    // [1, '#E0272A']
                    [0.05, "#3F6BFC"],
                    [0.1, "#4072FB"],
                    [0.15, "#4077F9"],
                    [0.2, "#417BF9"],
                    [0.25, "#4282F8"],
                    [0.3, "#4385F7"],
                    [0.35, "#4389F6"],
                    [0.4, "#448FF5"],
                    [0.45, "#4594F4"],
                    [0.5, "#4599F3"],
                    [0.55, "#469EF2"],
                    [0.6, "#46A3F1"],
                    [0.65, "#46A6F0"],
                    [0.7, "#24befe"],
                    [0.75, "#12d1ff"],
                    [0.8, "#06defe"],
                    [0.85, "#05e0ff"],
                    [0.9, "#06deff"],
                    [0.95, "#06deff"],
                    [1, "#06deff"],
                  ],
                },
              },
              pointer: {
                show: 0,
              },
              axisTick: {
                show: true,
              },
              detail: {
                show: false,
              },
            }
          ],
        }
      ;

      myChart.setOption(option);
    }
  }
};
</script>

<style>
/* 这里可以添加样式 */
</style>
主页面调用:
 <el-col :xs="24" :sm="24" :lg="12">
        <div class="chart-wrapper">
          <temperature-and-humidity :data="TemperatureAndHumidityData"/>

        </div>
      </el-col>
<script>
//引用
//温湿度
import TemperatureAndHumidity  from "@/views/dashboard/TemperatureAndHumidity";


export default {

  name: 'Index',
//数据
  data() {
    return {

     //温湿度信息
      TemperatureAndHumidityData: {
        data1: 25.4,
        data2:66.6
      }


    }
  },
}
</script>