1.Prometheus 部署
从官网下载页面找到最新的二进制文件下载
cd ~
curl -LO https://github.com/prometheus/prometheus/releases/download/v2.51.1/prometheus-2.51.1.linux-amd64.tar.gz
将文件解压到指定目录
tar xf prometheus-2.51.1.linux-amd64.tar.gz -C /usr/local
为了方便配置,可以做软连接
ln -sv /usr/local/prometheus-2.51.1.linux-amd64/ /usr/local/Prometheus
接着修改prometheus的配置文件
在global设置中,定义抓取指标的默认时间间隔。请注意,除非单个导出器自己的设置覆盖全局变量,否则Prometheus会将这些设置应用于每个导出器。
scrape_interval值告诉Prometheus 每15秒从其出口商那里收集指标,这对于大多数出口商而言足够长。
使用scrape_configs指令将Prometheus本身添加到导出器列表中。
使用job_name在标签和图表上标记出口商,因此请务必在此处选择描述性内容。
使用static_configs和targets指令来确定导出器的运行位置。
[root@prometheus ~]# vim /usr/local/Prometheus/prometheus.yml
# my global config
global:
  scrape_interval:     15s # Set the scrape interval to every 15 seconds. Default is every 1 minute.
  evaluation_interval: 15s # Evaluate rules every 15 seconds. The default is every 1 minute.
  # scrape_timeout is set to the global default (10s).

# Alertmanager configuration
alerting:
  alertmanagers:
  - static_configs:
    - targets:
      # - alertmanager:9093

# Load rules once and periodically evaluate them according to the global 'evaluation_interval'.
rule_files:
  # - "first_rules.yml"
  # - "second_rules.yml"

# A scrape configuration containing exactly one endpoint to scrape:
# Here it's Prometheus itself.
scrape_configs:
  # The job name is added as a label `job=<job_name>` to any timeseries scraped from this config.
  - job_name: 'prometheus'

    # metrics_path defaults to '/metrics'
    # scheme defaults to 'http'.

    static_configs:
    - targets: ['localhost:9090']
创建Prometheus的systemd服务
sudo vim /etc/systemd/system/prometheus.service
服务文件告诉systemd,您将Prometheus作为prometheus用户运行,并且配置文件位于/etc/prometheus/prometheus.yml目录中,并将其数据存储在/var/lib/prometheus目录中。配置文件内容如下:
[Unit]
Description=Prometheus
Wants=network-online.target
After=network-online.target
[Service]
# 账户和组设置,可以保证数据安全
# User=prometheus
# Group=prometheus
Type=simple
ExecStart=/usr/local/Prometheus/prometheus \
--config.file /usr/local/Prometheus/prometheus.yml \
# --storage.tsdb.path /var/lib/prometheus/ \
--web.console.templates=/usr/local/Prometheus/consoles \
--web.console.libraries=/usr/local/Prometheus/console_libraries
[Install]
WantedBy=multi-user.target
编辑完成后保存退出,要使用新创建的服务,需要重新加载systemd。
sudo systemctl daemon-reload
并可以使用以下命令启动Prometheus:
sudo systemctl start prometheus
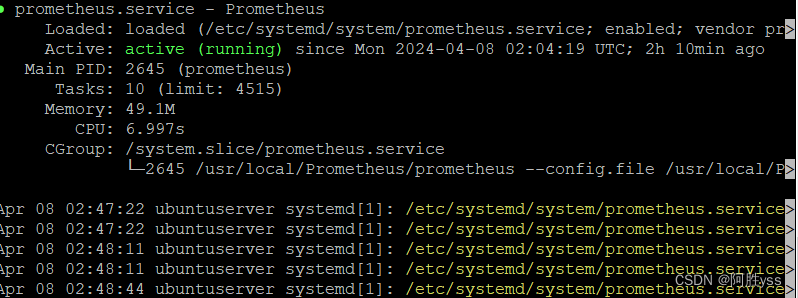
要确保Prometheus正在运行,可以检查服务的状态。
sudo systemctl status prometheus
输出结果会告诉您Prometheus的状态,主进程标识符(PID),内存使用等。如果服务的状态不是active,在继续本教程之前重新跟踪上述步骤以解决问题。
按Q可退出status命令。通过如下URL可以打开prometheus的自带监控界面: localhost:9090,当然端口或IP也可以自己设定。
启用服务以在开机时启动:
sudo systemctl enable prometheus
2.部署Node Exporter (被监控主机需要安装的软件)
各组件默认端口:
node 默认端口:9100
mysql默认端口:9104
redis 默认端口:9121
process默认端口:9256
alertmanager默认端口:9093
要将Prometheus扩展到仅关于自身的指标之外,我们将安装另一个名为Node Exporter的节点导出器。节点导出器提供有关系统的详细信息,包括CPU,磁盘和内存使用情况。 把版本和下载链接更换一下就行了
cd ~
curl -LO https://github.com/prometheus/node_exporter/releases/download/v1.1.2/node_exporter-1.1.2.linux-amd64.tar.gz
sha256um node_exporter-1.1.2.linux-amd64.tar.gz
tar xf node_exporter-1.1.2.linux-amd64.tar.gz -C /usr/local
接着为Node Exporter创建Systemd服务文件。
sudo vim /etc/systemd/system/node_exporter.service
将以下内容复制上去,编辑完成后保存退出。(注意文件名版本号)
[Unit]
Description=Node Exporter
Wants=network-online.target
After=network-online.target

[Service]
Type=simple
ExecStart=/usr/local/node_exporter-1.1.2.linux-amd64/node_exporter

[Install]
WantedBy=multi-user.target
重新加载systemd以使用新的创建的服务。
sudo systemctl daemon-reload
运行Node Exporter。
sudo systemctl start node_exporter
如果想额外配置mysql、redis之类的,步骤如三、四类似
3.配置Prometheus以刮取节点导出器
因为Prometheus只抓取在其配置文件scrape_configs部分中定义的导出器,所以我们需要为Node Exporter添加一个条目,就像我们为Prometheus本身所做的那样。
修改prometheus的配置文件。
[root@prometheus ~]# vim /usr/local/Prometheus/prometheus.yml
# my global config
global:
  scrape_interval:     15s # Set the scrape interval to every 15 seconds. Default is every 1 minute.
  evaluation_interval: 15s # Evaluate rules every 15 seconds. The default is every 1 minute.
  # scrape_timeout is set to the global default (10s).

# Alertmanager configuration
alerting:
  alertmanagers:
  - static_configs:
    - targets:
      # - alertmanager:9093

# Load rules once and periodically evaluate them according to the global 'evaluation_interval'.
rule_files:
  # - "first_rules.yml"
  # - "second_rules.yml"

# A scrape configuration containing exactly one endpoint to scrape:
# Here it's Prometheus itself.
scrape_configs:
  # The job name is added as a label `job=<job_name>` to any timeseries scraped from this config.
  - job_name: 'prometheus'
    scrape_interval: 5s

    # metrics_path defaults to '/metrics'
    # scheme defaults to 'http'.

    static_configs:
    - targets: ['localhost:9090']

  - job_name: 'node_exporter'
    scrape_interval: 5s
    static_configs:
      - targets: ['localhost:9100']
重新启动prometheus并检查运行状态。
sudo systemctl restart prometheus
sudo systemctl status prometheus
4.添加节点进行主机管理
在添加大量主机集群时,一台一台在prometheus.yml中添加,显然不太方便,我们通过编写发现文件,进行批量主机管理。
cd /usr/local/Prometheus
mkdir -p /usr/local/Prometheus/targets/node
sudo vim /usr/local/Prometheus/targets/node/node.yml
# 监控的目标列表
- targets:
  - '172.16.12.1:9100'
  - '172.16.12.5:9100'
  - '172.16.12.110:9100'
  - '172.16.12.112:9100'
  labels:
    idc: "Temporary RWE Server"      # 备注集群名
修改prometheus配置文件。
vim /usr/local/Prometheus/prometheus.yml
添加如下代码
  - job_name: 'nm_mch-app_node'
    file_sd_configs:
      - files: ['/usr/local/Prometheus/targets/node/node.yml']
        refresh_interval: 5s
重新启动prometheus并检查运行状态。
sudo systemctl restart prometheus
sudo systemctl status prometheus
5.使用Grafana创建可视化Dashboard
Prometheus UI提供了快速验证PromQL以及临时可视化支持的能力,而在大多数场景下引入监控系统通常还需要构建可以长期使用的监控数据可视化面板(Dashboard)。这时用户可以考虑使用第三方的可视化工具如Grafana,Grafana是一个开源的可视化平台,并且提供了对Prometheus的完整支持。
可在官网下载最新的二进制文件,tar安装过程参考如下:
wget https://dl.grafana.com/oss/release/grafana-8.0.4.linux-amd64.tar.gz
tar -zxvf grafana-8.0.4.linux-amd64.tar.gz -C /usr/local
ln -sv /usr/local/grafana-8.0.4/ /usr/local/Prometheus_grafana
配置systemd启动Grafana。
sudo vim /etc/systemd/system/grafana-server.service
[Unit]
Description=Grafana
After=network-online.target

[Service]
ExecStart=/usr/local/Prometheus_grafana/bin/grafana-server --config=/usr/local/Prometheus_grafana/conf/defaults.ini --homepath=/usr/local/Prometheus_grafana

[Install]
WantedBy=multi-user.target
重载配置
systemctl daemon-reload
systemctl start grafana-server
systemctl status grafana-server
Dashboard通过 https://grafana.com/dashboards 网站,可以找到大量可直接使用的Dashboard。Grafana中所有的Dashboard通过JSON进行共享,下载并且导入这些JSON文件,就可以直接使用这些已经定义好的Dashboard
参考文献
大神博客
Prometheus中文文档