一. 计算效率
1. 测量代码运行时间 %%time %%timeit
单纯计算 代码块执行的时长
%%time
_sum(np.arange(6))
CPU times: total: 0 ns
Wall time: 1.66 ms


用于多次运行代码块并计算平均执行时间
%%timeit
_sum(np.arange(6))

738 ns ± 10.7 ns per loop (mean ± std. dev. of 7 runs, 1,000,000 loops each)
2. 装饰器 @nb.jit (import numba as nb) (提高执行的速度)
这个函数接受一个可迭代对象 x,并返回其所有元素的总和。
通过使用 @nb.jit(nopython=True) 装饰器,
函数将在 Numba 中被编译为机器码,以提高执行速度。

@nb.jit(nopython = True)
def _sum(x):
    result = 0
    for i in x:
        result += i
    return result


_sum(np.arange(100))
3. 闭包
- 在一个函数内部定义了另一个函数,并且这个内部函数引用了外部函数的局部变量
- 简单说就是函数下嵌套一个函数
这里的outer 返回 inner 函数,然后 inner再

当调用 outer("yx") 时,它会返回一个函数 inner,并且这个 inner 函数中的 x 被设定为 "yx"。
但是,inner 函数并不会立即执行,而是被返回给调用者。

我们将返回的函数赋值给变量 func。
此时,func 实际上是一个函数,即 inner 函数。

def outer(x):
    def inner(y):
        return x +  " like "+ y
    return inner

func = outer("yx")
func("apple")

结果是  yx  like apple
3.1 闭包和装饰器的结合
def outer(func):
    def inner(y):
        x = "吴雨龙"
        return func(x + "吃" + y)
    return inner

@outer     #outer(my_func)
def my_func(text):
    return text

result = my_func("苹果")
print(result)  # 输出:吴雨龙吃苹果

解释: @outer 装饰器 相当于把 my_func(苹果)整体 传给了 outer,
所以 outer(my_func(苹果))  -- inner(苹果)--
4. swifter 提高并行处理能力
通过 switer 可以提升 并行处理能力
import swifter
df.swifter.apply(lambda x : x["数量"] * x["单价"],axis=1)
5. pandarallel
from pandarallel import pandarallel

pandarallel.initialize(nb_workers=8)
初始化 Pandarallel 库,设置并行处理的工作线程数为 8。
这意味着在后续的 Pandas 操作中,可以同时使用多达 8 个工作线程来并行处理数据,
以提高数据处理速度。


df.parallel_apply(np.sum,axis=1)
parallel_apply 函数会在多个工作线程上并行应用 np.sum 函数到数据框的每一行上,从而加速了计算过程。
二. 快速构图
1. np.linspace() 创建等间隔数组
用于创建等间隔的一维数组(向量)
np.linspace(1,10,num=20,endpoint=False)
'''
array([1.  , 1.45, 1.9 , 2.35, 2.8 , 3.25, 3.7 , 4.15, 4.6 , 5.05, 5.5 ,
       5.95, 6.4 , 6.85, 7.3 , 7.75, 8.2 , 8.65, 9.1 , 9.55])
'''
闭区间  endpoint可以控制区间类型

start  end ,  endpoint = True  区间是闭区间
2. 建立 x,y 轴. X大写, y 小写
- import scipy.stats as stats
- 使用
stats来执行各种统计分析,比如计算均值、方差、概率密度函数、累积分布函数
# y = f(x)
X = np.linspace(-5,5,200)

#概率密度函数  均值=中位数=众数=0   标准差=1
y = stats.norm.pdf(X) / np.max(stats.norm.pdf(X))
3. 线型图的绘制
3.1 需要的库
from matplotlib import pyplot as plt  #画图层
from matplotlib import style
import warnings
warnings.filterwarnings("ignore")
import scipy.stats as stats
3.2 配置图的大小 颜色 字体等
获取所有的背景主题
print(style.available)

#配置
style.use("fivethirtyeight")  #颜色主题

plt.rcParams["figure.figsize"] = (10,6.18) # 尺寸大小 单位是英寸

plt.rcParams["figure.dpi"] = 100   #清晰度

plt.rcParams["font.sans-serif"] = ["SimHei"]  #微软黑体字

plt.rcParams["axes.unicode_minus"] = False   #调控负号问题
3.3 画图
线形图
plt.plot(X,y,label="PDF") label 是标签

plt.fill(X,y,alpha=0.5) #透明度

y1 = stats.norm.cdf(X)  #累积分布函数

plt.plot(X,y1,label="CDF")

plt.legend()  # 添加图例,就是说明那条线是哪一个


刻度控制
plt.xticks(np.arange(-5,6)) #np.arange() 是左闭右开的
plt.yticks(np.arange(0,11)/10)

刻度轴标题
plt.xlabel("x的标题",fontsize=15)
plt.ylabel("y的标题",fontsize=15,c="red")

注释部分
plt.text(-3.5,0.7,"我是注释")


去除背景
plt.grid()

保存图形
plt.savefig("./demo.png",dpi=100)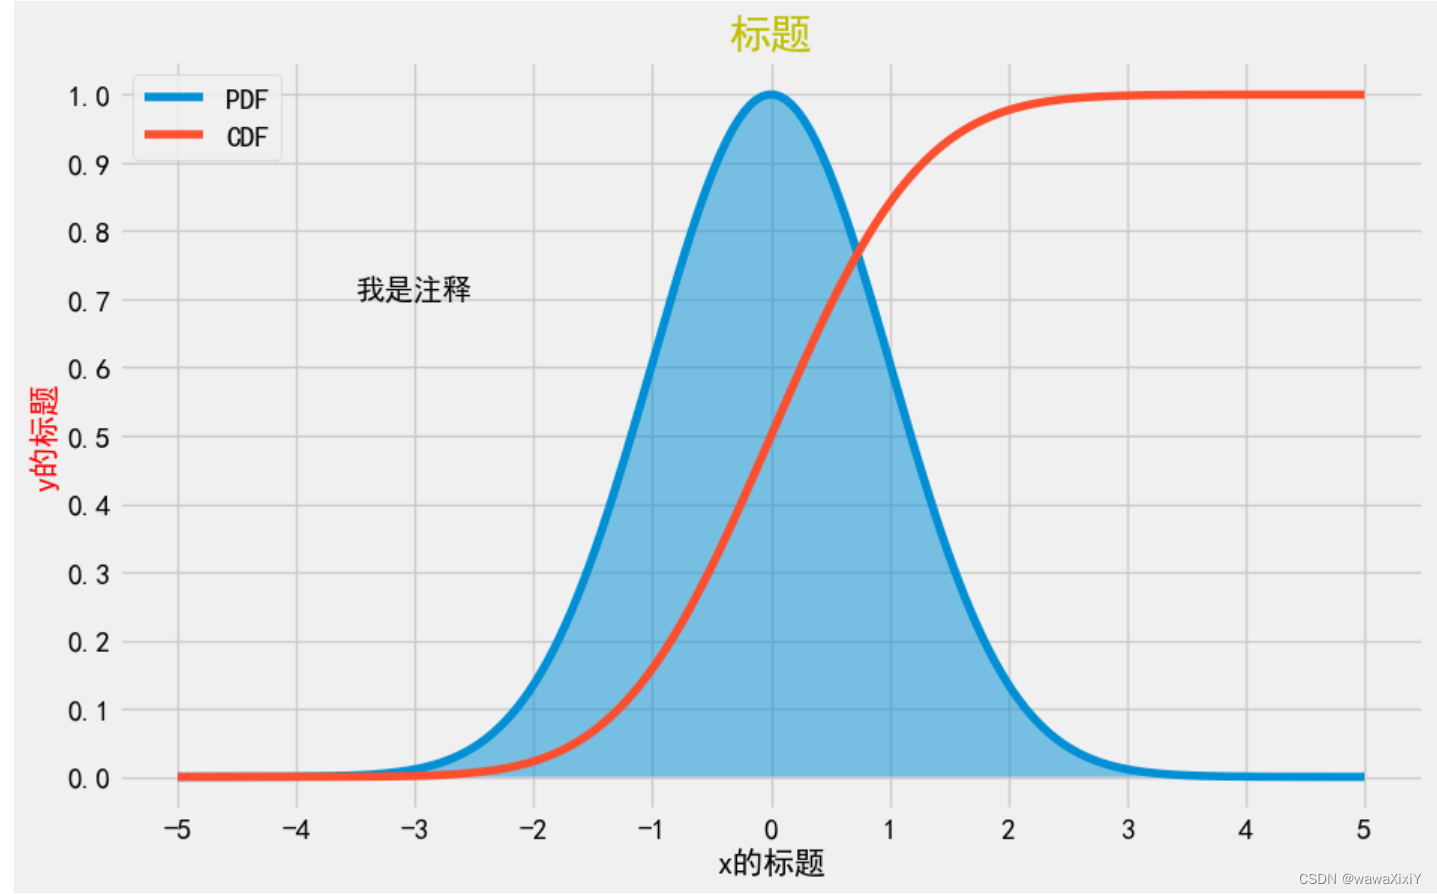
4.点线面控制
%matplotlib inline
X = np.linspace(-5,5,20)

y = np.sin(X)


'''
ls : 线的样式 - 实线  -- 虚线  : 虚线  -.感叹线
lw : 线宽
marker : 点样式 o s D d x X
markersize : 点大小
markerfacecolor : 面的颜色
markeredgecolor : 边缘颜色
'''
plt.plot(X,y,ls=":",lw=1,marker="X",markersize=20,markerfacecolor="white",markeredgecolor="orange")


标记数据

for a,b in list(zip(X,y)):
    plt.text(a-0.15,b-0.01,s=round(b,2),fontsize=10,color="#ff00005f")

   s = : s后面写的是你要标记的数据
4.柱状图
#不要使用 数字以外 的数据作为轴

plt.bar(np.arange(data.index.size),data.金额,width=.4)
 画图的时候 ,x轴使用的  城市的 下标

xticks 可以执行映射  把数字部分 替换程  文字部分
plt.xticks(np.arange(data.index.size),data.index,rotation=90)
rotation 是把横坐标 字进行转动


for a,b in list(zip(np.arange(data.index.size),data.金额)):
    plt.text(a-.1,b,b,rotation=90)

这里的 zip(np.arange(data.index.size) 是因为 直接使用 文字作为横坐标
下面不能 调整 他的位置,因为不能对齐进行加减
空画布画法:
针对某一个画布时:要用set_xticks
plt.figure(figsize=(20,6))
#不要使用 数字以外 的数据作为轴

#1.生成一个空画布
axes1 = plt.gca()

#2.把金额的柱状图绘制在 画布1
axes1.bar(np.arange(data.index.size),data.金额,width=.4,color='r',label="销售额")  #画图的时候 ,x轴使用的  城市的 下标

#3. 公用一条轴
axes2 = axes1.twinx()   #返回画布2

# +.4 偏移图形
axes2.bar(np.arange(data.index.size)+.4,data.数量,width=.4,label="销量")

#xticks 可以执行映射  把数字部分 替换程  文字部分
axes1.set_xticks(np.arange(data.index.size),data.index,rotation=90)


for a,b in list(zip(np.arange(data.index.size),data.金额)):
    axes1.text(a-.1,b,b,rotation=90)

for a,b in list(zip(np.arange(data.index.size),data.数量)):
    axes2.text(a+.25,b,b,rotation=90)

axes1.grid(False)
axes2.grid(False)

#调节legend的位置
axes1.legend(loc=[0,1])  # 当前的 1 比例是整个画布的长度或宽度比例
axes2.legend(loc=[0.1,1])
5.多图组合
#1.先设置空画布

axes1 = plt.gca()

#2.在空画布当中绘制图形  ,x轴 最好使用 索引
inds = np.arange(data.index.size)

axes1.bar(inds,data.金额,color="purple",label="销售额")

#3.将x轴进行映射
axes1.set_xticks(inds,data.index,rotation=90,fontsize=10)


#4.设置共轴

axes2 = axes1.twinx()

axes2.plot(inds,data.数量,color="orange",alpha=0.8,ls="--",lw=1.5,marker="o",markerfacecolor="b",label="销量")


#5.设置y轴的标签
axes1.set_ylabel("销售额(元)")

axes2.set_ylabel("销量(件)")


#6.设置图例
axes1.legend(loc=[0,1.1])
axes2.legend(loc=[0,1.04])

axes1.grid(False)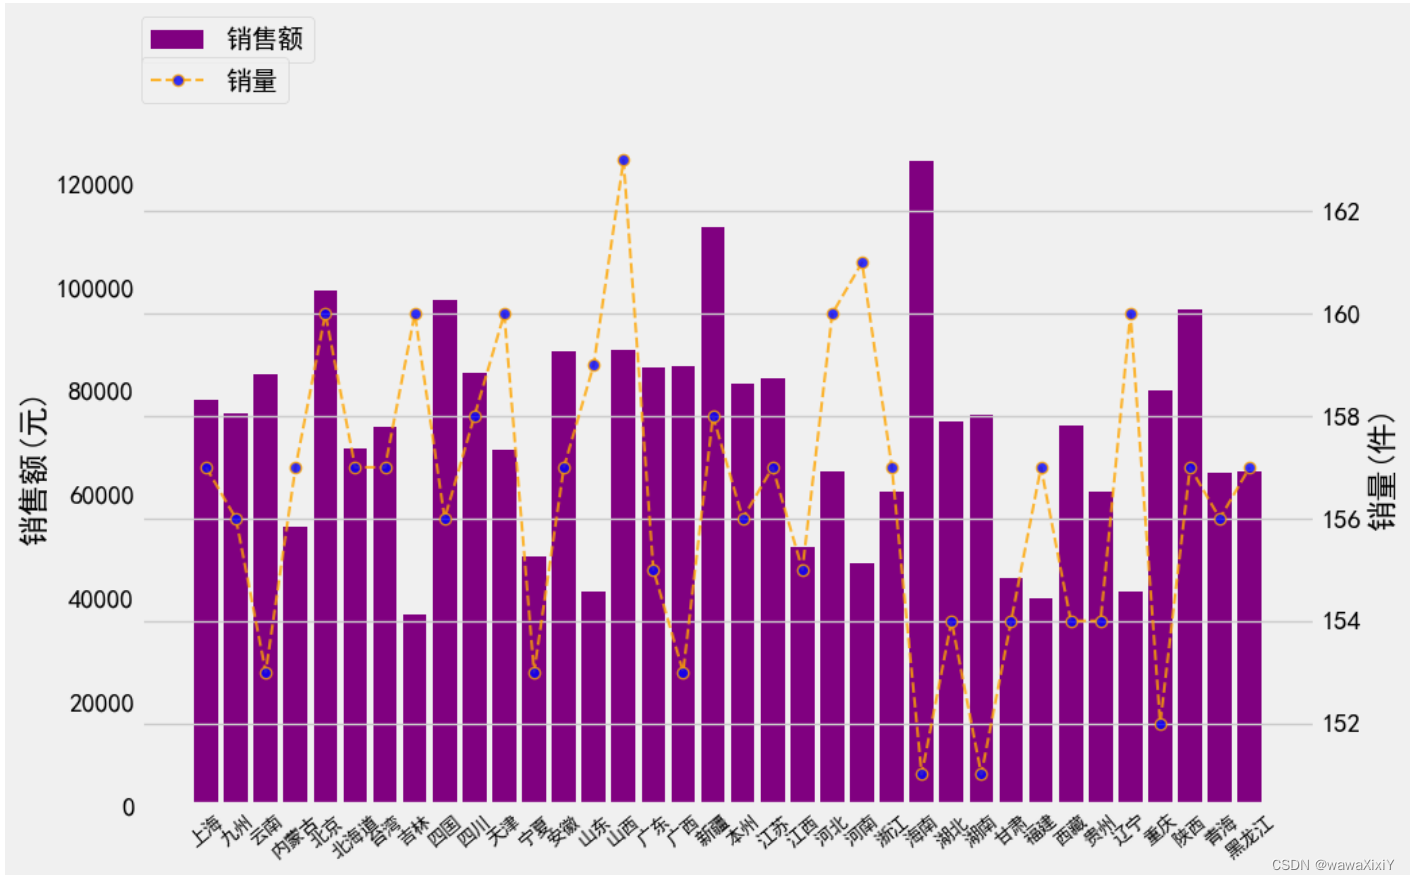
6. 直方图
pd.cut(d,bins=10)  分箱
plt.hist(d,bins=10)
7. 饼图
import seaborn as sns   颜色调色板
sns.palplot(sns.color_palette("hls",10)) 设置的颜色

#获取最大值索引
mi = da.金额.reset_index(drop=True).idxmax()
#飞离效果 数组生成
ex = np.zeros(da.shape[0])
ex[mi]=0.1

a = plt.pie(
    da.金额,
    labels=da.index,
    colors = sns.color_palette("hls",da.shape[0]),
    autopct="%.2f%%",  # 计算每块的比例
    explode = ex,       # 分离效果
    wedgeprops={"width":.4},  # 宽带边缘属性
    pctdistance=0.75,          # 就是调整比例数值位置
    textprops={"fontsize":10,"color":"k"} #比例数字属性
)

plt.legend(labels=[f"{a}={b}元" for a,b in  zip(da.index,da.金额)],loc=[0,-.4],ncol=2)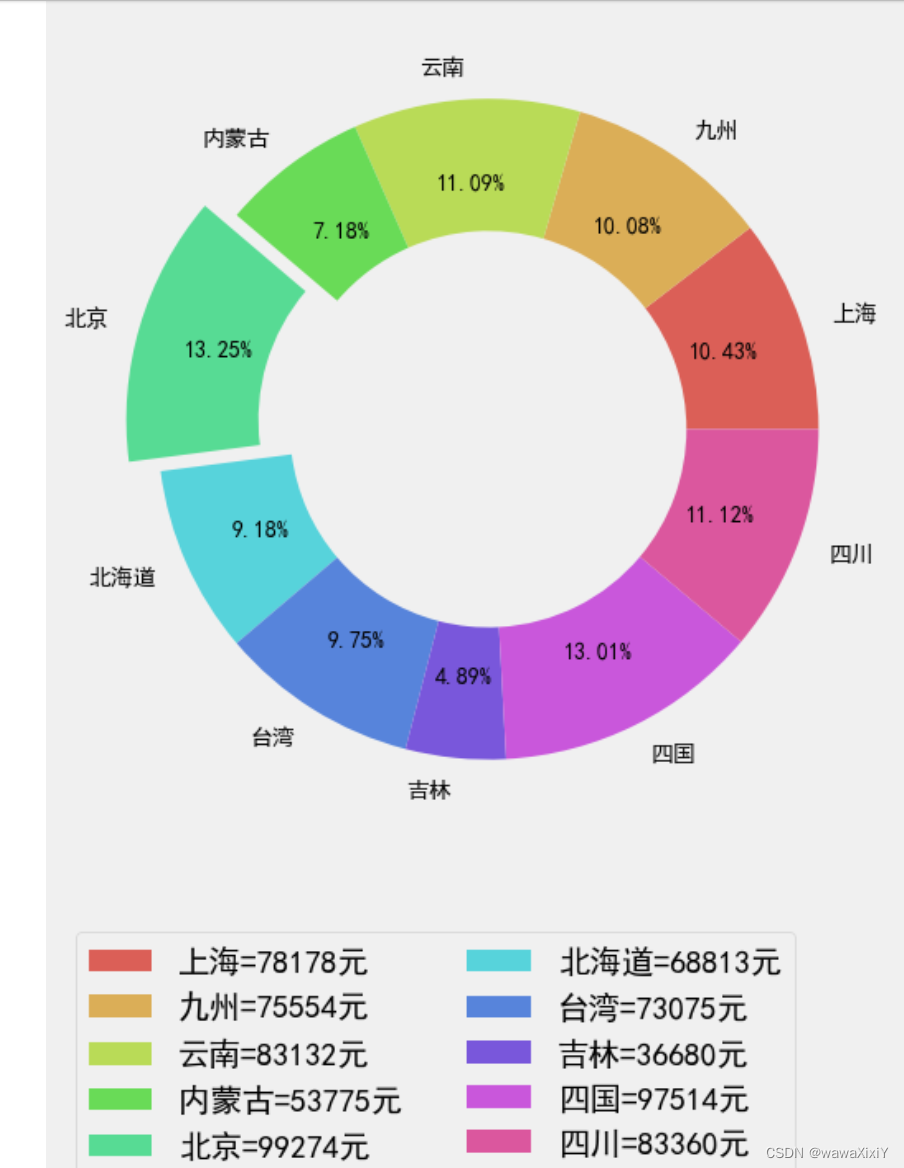
8. 旭日图
plt.pie(
    total.金额,
    colors = sns.color_palette("summer",total.shape[0]),
    autopct="%.2f%%",
    radius=0.5, #半径
)

a = plt.pie(
    tmp.金额,
    labels=tmp.省份,
    colors = sns.color_palette("summer",tmp.shape[0]),
    explode=np.full(tmp.shape[0],0.01),
    wedgeprops={"width":.4},
    pctdistance=0.75,
    textprops={"fontsize":10,"color":"k"}
)

plt.text(0.1,0.1,"中国")

# plt.text(0.1,-0.1,"日本")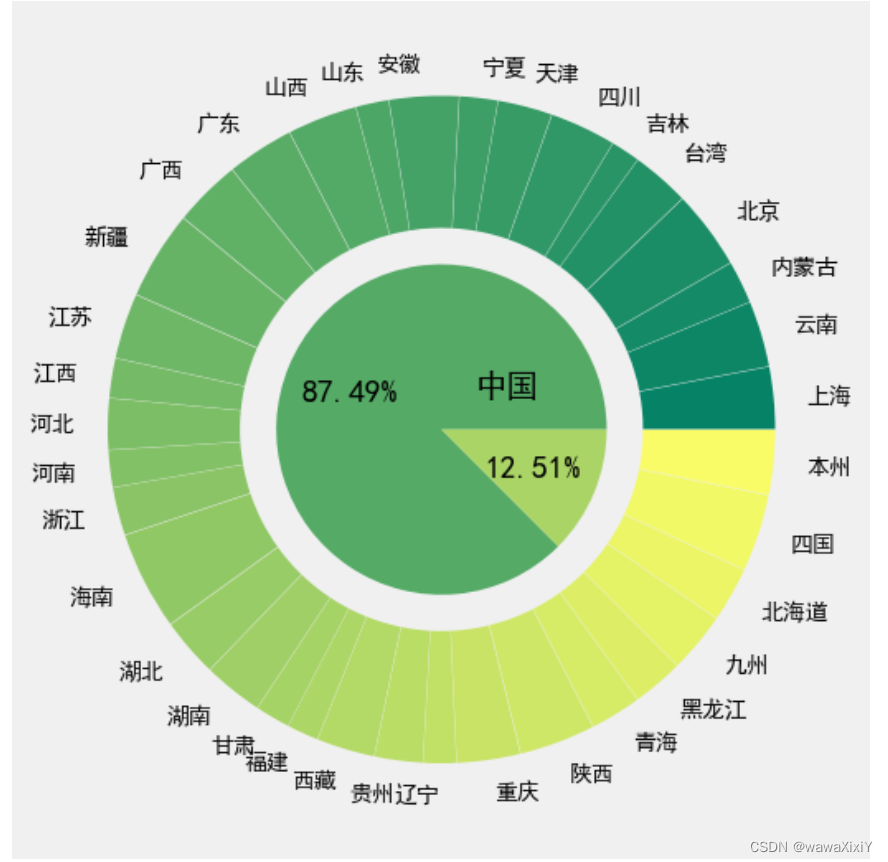






![[dvwa] Command Injection](https://img-blog.csdnimg.cn/direct/6a3b0c1fe9464b2698dfdaba0c1b33ac.png)
