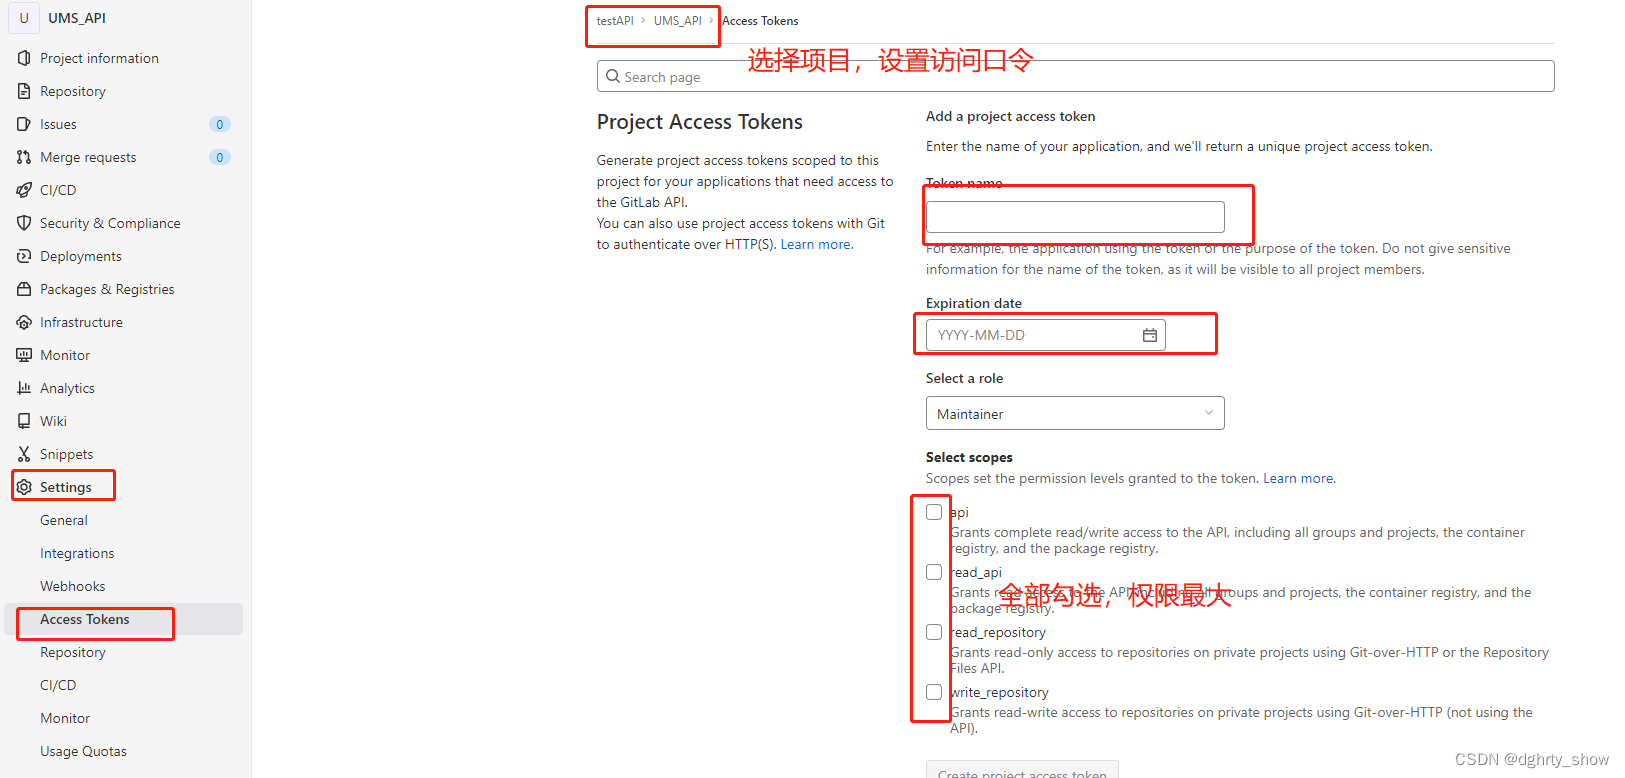
从CCLE下载数据得到基因在每个细胞系中的
现在从DepMap: The Cancer Dependency Map Project at Broad Institute
需要先选择Custom Downloads


就可以下载数据进行处理了:
rm(list = ls())
library(tidyverse)
library(ggpubr)
rt <- data.table::fread("TP53 log2(TPM+1) Expression Public 23Q4.csv",data.table = F)

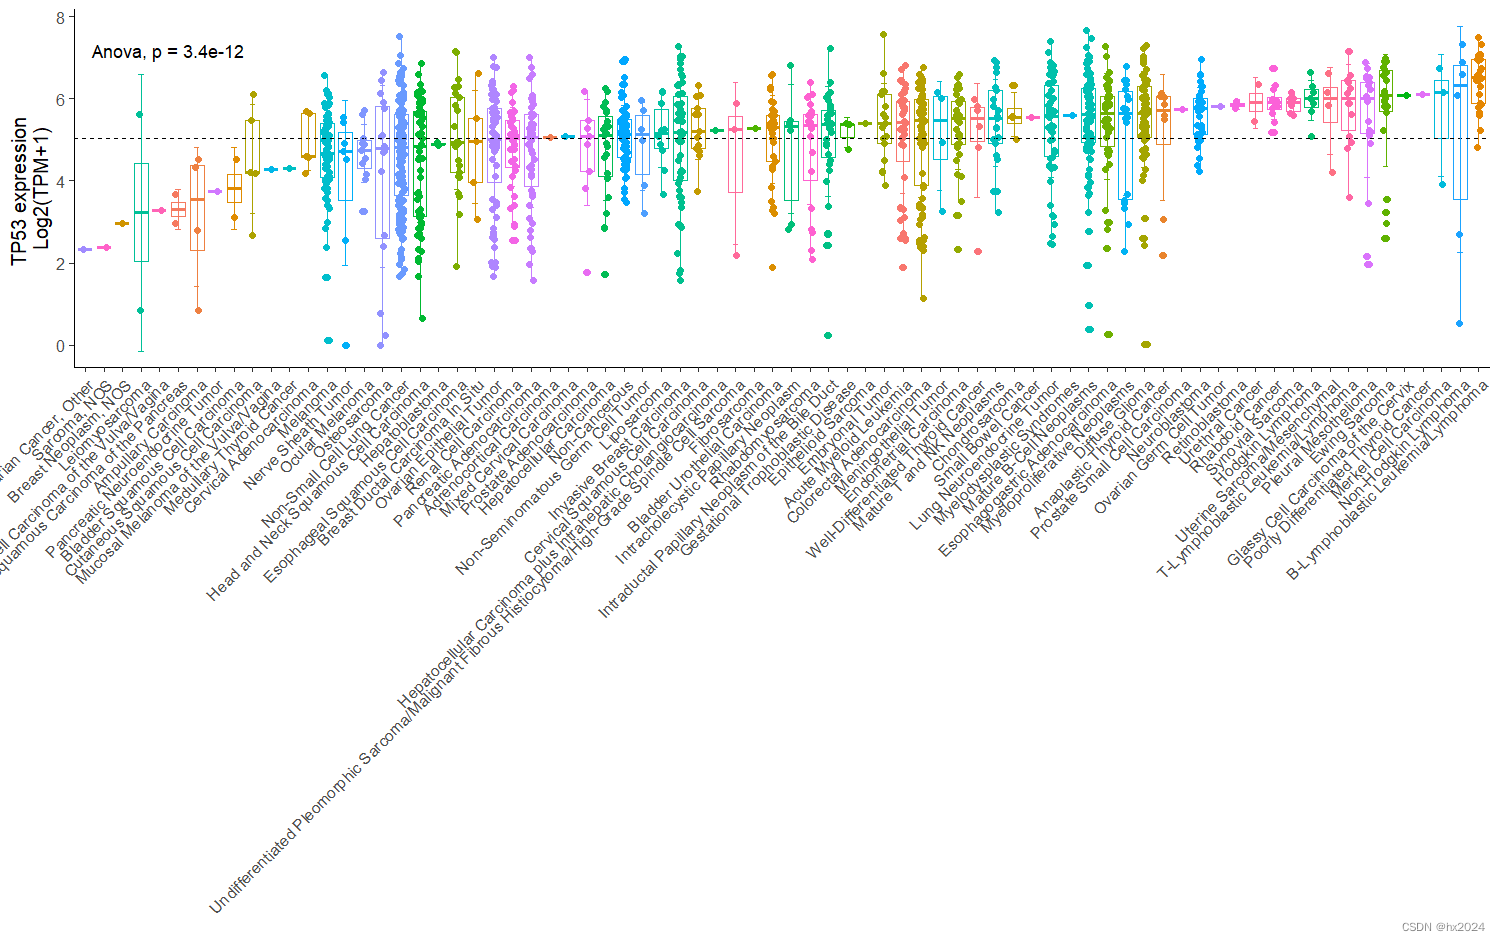
##泛癌绘制##
p1 <- ggplot(rt,aes(x=reorder(`Primary Disease`,
                              `TP53 log2(TPM+1) Expression Public 23Q4`,
                              FUN=median), #按中位数自动排序
                    y=`TP53 log2(TPM+1) Expression Public 23Q4`,
                    color=`Primary Disease`))+
  geom_boxplot()+
  geom_jitter(width = 0.15)+
  geom_hline(yintercept = mean(rt$`TP53 log2(TPM+1) Expression Public 23Q4`),lty=2)+
  theme_classic(base_size = 12)+
  rotate_x_text(45)+
  labs(x="",y="TP53 expression \nLog2(TPM+1)")+
  theme(legend.position = "none")+
  stat_summary(fun.data = "mean_sd",geom = "errorbar",width=0.3,position = position_dodge(0.9))+
  stat_compare_means(method = "anova",label.x = 3,label.y = 7)
p1
提取单个肿瘤:
##单个肿瘤##
dat1 <- rt[rt$`Primary Disease`=="Esophagogastric Adenocarcinoma",]
colnames(dat1)[2] <- "Expression Public"
p2 <- ggplot(dat1,aes(x=reorder(`Cell Line Name`,
                               `Expression Public`,FUN=median), #按中位数自动排序
                     y=`Expression Public`))+
  geom_segment(aes(y=mean(`Expression Public`),
                   xend=`Cell Line Name`,
                   yend=`Expression Public`))+
  geom_point(aes(size=`Expression Public`,
                 color=`Expression Public`))+
  geom_hline(yintercept = mean(dat1$`Expression Public`),lty=2)+
  theme_bw(base_size = 12)+
  labs(x="",y="ALKBH5 expression",
       color="ALKBH5 expression",
       size="ALKBH5 expression")+
  scale_color_viridis_c(alpha = 1,begin = 0.6,end=0.9,direction = -1)+
  coord_flip()
p2

