简介
ABoVE: AirSWOT Water Masks from Color-Infrared Imagery over Alaska and Canada, 2017
摘要 本数据集提供了:1)用于未来从共存的 AirSWOT Ka 波段干涉测量数据中提取水面高程 (WSE) 的保守开放水域掩膜;2)沿 NASA 北极-北方脆弱性实验 (ABoVE) 基本飞行线路大于 40 平方米的高分辨率(1 米)水体分布图。 掩膜和地图由飞行期间收集的单个图像生成的地理参照三波段正射影像图和基于归一化差异水指数(NDWI)的半自动水体分类算法得出。 利用人工选择的地面控制点(GCPs)对图像瓦片进行了地理坐标参考。与人工数字化的开放水域边界进行比较,开放水域分类的总体准确率为 98.0%。使用安装在 B200 飞机上的 Cirrus Designs 数字摄像系统 (DCS),从大约 8-11 千米的高度在以下区域收集绿色、红色和近红外 (NIR) 数字图像: 萨斯喀彻温河、萨斯卡通、伊努维克、育空河(包括育空平原)、萨加瓦尼尔克托克河、北极沿海平原、老鸦平原、和平-阿萨巴斯卡三角洲、奴隶河、阿萨巴斯卡河、耶洛奈夫、大奴湖、麦肯齐河和三角洲、达林湖以及其他选定地点。 在加拿大和阿拉斯加的两次飞行活动中,对大多数地点进行了两次成像,大致为东南-西北和西北-东南方向,相隔时间长达一个月。以三种数据文件格式提供了 330 个 ABoVE 网格单元(ChxxCvxx)的水体掩蔽图:1 米分辨率 GeoTIFF(+.tif)文件、转换为 Shapefiles(.shp)文件和转换为谷歌地球格式(.kml)文件。 原始正射影像的特征(覆盖范围、质量和云标志、地理参照数据)和图像处理元数据分别以逗号分隔(.csv)文件、转换为 Shapefile(.shp)文件和转换为 Google Earth 格式(.kml)文件的形式提供。
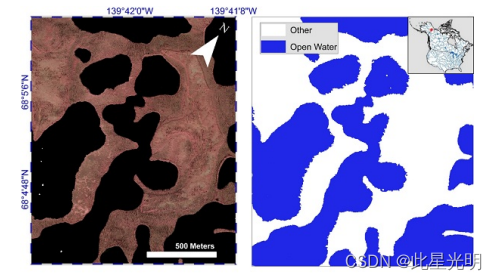
该数据集提供了一个保守的开放水域掩模,用于未来从共存的 AirSWOT Ka 波段干涉测量数据中提取水面高程(WSE),并提供了沿 NASA 北极-北方脆弱度实验(ABoVE)基础飞行线路大于 40 平方米的高分辨率(1 米)水体分布图。 掩膜和地图由飞行期间收集的单个图像生成的地理参照三波段正射影像图和基于归一化差异水指数(NDWI)的半自动水体分类算法得出。 利用人工选择的地面控制点(GCPs)对图像瓦片进行了地理坐标参考。与人工数字化的开放水域边界进行比较,开放水域分类的总体准确率为 98.0%。绿色、红色和近红外(NIR)数字图像由安装在 B200 飞机上的 Cirrus Designs Digital Camera System (DCS) 从大约 8-11 千米的高度在以下区域收集:萨斯喀彻温河、萨斯卡通、伊努维克、育空河(包括育空平原)、萨加瓦尼尔克托克河、北极沿岸平原、老鸦平原、和平-阿萨巴斯卡三角洲、奴隶河、阿萨巴斯卡河、黄刀、大奴湖、大湖。在加拿大和阿拉斯加的两次飞行活动中,大多数地点都拍摄了两次图像,大致为东南-西北和西北-东南方向,间隔时间长达一个月。项目:北极-北方脆弱性实验 北极-北方脆弱性实验(ABoVE)是美国国家航空航天局(NASA)陆地生态计划的一项实地活动,于 2016 年至 2021 年期间在阿拉斯加和加拿大西部进行。ABoVE 的研究将基于实地的过程级研究与机载和卫星传感器获得的地理空间数据产品联系起来,为提高分析和建模能力奠定了基础,而分析和建模能力是理解和预测生态系统响应及社会影响所必需的。

数据特征
空间覆盖范围:阿拉斯加和加拿大
上方参考位置:
域:核心 ABoVE
州/地区: 阿拉斯加和加拿大阿拉斯加和加拿大
空间分辨率:数据以 1m x 1m 像素大小提供。
时间覆盖范围:2017-07-09 至 2017-08-17
时间分辨率:每个地点一至三个集合。
研究区域(所有经纬度均以十进制度表示)
| Site | Westernmost Longitude | Easternmost Longitude | Northernmost Latitude | Southernmost Latitude |
|---|---|---|---|---|
| Alaska and Canada | -149.254166 | -98.64386 | 69.474444 | 46.854333 |
数据信息
该数据集有 330 个 GeoTIFF (.tif) 格式的数据文件、4 个 shapefiles (.shp) 文件(以 .zip 文件夹提供)和 1 个逗号分隔文件(.csv)。另外还有 333 个 .kmz 格式的配套文件。
| File names | Descriptions |
|---|---|
| DCS_YYYYMMDD_S##*_ChZZZvZZZ_V#.tif | Orthomosaics (330 files) collected between July 9 and August 17, 2017 in GeoTIFF format (.tif) and clipped to the ABoVE “c-level” grid. |
| DCS_Index.zip | Polygon shapefile that shows the areas of all the orthomosaics. |
| ground_control_points_map.zip | The ground control points (GCPs) used to georeference the orthomosaics, manually digitized from the proprietary Digital Globe EV-WHS image service. The coordinates for the points are found under attributes mapX and mapY. |
| ground_control_points_source.zip | The ground control points (GCPs) as they appeared in the original raster files. The coordinates for the points are found under attributes sourceX and sourceY. |
| ground_control_points_source_transformed.zip | The ground control points (GCPs) after warping transformation. The coordinates for the points are found under attributes Source_tX and Source_tY. |
| ground_control_points.csv | This file is provided for easy georeferencing of the orthomosaics and provides the same data as the shapefiles, however, the variable names (column names) are provided in a longer format. The file provides the ground control points (GCPs), manually digitized from the proprietary Digital Globe EV-WHS image service. The coordinates for the points are found under attributes longitude_map and latitude_map. |
| Companion files | |
| DCS_YYYYMMDD_S##*_ChZZZvZZZ_V#.kmz | The 330 orthomosaic files are provided in .kmz format for viewing in Google Earth. There is one *.kmz file for each *.tif file. |
| ground_control_points_map.kmz ground_control_points_source.kmz ground_control_points_source_transformed.kmz | Three of the shapefiles are provided in .kmz format for viewing in Google Earth. |
矢量信息Shapefiles (.shp)
| Attribute | Description |
|---|---|
| AboveGrid | ABoVE Grid tile, based on convention |
| OrigRaster | Original raster file name before being clipped to ABoVE grid. All rasters sharing a common “OrigRaster” value were warped to the same affine transformation |
| Date | Image acquisition date |
| GCP_Count | Total number of GCPs contained within raster boundaries. A value of zero indicates either there is no GCP-based warp applied to the raster, or the warp didn’t use any GCPs ontained within the raster boundaries. This column sums to the number of GCPs used for the entire dataset (303) |
| Total_GCP | Total number of GCPs used to warp the original raster file. This number will always be greater than or equal to GCP_count. A value of zero indicates there is no GCP-based warp applied to the raster and the accuracy can be assumed to be less than 5m |
| Avg_diff | Average difference in meters between the GCPs in the final raster file (transformed source coordinate, as found in the GCP shapefiles) and their corresponding “actual” coordinate given in the DigitalGlobe image service. A value of -9999 indicates that there are no GCPs contained within the raster bounds |
| Min_diff | Minimum difference for the above |
| Max_diff | Maximum difference for the above |
方法
这些数据旨在验证地表水范围,以帮助解释 AirSWOT ABoVE 项目中的 AirSWOT Ka 波段雷达回波。AirSWOT 的核心是 Ka 波段 SWOT 现象机载雷达 (KaSPAR)。该雷达收集两段跨轨道干涉测量数据--分别在天底至 1 千米之间和 1 千米至 5 千米之间--可用于获取厘米级的水面地形图。此外,KaSPAR 还有一个沿轨干涉仪,可用于测量水面的时间相关性以及水的径向速度。
数据处理过程
正射影像图由 DCS 采集的单个图像生成(见图 1 示例)。数据使用从 Digital Globe EV-WHS 网络地图服务器手动数字化的 303 个地面控制点 (GCP) 进行地理参照。在 ArcMap 10.6 中,使用一阶多项式(仿射)变换以及源和地图 GCP 之间的平均值和均方根平均值对图像进行了扭曲处理。在加拿大和阿拉斯加的两次飞行活动中,对大多数地点进行了两次成像,大致从东南-西北延伸到西北-东南。
正射影像图被重新投影到 NAD 1983 加拿大阿尔伯斯等面积圆锥曲线上,并重新采样为 1m x 1m 像素大小。文件被剪切为 ABoVE 标准参考网格 C(Loboda 等人,2017 年)。栅格产品已进行地理坐标标定和正射校准,但未进行辐射校准。
地理参照和精度评估
这些正射影像图是通过 Agisoft Photoscan 软件,利用飞机上的定位数据(IMU 和 GPS)制作的。 最初的产品在不同日期拍摄的相同地面点之间存在 0-120 米的地理定位偏移。 造成这种高不确定性的原因包括:线性飞行路径造成的侧边图像重叠较少或根本不存在、定位数据的不确定性、云层的影响以及所使用的相机系统老化。 通过这种方法获得的初始地理定位精度对位置上的微小误差非常敏感,不足以与同时拍摄的 AirSWOT 雷达图像进行比较。
为了解决这个问题,我们使用从专有的 Digital Globe EV-WHS 图像服务中手动数字化的 303 个地面控制点(GCP),对原始 38 幅正交合成图中的 29 幅进行了地理参照。 该服务提供空间分辨率在 1 米或更高数量级的正射影像(EnhancedView Web Hosting Service,2018 年)。 作为该服务输入的四颗运行中的数字地球卫星(Satellite Information, 2018)的第 90 百分位数地理定位误差范围为 3.0 米(GeoEye-1)至 6.5 米(Worldview-1)。 GCP 被选为可在正射影像和数字地球图像服务中识别的持久地貌特征。 这些地物包括道路交叉口,以及在基本无人居住的研究区域内的树丛边界。 在 ArcMap 10.6 中使用一阶多项式(仿射)变换对图像进行扭曲处理,并计算源点和地图 GCP 之间的平均距离和均方根平均距离。 如果这些数字相差超过 20%,则将相应图像手动分割成两个或多个部分,并使用相应的 GCP 子集重新应用翘曲。 这些操作是使用与 DigitalGlobe 服务相同的地理坐标系统(WGS-84)对原始正射影像进行的。 然后,将正射影像图投影并分割到 ABoVE 网格中,形成本档案中的 330 个文件。 如果正射影像图与 DigitalGlobe 图像的偏差始终小于 5 米,则假定该正射影像图尽可能精确,不应用基于 GCP 的翘曲处理。
地理坐标参照后,进行了统计计算。 90% 的 GCP 与 DigitalGlobe 的偏差在 13.28 米(13.28 像素)或以下。 与 DigitalGlobe 偏移的其他统计数据包括:最小值:0.30 米,最大值:49.76 米,平均值:0.30 米:49.76米,平均值5.97米,标准偏差5.70m. 鉴于至少 90% 的 DigitalGlobe 图像服务的地理定位误差在 6.5m 或以下[3],我们产品的水平精度在 90% 的人工地理坐标正射影像中最多为 19.8m,个别精度可作为 shapefile 属性提供。
代码
!pip install leafmap
!pip install pandas
!pip install folium
!pip install matplotlib
!pip install mapclassify

import pandas as pd
import leafmap

url = "https://github.com/opengeos/NASA-Earth-Data/raw/main/nasa_earth_data.tsv"
df = pd.read_csv(url, sep="\t")
df

leafmap.nasa_data_login()


results, gdf = leafmap.nasa_data_search(
    short_name="ABoVE_Airborne_AVIRIS_NG_V2_2009B",
    cloud_hosted=True,
    bounding_box=(-166.65, 52.16, -103.24, 71.38),
    temporal=("2017-06-24", "2019-08-04"),
    count=-1,  # use -1 to return all datasets
    return_gdf=True,
)

# Granules found: 250

gdf.explore()

#leafmap.nasa_data_download(results[:5], out_dir="data")
引用
Kyzivat, E.D., L.C. Smith, L.H. Pitcher, J. Arvesen, T.M. Pavelsky, S.W. Cooley, and S. Topp. 2018. ABoVE: AirSWOT Color-Infrared Imagery Over Alaska and Canada, 2017. ORNL DAAC, Oak Ridge, Tennessee, USA. ABoVE: AirSWOT Color-Infrared Imagery Over Alaska and Canada, 2017, https://doi.org/10.3334/ORNLDAAC/1643
数据下载地址
ABoVE: AirSWOT Color-Infrared Imagery Over Alaska and Canada, 2017
网址推荐
0代码在线构建地图应用
https://sso.mapmost.com/#/login?source_inviter=nClSZANO
机器学习
https://www.cbedai.net/xg
