快速搭建一个一元二次方程flask应用

news2025/1/16 11:33:28

新建flask_service目录、templates子目录

flask_service
—— app.py
—— templates
—— —— index.html

app.py

from flask import Flask, request, jsonify, render_template
import random
import matplotlib.pyplot as plt
from io import BytesIO
import base64

app = Flask(__name__)

def generate_points(a, b, c, start_x, start_y, end_x, end_y, error_range_x, error_range_y, num_points):
    points = []
    step = 0.1  # 步长,可以根据需要调整
    count = 0

    while count < num_points:
        x = random.uniform(start_x, end_x)
        y_actual = a * x**2 + b * x + c

        # 在实际值附近加入一定的误差
        x_generated = x + random.uniform(-error_range_x, error_range_x)
        y_generated = y_actual + random.uniform(-error_range_y, error_range_y)

        # 确保生成的点在范围内
        if start_x <= x_generated <= end_x and start_y <= y_generated <= end_y:
            points.append((x_generated, y_generated))
            count += 1

    return points

@app.route('/', methods=['GET', 'POST'])
def index():
    if request.method == 'POST':
        a = float(request.form['a'])
        b = float(request.form['b'])
        c = float(request.form['c'])
        start_x = float(request.form['start_x'])
        start_y = float(request.form['start_y'])
        end_x = float(request.form['end_x'])
        end_y = float(request.form['end_y'])
        error_range_x = float(request.form['error_range_x'])
        error_range_y = float(request.form['error_range_y'])
        num_points = int(request.form['num_points'])

        points = generate_points(a, b, c, start_x, start_y, end_x, end_y, error_range_x, error_range_y, num_points)

        x_values = [point[0] for point in points]
        y_values = [point[1] for point in points]

        plt.figure(figsize=(8, 6))
        plt.scatter(x_values, y_values, color='blue')
        plt.xlabel('X')
        plt.ylabel('Y')
        plt.title('Scatter Plot of Generated Points')
        plt.axhline(0, color='black', linewidth=0.5)
        plt.axvline(0, color='black', linewidth=0.5)
        plt.grid(True)
        plt.legend()

        # Convert plot to base64 string
        img_data = BytesIO()
        plt.savefig(img_data, format='png')
        img_data.seek(0)
        img_base64 = base64.b64encode(img_data.getvalue()).decode()
        plt.close()

        # 准备要传递给模板的数据
        info = {
            'img_base64': img_base64,
            'points': points,
	    'a': a,
            'b': b,
            'c': c,
            'start_x': start_x,
            'start_y': start_y,
            'end_x': end_x,
            'end_y': end_y,
            'error_range_x': error_range_x,
            'error_range_y': error_range_y,
            'num_points': num_points
        }
		# 按照 x 轴从小到大排序
    	points.sort(key=lambda point: point[0])
        return render_template('index.html', info=info, points=points)

    return render_template('index.html')

if __name__ == '__main__':
    app.run(host='0.0.0.0', port=5000, debug=True)

index.html

<!DOCTYPE html>
<html>
<head>
    <title>Generate Points</title>
    <style>
        .container {
            display: flex;
            flex-direction: row;
            align-items: flex-start;
            justify-content: space-between;
        }
        .form-container {
            width: 50%;
            margin-right: 20px;
        }
        .image-container {
            width: 50%; /* 调整图形容器宽度 */
            margin: 0 auto; /* 居中显示图形容器 */
        }        
        img {
            max-width: 100%;
            height: auto;
        }
    </style>
</head>
<body>
    <h1>Generate Points</h1>
    <div class="container">
        <div class="form-container">
            <form method="POST">
                <label for="a">二次项系数 a:</label>
                <input type="text" id="a" name="a" value="0"><br><br>

                <label for="b">一次项系数 b:</label>
                <input type="text" id="b" name="b" value="-2"><br><br>

                <label for="c">常数项系数 c:</label>
                <input type="text" id="c" name="c" value="1"><br><br>

                <label for="start_x">起始 x:</label>
                <input type="text" id="start_x" name="start_x" value="-5"><br><br>

                <label for="start_y">起始 y:</label>
                <input type="text" id="start_y" name="start_y" value="-5"><br><br>

                <label for="end_x">结束 x:</label>
                <input type="text" id="end_x" name="end_x" value="5"><br><br>

                <label for="end_y">结束 y:</label>
                <input type="text" id="end_y" name="end_y" value="5"><br><br>

                <label for="error_range_x">x轴方向的误差范围:</label>
                <input type="text" id="error_range_x" name="error_range_x" step="0.1" value="0.2"><br><br>

                <label for="error_range_y">y轴方向的误差范围:</label>
                <input type="text" id="error_range_y" name="error_range_y" step="0.1" value="0.5"><br><br>

                <label for="num_points">生成的点的个数:</label>
                <input type="text" id="num_points" name="num_points" value="50"><br><br>

                <input type="submit" value="生成图形">
            </form>
            {% if info %}
            <h2>图片信息:</h2>
            <p>二次项系数 a: {{ info['a'] }}</p>
            <p>一次项系数 b: {{ info['b'] }}</p>
            <p>常数项系数 c: {{ info['c'] }}</p>
            <p>起始 x: {{ info['start_x'] }}</p>
            <p>起始 y: {{ info['start_y'] }}</p>
            <p>结束 x: {{ info['end_x'] }}</p>
            <p>结束 y: {{ info['end_y'] }}</p>
            <p>x轴方向的误差范围: {{ info['error_range_x'] }}</p>
            <p>y轴方向的误差范围: {{ info['error_range_y'] }}</p>
            <p>生成的点的个数: {{ info['num_points'] }}</p>
            <h2>点的坐标:</h2>
            <ul>
                {% for point in points %}
                <li>{{ point[0] }}, {{ point[1] }}</li>
                {% endfor %}
            </ul>
            {% endif %}
        </div>
        <div class="image-container">
            {% if info %}
            <img src="data:image/png;base64,{{ info['img_base64'] }}" alt="Generated Plot">
            {% endif %}
        </div>
    </div>
</body>
</html>

nohup 后台启动

[root@hecs-334217 flask_service]# nohup python3 app.py  > app.log 2>&1 &
[3] 7178

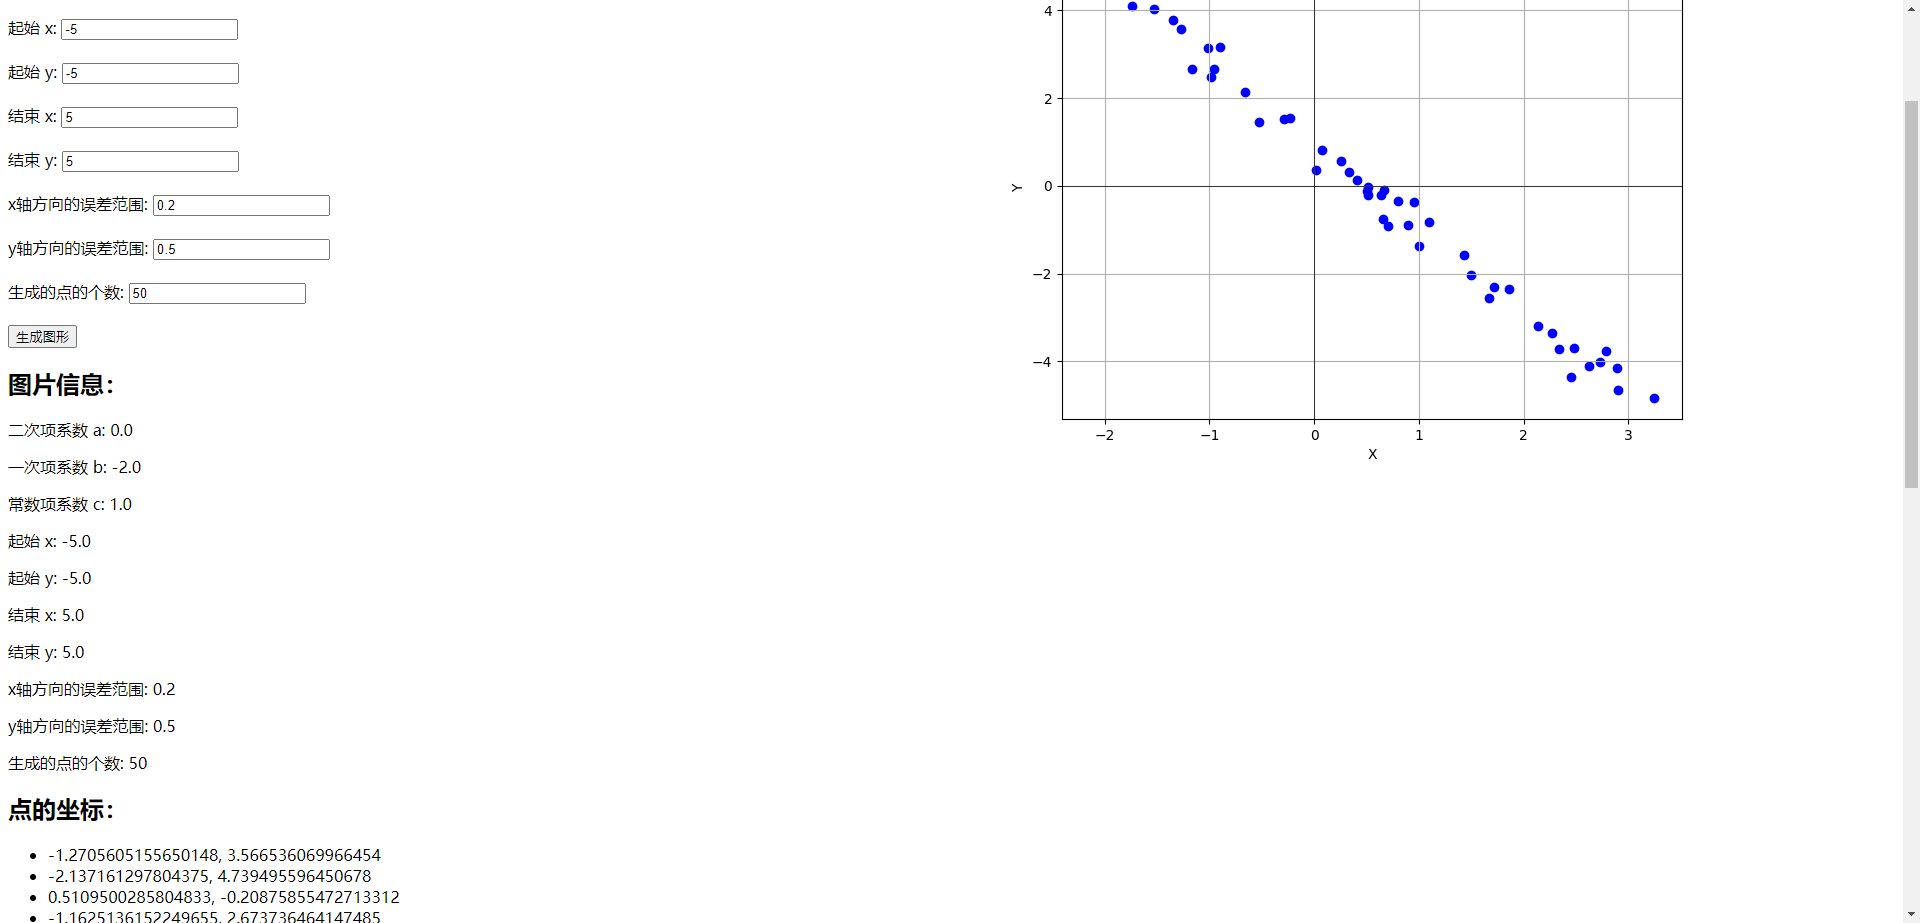
页面效果

在这里插入图片描述
点击生成图形
在这里插入图片描述

本文来自互联网用户投稿,该文观点仅代表作者本人,不代表本站立场。本站仅提供信息存储空间服务,不拥有所有权,不承担相关法律责任。如若转载,请注明出处:http://www.coloradmin.cn/o/1530455.html

如若内容造成侵权/违法违规/事实不符,请联系多彩编程网进行投诉反馈,一经查实,立即删除!

相关文章

Java项目基于SpringBoot和Vue的时装购物系统的设计与实现

今天要和大家聊的是一款基于SpringBoot和Vue的时装购物系统。 &#x1f495;&#x1f495;作者&#xff1a;李同学 &#x1f495;&#x1f495;个人简介&#xff1a;混迹在java圈十年有余&#xff0c;擅长Java、微信小程序、Python、Android等&#xff0c;大家有这一块的问题可…

综合练习(python)

前言 有了前面的知识积累&#xff0c;我们这里做两个小练习&#xff0c;都要灵活运用前面的知识。 First 需求 根据美国/英国各自YouTube的数据&#xff0c;绘制出各自的评论数量的直方图 第一版 import numpy as np from matplotlib import pyplot as plt import matplo…

Android TransactionTooLargeException排查定位

Android TransactionTooLargeException排查定位 工具&#xff1a; https://github.com/guardian/toolargetoolhttps://github.com/guardian/toolargetool android TransactionTooLargeException问题的修复&#xff0c;一种简单的修复就是在Fragment的onCreate里面&#xff0…

【Ubuntu】常用命令

一般操作 pwd&#xff08;present working directory&#xff09; 显示当前的工作目录/路径。 cd (change directory) 改变目录&#xff0c;用于输入需要前往的路径/目录。 有一些特殊命令也很常用 : 解释 前往同一级的另一个目录 cd ../directory name cd .. 表示进入上…

(一)基于IDEA的JAVA基础2

通过记事本练习我们可以大致了解java的运行过程 使用工具开发: 常用工具:Eclipse, MyEclipse,IDEA 这里我们用的开发工具是IDEA&#xff0c;其下载和破解方式在我们这个平台上一搜就有&#xff0c;这个我就不多言了&#xff0c;其他老师都比我有权威性&#xff0c;因为我当初…

软考 系统架构设计师系列知识点之系统性能(1)

所属章节&#xff1a; 第2章. 计算机系统基础知识 第9节. 系统性能 系统性能是一个系统提供给用户的所有性能指标的集合。它既包括硬件性能&#xff08;如处理器主频、存储器容量、通信带宽等&#xff09;和软件性能&#xff08;如上下文切换、延迟、执行时间等&#xff09;&a…

Covalent Network借助大规模的历史Web3数据集,推动人工智能发展

人工智能在众多领域中增强了区块链的实用性&#xff0c;反之亦然&#xff0c;区块链确保了 AI 模型所使用的数据的来源和质量。人工智能带来的生产力提升&#xff0c;将与区块链系统固有的安全性和透明度融合。 Covalent Network&#xff08;CQT&#xff09;正位于这两项互补技…

Linux环境变量【终】

&#x1f30e;环境变量 文章目录&#xff1a; 环境变量 环境变量的组织方式 创建自己的环境变量       main函数参数       C语言提供的变量与接口 环境变量与本地变量 了解本地变量       取消本地变量和环境变量 环境变量的出处 总结 前言&#xff1a; 上…

【RK3399 -PCIE移植过程记录】

一、&#xff0c;pcie开发可通过参考官方开发文档&#xff1a; 具体的硬件外设都有官网的参考文档&#xff0c;pcie的具体可参考&#xff1a; https://github.com/mfkiwl/rk-open-docs/blob/master/PCIe/Rockchip_RK3399_Developer_Guide_PCIe_CN.md 二、具体设备树文件 vi …

时序预测 | Matlab基于BiTCN-LSTM双向时间卷积长短期记忆神经网络时间序列预测

时序预测 | Matlab基于BiTCN-LSTM双向时间卷积长短期记忆神经网络时间序列预测 目录 时序预测 | Matlab基于BiTCN-LSTM双向时间卷积长短期记忆神经网络时间序列预测预测效果基本介绍程序设计参考资料 预测效果 基本介绍 1.Matlab基于BiTCN-LSTM双向时间卷积长短期记忆神经网络时…

数据在内存中的存储(C语言)(难点,需多刷几遍)

目录 整数在内存中的存储 大小端字节序和字节序判断 什么是大小端&#xff1f; 为什么有大小端&#xff1f; 练习1 练习2 练习3 练习4 练习5 练习6&#xff08;较难、重点&#xff09; 代码解读&#xff1a; 浮点数在内存中的存储 练习 浮点数的存储 浮点数存的…

Redis之缓存穿透、缓存雪崩、缓存击穿

Redis之缓存穿透、缓存雪崩、缓存击穿 什么是缓存穿透&#xff1f; 如果有人故意将请求打到未缓存的数据上&#xff0c;会对数据库造成巨大的压力 如何解决&#xff1f; 做好参数校验&#xff0c;比如请求的id不能<0&#xff0c;在访问数据库前就把这些异常访问拦截了 缓…

nginx搭建及部署

目录 一、nginx是什么&#xff1f; 二、安装部署 1.下载 2.配置 3.代理Swagger服务 4.nginx命令 一、nginx是什么&#xff1f; 是用于 Web 服务、反向代理、内容缓存、负载均衡、媒体流传输等场景的开源软件。它最初是一款专为实现最高性能和稳定性而设计的 Web 服务器。…

使用 CSS 实现毛玻璃效果

在现代 Web 设计中,毛玻璃效果越来越受欢迎。它能够让界面元素看起来更加柔和、朦胧,同时又不会完全遮挡背景内容,给人一种透明而又不失质感的视觉体验。虽然过去实现这种效果需要借助图像编辑软件,但现在只需要几行 CSS 代码,就可以在网页上呈现出令人惊艳的毛玻璃效果。 使用…

Data-Free Generalized Zero-Shot Learning 中文版

摘要 深度学习模型具有从大规模数据集中提取丰富知识的能力。然而&#xff0c;由于涉及到数据版权和隐私问题&#xff0c;数据共享变得越来越具有挑战性。因此&#xff0c;这妨碍了从现有数据向新的下游任务和概念有效转移知识。零样本学习&#xff08;ZSL&#xff09;方法旨在…

MNN Session 创建执行器(六)

系列文章目录 MNN createFromBuffer&#xff08;一&#xff09; MNN createRuntime&#xff08;二&#xff09; MNN createSession 之 Schedule&#xff08;三&#xff09; MNN createSession 之创建流水线后端&#xff08;四&#xff09; MNN Session::resize 之流水线编码&am…

element-ui出的treeselect下拉树组件基本使用,以及只能选择叶子节点的功能,给节点添加按钮操作

element-ui出的treeselect下拉树组件基本使用&#xff1a;Vue通用下拉树组件riophae/vue-treeselect的使用-CSDN博客 vue-treeselect 问题合集、好用的树形下拉组件&#xff08;vue-treeselect的使用、相关问题解决方案&#xff09;-CSDN博客 需求1&#xff1a;treeselect下拉…

数据结构和算法模块——队列(多例子+图文)

一文帮你看懂队列 什么是线性表为什么要学习线性表&#xff0c;它有什么用处和好处&#xff1f;基本概念分类存储结构结构特点 队列为什么要学习队列&#xff1f;基本概念数据结构基本操作 待填坑 什么是线性表 为什么要学习线性表&#xff0c;它有什么用处和好处&#xff1f;…

【测试开发学习流程】MySQL函数运算(中)(下)

前言&#xff1a; 这些天还要搞毕业论文&#xff0c;东西少了点&#xff0c;大家将就看看QWQ 目录 1 MySQL的数据处理函数 1.1 文本处理函数 1.2 日期与时间函数 1.3 数值处理函数 1.4 系统函数 2 聚集运算 2.1 聚集函数 2.2 流程函数 1 MySQL的数据处理函数 MySQL支…