目录
一、前言
二、实验
0. 导入包
1. 支持向量机带来的效果
2. 软硬间隔
3. 非线性支持向量机
4. 核函数变换
线性核
高斯核
对比不同的gamma值对结果的影响
一、前言
学习本文之前要具有SVM支持向量机的理论知识,可以参考支持向量机(Support Vector Machines)
本文对比了传统分类模型和SVM支持向量机分类模型,软硬间隔差别,非线性支持向量机,核技巧,高斯核函数的参数比较
二、实验
0. 导入包
#0 导入包
import numpy as np
import os
%matplotlib inline
import matplotlib
import matplotlib.pyplot as plt
plt.rcParams['axes.labelsize'] = 14
plt.rcParams['xtick.labelsize'] = 12
plt.rcParams['ytick.labelsize'] = 12
import warnings
warnings.filterwarnings('ignore')
1. 支持向量机带来的效果
from sklearn.svm import SVC
from sklearn.datasets import load_iris

iris = load_iris()
X = iris['data'][:,(2,3)]
y = iris['target']

setosa_or_versicolor = (y==0)|(y==1)   # 做个二分类
X = X[setosa_or_versicolor]
y = y[setosa_or_versicolor]

plt.plot(X[:,0][y==0],X[:,1][y==0],'bs')
plt.plot(X[:,0][y==1],X[:,1][y==1],'yo')

svm_clf = SVC(kernel='linear',C=10000)
svm_clf.fit(X,y)

随便画了几条直线
#一般模型
x0 = np.linspace(0,5.5,200)
pred_1 = 5 * x0 - 20
pred_2 = x0 - 1.8
pred_3 = 0.1 * x0 + 0.5
对比情况
#支持向量机
def plot_svc_decision_boundary(svm_clf,xmin,xmax,sv=True):
    #模型训练完后得到 W b
    w = svm_clf.coef_[0]
    b = svm_clf.intercept_[0]
    x0 = np.linspace(xmin,xmax,200)
    decision_boundary = -w[0]/w[1] *x0 - b/w[1]
    margin = 1/w[1]
    gutter_up = decision_boundary + margin
    gutter_down = decision_boundary - margin
    if sv:
        svs = svm_clf.support_vectors_
        plt.scatter(svs[:,0],svs[:,1],facecolors='#FFAAAA',s=180)
    plt.plot(x0,decision_boundary,'k-',linewidth=2)
    plt.plot(x0,gutter_up,'k--',linewidth=2)
    plt.plot(x0,gutter_down,'k--',linewidth=2)

plt.figure(figsize=(14,4))
plt.subplot(121)
plt.plot(x0,pred_1,'g--',linewidth=2)
plt.plot(x0,pred_2,'m-',linewidth=2)
plt.plot(x0,pred_3,'r-',linewidth=2)
plt.plot(X[:,0][y==0],X[:,1][y==0],'bs')
plt.plot(X[:,0][y==1],X[:,1][y==1],'yo')
plt.axis([0,5.5,0,2])

plt.subplot(122)
plot_svc_decision_boundary(svm_clf,0,5.5)
plt.plot(X[:,0][y==0],X[:,1][y==0],'bs')
plt.plot(X[:,0][y==1],X[:,1][y==1],'yo')
plt.axis([0,5.5,0,2]) 
可以看出相较于传统的分类模型,支持向量机可以把决策超平面求出来,力保决策面达到最佳。
2. 软硬间隔
硬间隔:不允许有分类误差,导致过拟合

软间隔: 允许有分类误差,降低过拟合风险

在sklearn中可以使用超参数C控制软间隔程度
#可以使用超参数C控制软间隔程度
import numpy  as np
from sklearn import datasets
from sklearn.pipeline import Pipeline
from sklearn.preprocessing import StandardScaler
from sklearn.svm import LinearSVC

iris = datasets.load_iris()
X = iris['data'][:,(2,3)]
y = (iris['target'] == 2).astype(np.float64)
svm_clf = Pipeline((
    ('std',StandardScaler()),
    ('LinearSVC',LinearSVC(C=1))
))
svm_clf.fit(X,y)
svm_clf.predict([[5,1.6]])
#对比不同的C值所带来的效果差异
scaler = StandardScaler()
svm_clf1 = LinearSVC(C=1,random_state=42)
svm_clf2 = LinearSVC(C=100,random_state=42)
scaled_svm_clf1 =Pipeline((
('std',scaler),
('LinearSVC',svm_clf1)
))
scaled_svm_clf2=Pipeline((
('std',scaler),
('LinearSVC',svm_clf2)
))
scaled_svm_clf1.fit(X,y)
scaled_svm_clf2.fit(X,y)#将标准化后的数据还原
b1 = svm_clf1.decision_function([-scaler.mean_ / scaler.scale_])
b2 = svm_clf2.decision_function([-scaler.mean_ / scaler.scale_])
w1 = svm_clf1.coef_[0] /scaler.scale_
w2 = svm_clf2.coef_[0] /scaler.scale_
svm_clf1.intercept_ = np.array([b1])
svm_clf2.intercept_ = np.array([b2])
svm_clf1.coef_ = np.array([w1])
svm_clf2.coef_ = np.array([w2])plt.figure(figsize=(14,5))
plt.subplot(121)
plt.plot(X[:,0][y==0],X[:,1][y==0],'bs',label='Iris-Virginica')
plt.plot(X[:,0][y==1],X[:,1][y==1],'yo',label='Iris-Versicolor')
plot_svc_decision_boundary(svm_clf1,4,6,sv=False)
plt.xlabel('Petal length',fontsize=14)
plt.ylabel('Petal width',fontsize=14)
plt.legend(loc='upper center',fontsize=14)
plt.title('$C= {}$'.format(svm_clf1.C),fontsize=16)
plt.axis([4,6,0.8,2.8])
plt.subplot(122)
plt.plot(X[:,0][y==0],X[:,1][y==0],'bs')
plt.plot(X[:,0][y==1],X[:,1][y==1],'yo')
plot_svc_decision_boundary(svm_clf2,4,6,sv=False)
plt.xlabel('Petal length',fontsize=14)
plt.title('$C= {}$'.format(svm_clf2.C),fontsize=16)
plt.axis([4,6,0.8,2.8])
在右侧,使用较高的的C值,分类器会减少误分类,但是最终会有较小间隔
在左侧,使用较低的的C值,间隔要大得多,但是很多实例最终会出现在间隔之内
3. 非线性支持向量机
#创建一份有点难度的数据集
from sklearn.datasets import make_moons
X,y = make_moons(n_samples=100,noise=0.15,random_state=42)
def plot_dataset(X,y,axes):
    plt.plot(X[:,0][y==0],X[:,1][y==0],'bs')
    plt.plot(X[:,0][y==1],X[:,1][y==1],'g^')
    plt.axis(axes)
    plt.grid(True,which='both')
    plt.xlabel(r'$x_1$',fontsize=20)
    plt.ylabel(r'$x_2$',fontsize=20,rotation=0)
plot_dataset(X,y,[-1.5,2.5,-1,1.5])
plt.show()
from sklearn.pipeline import Pipeline
from sklearn.preprocessing import PolynomialFeatures
Polynomial_svm_clf = Pipeline((
    ('poly-features',PolynomialFeatures(degree=3)), #变换数据
    ('scaler',StandardScaler()),
    ('svm_clf',LinearSVC(C=10,loss='hinge')) # 用线性SVC
))
Polynomial_svm_clf.fit(X,y)
def plot_predictions(clf,axes):
x0s = np.linspace(axes[0],axes[1],100)
x1s = np.linspace(axes[2],axes[3],100)
x0,x1 = np.meshgrid(x0s,x1s)
X_new = np.c_[x0.ravel(),x1.ravel()]
y_pred = clf.predict(X_new).reshape(x0.shape)
print(y_pred)
plt.contourf(x0,x1,y_pred,cmap=plt.cm.brg,alpha = 0.2)
plot_predictions(Polynomial_svm_clf,[-1.5,2.5,-1,1.5])
plot_dataset(X,y,[-1.5,2.5,-1,1.5])
4. 核函数变换
SVM的牛逼之处
线性核
from sklearn.svm import SVC

poly_kernel_svm_clf = Pipeline([
    ('scaler',StandardScaler()),
    ('svm_clf',SVC(kernel='poly',degree=3,coef0=1,C=5))
])
poly_kernel_svm_clf.fit(X,y)
poly100_kernel_svm_clf = Pipeline([
('scaler',StandardScaler()),
('svm_clf',SVC(kernel='poly',degree=10,coef0=100,C=5))
])
poly100_kernel_svm_clf.fit(X,y)plt.figure(figsize=(10,4))
plt.subplot(121)
plot_predictions(poly_kernel_svm_clf,[-1.5,2.5,-1,1.5])
plt.axis([-1.5,2.5,-1,1.5])
plt.xlabel('$X_1$',fontsize = 14)
plt.ylabel('$X_2$',fontsize = 14)
plot_dataset(X,y,[-1.5,2.5,-1,1.5])
plt.title(r'$kernel=poly,degree=3,coef0=1,C=5$',fontsize=12)
plt.subplot(122)
plot_predictions(poly100_kernel_svm_clf,[-1.5,2.5,-1,1.5])
plt.axis([-1.5,2.5,-1,1.5])
plt.xlabel('$X_1$',fontsize = 14)
plt.ylabel('$X_2$',fontsize = 14)
plot_dataset(X,y,[-1.5,2.5,-1,1.5])
plt.title(r'$kernel=poly,degree=100,coef0=10,C=5$',fontsize=12)
plt.show() 
高斯核
利用相似度来变换特征(升维技巧)
高斯核函数:

选择一份一维数据,并在x1 = -2 , x1 = 1 处添加两个高斯函数,将相似度函数定义为的径向基函数(RBF)
例如:X1=-1:它位于距第一个地标距离为1的地方,距第二个地标
地标距离为2的地方,因此新特征是
,并且
,成功把一维升为二维。
如果把每个样本当作地标,最多生成和样本数量一样多的维度
这里手写了高斯核函数
#高斯核函数
def guassian_rbf(x, landmark, gamma):
    return np.exp(-gamma * np.linalg.norm(x - landmark,axis = 1) ** 2)


gamma = 0.3 #假设

#创造数据
x1s = np.linspace(-4.5,4.5,100).reshape(-1,1) #还未变换得一维数据
y1 = np.random.randint(1,size=(25,1)) #前25个是0
y2 = np.random.randint(1,2,size=(50,1)) #中间50个是1
y3 = np.random.randint(1,size=(25,1)) #后25个是0
y = np.vstack((y1,y2))
y = np.vstack((y,y3)).reshape(1,-1)

#训练
x2s = guassian_rbf(x1s,-2,gamma) #以-2为地标
x3s = guassian_rbf(x1s,1,gamma) #以1为地标
x2 = x2s.reshape(-1,1)
x3 = x3s.reshape(-1,1)
X_train = np.hstack((x2,x3))
svm_clf = LinearSVC(C=100).fit(X_train,y[0])
x_1_max = np.max(x2s)
x_1_min = np.min(x2s)
x_2_max = np.max(x3s)
x_2_min = np.min(x3s)

#棋盘
def plot_guassian_decision_boundary(svm_clf,axes=[x_1_min,x_1_max,x_2_min,x_2_max]):
    x11s = np.linspace(axes[0],axes[1],100)
    x22s = np.linspace(axes[2],axes[3],100)
    x0,x1 = np.meshgrid(x11s,x22s)
    X_new = np.c_[x0.ravel(),x1.ravel()]
    y_pred = svm_clf.predict(X_new).reshape(x0.shape)
    plt.plot(X_train[:,0][y[0]==0],X_train[:,1][y[0]==0],'bs')
    plt.plot(X_train[:,0][y[0]==1],X_train[:,1][y[0]==1],'g^')
    plt.contourf(x0,x1,y_pred,cmap=plt.cm.brg,alpha = 0.2)
    plt.axis([x_1_min-0.01,x_1_max+0.01,x_2_min-0.01,x_2_max+0.01])


plt.figure(figsize=(14,6))
plt.subplot(121)
plt.plot(x1s[:,0][y[0]==0],np.zeros(sum(y[0]==0)),'bs')
plt.plot(x1s[:,0][y[0]==1],np.zeros(sum(y[0]==1)),'g^')
plt.axis([-4.5,4.5,-1,1])
plt.title("original one dimension data")
plt.xlabel(r'$X_0$')
plt.grid(True,which='both')
plt.subplot(122)
plot_guassian_decision_boundary(svm_clf)
plt.title("GF turn to two dimension data")
plt.xlabel(r'$X_1$')
plt.ylabel(r'$X_2$',rotation=0) 
我们可以看到,在左侧的数据无法用线性切分,可以通过升维的方法,到右侧划分。
对比不同的gamma值对结果的影响
#对比不同的gamma值对结果的影响
from sklearn.svm import SVC
from sklearn.datasets import make_moons
X,y = make_moons(n_samples=100,noise=0.15,random_state=42)

gamma1 , gamma2 = 0.1 ,5
C1,C2 = 0.001,1000
hyperparams = ((gamma1,C1),(gamma1,C2),(gamma2,C1),(gamma2,C2))

svm_clfs = []
for gamma,C in  hyperparams:
    rbf_kernel_svm_clf = Pipeline([
        ('scaler',StandardScaler()),
        ('svm_clf',SVC(kernel='rbf',gamma=gamma,C=C))
    ])
    rbf_kernel_svm_clf.fit(X,y)
    svm_clfs.append(rbf_kernel_svm_clf)

plt.figure(figsize=(11,7))

for i,svm_clf in enumerate (svm_clfs):
    plt.subplot(221+i)
    plot_predictions(svm_clf,[-1.5,2.5,-1,1.5])
    plot_dataset(X,y,[-1.5,2.5,-1,1.5])
    gamma , C = hyperparams[i]
plt.title(r"$\gamma = {}, C = {}$".format(gamma,C),fontsize = 16) 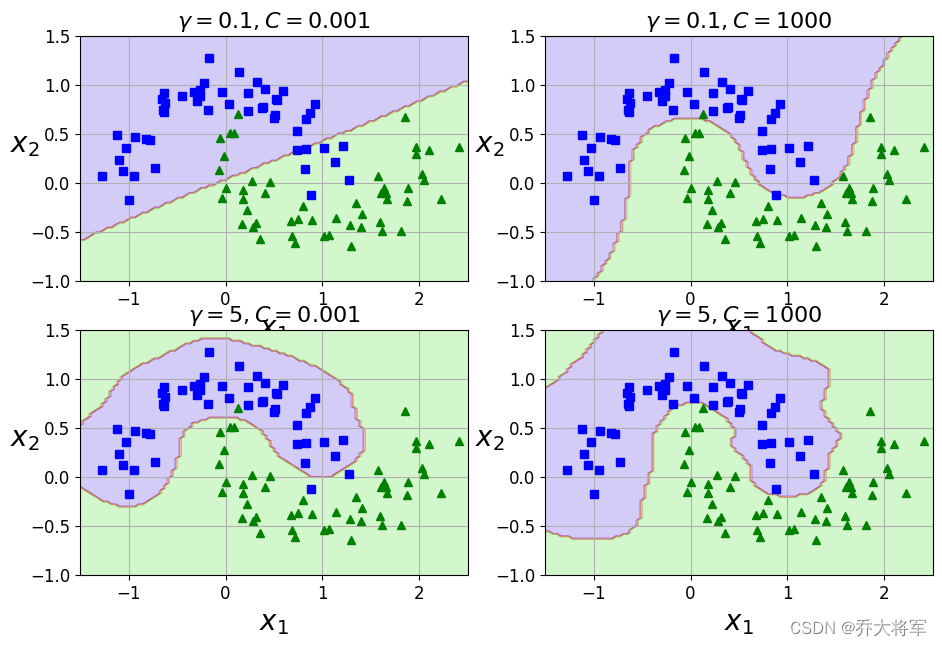
SVM中利用了核函数计算技巧,大大降低了计算复杂度:
增加gamma值使高斯曲线变窄,因此每个实例影响范围都较小;决策边界最终变得更不规则,在个别实例周围摆动
减少gamma值使高斯曲线变宽,因此每个实例影响范围都较大;决策边界最终变得更加平滑,降低过拟合风险


