贴个群号
WebGIS学习交流群461555818,欢迎大家。
成果图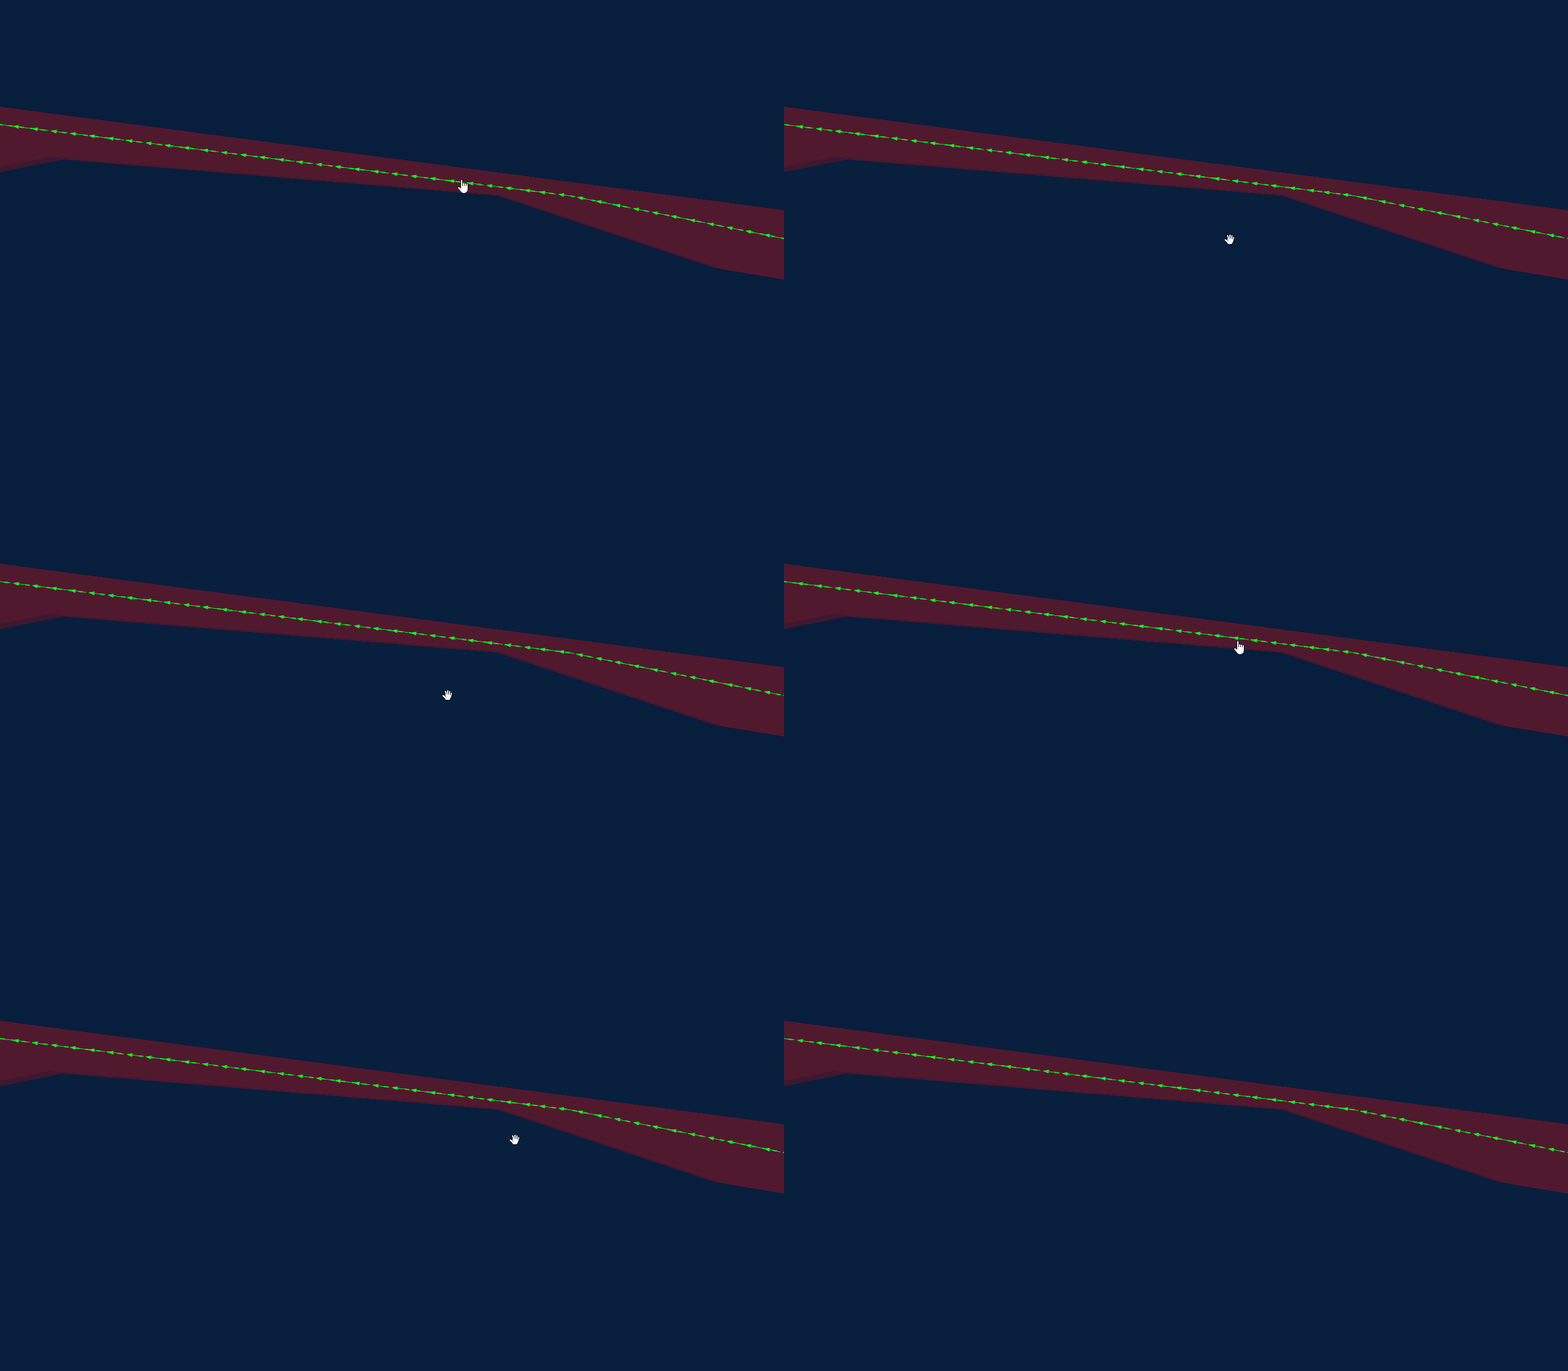
原理
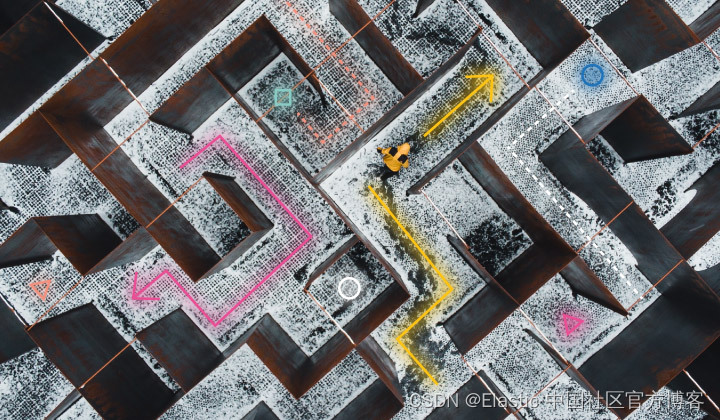
这个一般用于一些比如类似转移路线的指示,这个方案其实是一种视觉上的欺骗,实际上仔细观察箭头并没有动,在视觉上看起来好像是箭头在动,营造出一种动态的效果。
原理也很简单,就是叠加图层,一个用line-pattern写一个箭头图层,一个图层利用https://docs.mapbox.com/mapbox-gl-js/example/animate-ant-path官网上这个例子,搞成颜色一样的流动线在覆盖在上面,营造出一种箭头在流动的效果。
核心源码
//两个图层的配置
{
    "id": "zhuanyiluxian",
    "type": "line",
    "source": "zhuanyiluxian",
    "minzoom": 11,
    "maxzoom": 17,
    "layout": {
        "visibility": "visible"
    },
    "paint": {
        "line-pattern": "zhuanyiluxian",
        "line-opacity": 1,
        "line-width": 16
    }
}
{
    "id": "zhuanyiluxian-dash",
    "type": "line",
    "source": "zhuanyiluxian",
    "minzoom": 11,
    "maxzoom": 17,
    "layout": {
        "visibility": "visible"
    },
    "paint": {
        "line-color": "#06f315",
        "line-width": 2,
        "line-dasharray": [
            1.5,
            4,
            1.5
        ]
    }
}
	//添加以上两个图层之后 再添加这个函数,参数是动态线的图层配置
    async addDashLayer(sourceLayerConfig){
        const self = this
        const dashArraySequence = [
            [0, 4, 3],
            [0.5, 4, 2.5],
            [1, 4, 2],
            [1.5, 4, 1.5],
            [2, 4, 1],
            [2.5, 4, 0.5],
            [3, 4, 0],
            [0, 0.5, 3, 3.5],
            [0, 1, 3, 3],
            [0, 1.5, 3, 2.5],
            [0, 2, 3, 2],
            [0, 2.5, 3, 1.5],
            [0, 3, 3, 1],
            [0, 3.5, 3, 0.5]
        ];

        let step = 0;

        function animateDashArray(timestamp) {
            // Update line-dasharray using the next value in dashArraySequence. The
            // divisor in the expression `timestamp / 50` controls the animation speed.
            const newStep = parseInt(
                (timestamp / 100) % dashArraySequence.length
            );

            if (newStep !== step) {
                let layer = self.map.getLayer(sourceLayerConfig.id+'-dash'); //获取图层
                // debugger
                if (layer) {
                    self.map.setPaintProperty(
                        sourceLayerConfig.id+'-dash',
                        'line-dasharray',
                        dashArraySequence[step]
                    );
                    step = newStep;
                }
            }

            // Request the next frame of the animation.
            requestAnimationFrame(animateDashArray);
        }

        // start the animation
        animateDashArray(0);
    },


