对抗性示例生成
原文:
pytorch.org/tutorials/beginner/fgsm_tutorial.html译者:飞龙
协议:CC BY-NC-SA 4.0
注意
点击这里下载完整的示例代码
作者: Nathan Inkawhich
如果您正在阅读本文,希望您能欣赏一些机器学习模型的有效性。研究不断推动机器学习模型变得更快、更准确和更高效。然而,设计和训练模型时经常被忽视的一个方面是安全性和稳健性,尤其是面对希望欺骗模型的对手时。
本教程将提高您对机器学习模型安全漏洞的认识,并深入探讨对抗机器学习这一热门话题。您可能会惊讶地发现,向图像添加几乎不可察觉的扰动可以导致截然不同的模型性能。鉴于这是一个教程,我们将通过一个图像分类器的示例来探讨这个主题。具体来说,我们将使用第一个和最流行的攻击方法之一,即快速梯度符号攻击(FGSM),来欺骗一个 MNIST 分类器。
威胁模型
在这个背景下,有许多种类的对抗性攻击,每种攻击都有不同的目标和对攻击者知识的假设。然而,总体目标通常是向输入数据添加最少量的扰动,以导致所需的错误分类。攻击者知识的假设有几种类型,其中两种是:白盒和黑盒。白盒攻击假设攻击者对模型具有完全的知识和访问权限,包括架构、输入、输出和权重。黑盒攻击假设攻击者只能访问模型的输入和输出,对底层架构或权重一无所知。还有几种目标类型,包括错误分类和源/目标错误分类。错误分类的目标意味着对手只希望输出分类错误,但不在乎新的分类是什么。源/目标错误分类意味着对手希望修改原始属于特定源类别的图像,使其被分类为特定目标类别。
在这种情况下,FGSM 攻击是一个白盒攻击,其目标是错误分类。有了这些背景信息,我们现在可以详细讨论攻击。
快速梯度符号攻击
迄今为止,最早和最流行的对抗性攻击之一被称为快速梯度符号攻击(FGSM),由 Goodfellow 等人在解释和利用对抗性示例中描述。这种攻击非常强大,同时又直观。它旨在通过利用神经网络学习的方式,即梯度,来攻击神经网络。其思想很简单,不是通过根据反向传播的梯度调整权重来最小化损失,而是根据相同的反向传播梯度调整输入数据以最大化损失。换句话说,攻击使用损失相对于输入数据的梯度,然后调整输入数据以最大化损失。
在我们深入代码之前,让我们看看著名的FGSM熊猫示例,并提取一些符号。
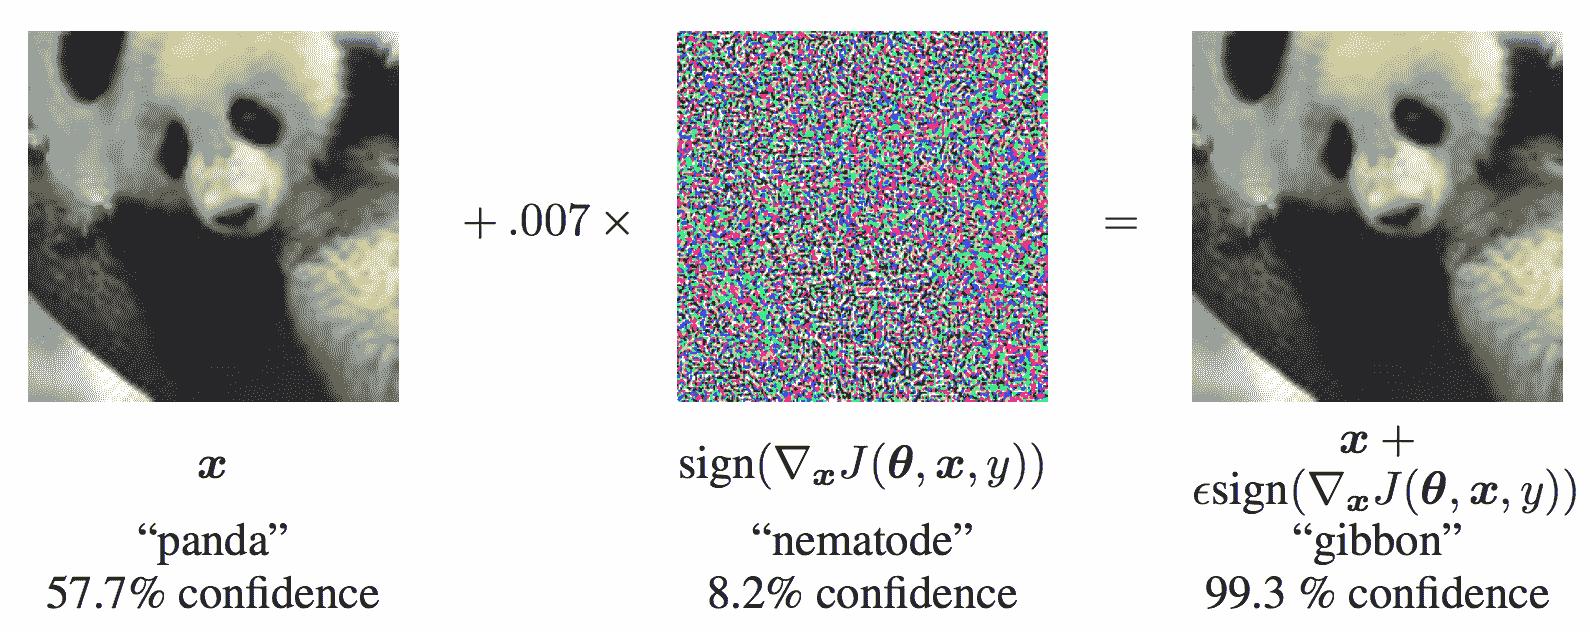
从图中可以看出, x \mathbf{x} x 是原始输入图像,被正确分类为“熊猫”, y y y 是 x \mathbf{x} x的地面真实标签, θ \mathbf{\theta} θ 代表模型参数, J ( θ , x , y ) J(\mathbf{\theta}, \mathbf{x}, y) J(θ,x,y) 是用于训练网络的损失。攻击将梯度反向传播回输入数据,计算 ∇ x J ( θ , x , y ) \nabla_{x} J(\mathbf{\theta}, \mathbf{x}, y) ∇xJ(θ,x,y)。然后,它通过一个小步骤(即 ϵ \epsilon ϵ 或图片中的 0.007 0.007 0.007)调整输入数据的方向(即 s i g n ( ∇ x J ( θ , x , y ) ) sign(\nabla_{x} J(\mathbf{\theta}, \mathbf{x}, y)) sign(∇xJ(θ,x,y))),以最大化损失。得到的扰动图像 x ′ x' x′,然后被目标网络误分类为“长臂猿”,而实际上仍然是“熊猫”。
希望现在这个教程的动机已经清楚了,让我们开始实施吧。
import torch
import torch.nn as nn
import torch.nn.functional as F
import torch.optim as optim
from torchvision import datasets, transforms
import numpy as np
import matplotlib.pyplot as plt
实现
在本节中,我们将讨论教程的输入参数,定义受攻击的模型,然后编写攻击代码并运行一些测试。
输入
本教程只有三个输入,并定义如下:
-
epsilons- 用于运行的 epsilon 值列表。在列表中保留 0 是重要的,因为它代表了模型在原始测试集上的性能。直观上,我们会期望 epsilon 越大,扰动越明显,但攻击在降低模型准确性方面更有效。由于数据范围在 [ 0 , 1 ] [0,1] [0,1] 这里,没有 epsilon 值应超过 1。 -
pretrained_model- 预训练的 MNIST 模型的路径,该模型是使用 pytorch/examples/mnist 训练的。为简单起见,可以在这里下载预训练模型。 -
use_cuda- 一个布尔标志,用于在需要时使用 CUDA。请注意,对于本教程,具有 CUDA 的 GPU 不是必需的,因为 CPU 不会花费太多时间。
epsilons = [0, .05, .1, .15, .2, .25, .3]
pretrained_model = "data/lenet_mnist_model.pth"
use_cuda=True
# Set random seed for reproducibility
torch.manual_seed(42)
<torch._C.Generator object at 0x7f6b149d3070>
受攻击的模型
如前所述,受攻击的模型是来自 pytorch/examples/mnist 的相同的 MNIST 模型。您可以训练和保存自己的 MNIST 模型,或者可以下载并使用提供的模型。这里的 Net 定义和测试数据加载器已从 MNIST 示例中复制。本节的目的是定义模型和数据加载器,然后初始化模型并加载预训练权重。
# LeNet Model definition
class Net(nn.Module):
    def __init__(self):
        super(Net, self).__init__()
        self.conv1 = nn.Conv2d(1, 32, 3, 1)
        self.conv2 = nn.Conv2d(32, 64, 3, 1)
        self.dropout1 = nn.Dropout(0.25)
        self.dropout2 = nn.Dropout(0.5)
        self.fc1 = nn.Linear(9216, 128)
        self.fc2 = nn.Linear(128, 10)

    def forward(self, x):
        x = self.conv1(x)
        x = F.relu(x)
        x = self.conv2(x)
        x = F.relu(x)
        x = F.max_pool2d(x, 2)
        x = self.dropout1(x)
        x = torch.flatten(x, 1)
        x = self.fc1(x)
        x = F.relu(x)
        x = self.dropout2(x)
        x = self.fc2(x)
        output = F.log_softmax(x, dim=1)
        return output

# MNIST Test dataset and dataloader declaration
test_loader = torch.utils.data.DataLoader(
    datasets.MNIST('../data', train=False, download=True, transform=transforms.Compose([
            transforms.ToTensor(),
            transforms.Normalize((0.1307,), (0.3081,)),
            ])),
        batch_size=1, shuffle=True)

# Define what device we are using
print("CUDA Available: ",torch.cuda.is_available())
device = torch.device("cuda" if use_cuda and torch.cuda.is_available() else "cpu")

# Initialize the network
model = Net().to(device)

# Load the pretrained model
model.load_state_dict(torch.load(pretrained_model, map_location=device))

# Set the model in evaluation mode. In this case this is for the Dropout layers
model.eval()
Downloading http://yann.lecun.com/exdb/mnist/train-images-idx3-ubyte.gz
Downloading http://yann.lecun.com/exdb/mnist/train-images-idx3-ubyte.gz to ../data/MNIST/raw/train-images-idx3-ubyte.gz

  0%|          | 0/9912422 [00:00<?, ?it/s]
100%|##########| 9912422/9912422 [00:00<00:00, 436275131.90it/s]
Extracting ../data/MNIST/raw/train-images-idx3-ubyte.gz to ../data/MNIST/raw

Downloading http://yann.lecun.com/exdb/mnist/train-labels-idx1-ubyte.gz
Downloading http://yann.lecun.com/exdb/mnist/train-labels-idx1-ubyte.gz to ../data/MNIST/raw/train-labels-idx1-ubyte.gz

  0%|          | 0/28881 [00:00<?, ?it/s]
100%|##########| 28881/28881 [00:00<00:00, 35440518.97it/s]
Extracting ../data/MNIST/raw/train-labels-idx1-ubyte.gz to ../data/MNIST/raw

Downloading http://yann.lecun.com/exdb/mnist/t10k-images-idx3-ubyte.gz
Downloading http://yann.lecun.com/exdb/mnist/t10k-images-idx3-ubyte.gz to ../data/MNIST/raw/t10k-images-idx3-ubyte.gz

  0%|          | 0/1648877 [00:00<?, ?it/s]
100%|##########| 1648877/1648877 [00:00<00:00, 251450385.28it/s]
Extracting ../data/MNIST/raw/t10k-images-idx3-ubyte.gz to ../data/MNIST/raw

Downloading http://yann.lecun.com/exdb/mnist/t10k-labels-idx1-ubyte.gz
Downloading http://yann.lecun.com/exdb/mnist/t10k-labels-idx1-ubyte.gz to ../data/MNIST/raw/t10k-labels-idx1-ubyte.gz

  0%|          | 0/4542 [00:00<?, ?it/s]
100%|##########| 4542/4542 [00:00<00:00, 36286721.46it/s]
Extracting ../data/MNIST/raw/t10k-labels-idx1-ubyte.gz to ../data/MNIST/raw

CUDA Available:  True

Net(
  (conv1): Conv2d(1, 32, kernel_size=(3, 3), stride=(1, 1))
  (conv2): Conv2d(32, 64, kernel_size=(3, 3), stride=(1, 1))
  (dropout1): Dropout(p=0.25, inplace=False)
  (dropout2): Dropout(p=0.5, inplace=False)
  (fc1): Linear(in_features=9216, out_features=128, bias=True)
  (fc2): Linear(in_features=128, out_features=10, bias=True)
)
FGSM 攻击
现在,我们可以定义一个函数,通过扰动原始输入来创建对抗性示例。fgsm_attack 函数接受三个输入,image 是原始干净图像(
x
x
x),epsilon 是像素级扰动量(
ϵ
\epsilon
ϵ),data_grad 是损失相对于输入图像的梯度(
∇
x
J
(
θ
,
x
,
y
)
\nabla_{x} J(\mathbf{\theta}, \mathbf{x}, y)
∇xJ(θ,x,y))。然后,函数创建扰动图像如下:
p e r t u r b e d _ i m a g e = i m a g e + e p s i l o n ∗ s i g n ( d a t a _ g r a d ) = x + ϵ ∗ s i g n ( ∇ x J ( θ , x , y ) ) perturbed\_image = image + epsilon*sign(data\_grad) = x + \epsilon * sign(\nabla_{x} J(\mathbf{\theta}, \mathbf{x}, y)) perturbed_image=image+epsilon∗sign(data_grad)=x+ϵ∗sign(∇xJ(θ,x,y))
最后,为了保持数据的原始范围,扰动图像被剪切到范围 [ 0 , 1 ] [0,1] [0,1]。
# FGSM attack code
def fgsm_attack(image, epsilon, data_grad):
    # Collect the element-wise sign of the data gradient
    sign_data_grad = data_grad.sign()
    # Create the perturbed image by adjusting each pixel of the input image
    perturbed_image = image + epsilon*sign_data_grad
    # Adding clipping to maintain [0,1] range
    perturbed_image = torch.clamp(perturbed_image, 0, 1)
    # Return the perturbed image
    return perturbed_image

# restores the tensors to their original scale
def denorm(batch, mean=[0.1307], std=[0.3081]):
  """
 Convert a batch of tensors to their original scale.

 Args:
 batch (torch.Tensor): Batch of normalized tensors.
 mean (torch.Tensor or list): Mean used for normalization.
 std (torch.Tensor or list): Standard deviation used for normalization.

 Returns:
 torch.Tensor: batch of tensors without normalization applied to them.
 """
    if isinstance(mean, list):
        mean = torch.tensor(mean).to(device)
    if isinstance(std, list):
        std = torch.tensor(std).to(device)

    return batch * std.view(1, -1, 1, 1) + mean.view(1, -1, 1, 1)
测试函数
最后,这个教程的核心结果来自 test 函数。每次调用此测试函数都会在 MNIST 测试集上执行完整的测试步骤,并报告最终准确性。但请注意,此函数还接受一个 epsilon 输入。这是因为 test 函数报告了受到强度为
ϵ
\epsilon
ϵ 的对手攻击的模型的准确性。更具体地说,对于测试集中的每个样本,该函数计算损失相对于输入数据的梯度(
d
a
t
a
_
g
r
a
d
data\_grad
data_grad),使用 fgsm_attack 创建扰动图像(
p
e
r
t
u
r
b
e
d
_
d
a
t
a
perturbed\_data
perturbed_data),然后检查扰动示例是否是对抗性的。除了测试模型的准确性外,该函数还保存并返回一些成功的对抗性示例,以便稍后进行可视化。
def test( model, device, test_loader, epsilon ):

    # Accuracy counter
    correct = 0
    adv_examples = []

    # Loop over all examples in test set
    for data, target in test_loader:

        # Send the data and label to the device
        data, target = data.to(device), target.to(device)

        # Set requires_grad attribute of tensor. Important for Attack
        data.requires_grad = True

        # Forward pass the data through the model
        output = model(data)
        init_pred = output.max(1, keepdim=True)[1] # get the index of the max log-probability

        # If the initial prediction is wrong, don't bother attacking, just move on
        if init_pred.item() != target.item():
            continue

        # Calculate the loss
        loss = F.nll_loss(output, target)

        # Zero all existing gradients
        model.zero_grad()

        # Calculate gradients of model in backward pass
        loss.backward()

        # Collect ``datagrad``
        data_grad = data.grad.data

        # Restore the data to its original scale
        data_denorm = denorm(data)

        # Call FGSM Attack
        perturbed_data = fgsm_attack(data_denorm, epsilon, data_grad)

        # Reapply normalization
        perturbed_data_normalized = transforms.Normalize((0.1307,), (0.3081,))(perturbed_data)

        # Re-classify the perturbed image
        output = model(perturbed_data_normalized)

        # Check for success
        final_pred = output.max(1, keepdim=True)[1] # get the index of the max log-probability
        if final_pred.item() == target.item():
            correct += 1
            # Special case for saving 0 epsilon examples
            if epsilon == 0 and len(adv_examples) < 5:
                adv_ex = perturbed_data.squeeze().detach().cpu().numpy()
                adv_examples.append( (init_pred.item(), final_pred.item(), adv_ex) )
        else:
            # Save some adv examples for visualization later
            if len(adv_examples) < 5:
                adv_ex = perturbed_data.squeeze().detach().cpu().numpy()
                adv_examples.append( (init_pred.item(), final_pred.item(), adv_ex) )

    # Calculate final accuracy for this epsilon
    final_acc = correct/float(len(test_loader))
    print(f"Epsilon: {epsilon}\tTest Accuracy = {correct} / {len(test_loader)} = {final_acc}")

    # Return the accuracy and an adversarial example
    return final_acc, adv_examples
运行攻击
实现的最后一部分是实际运行攻击。在这里,我们对epsilons输入中的每个 epsilon 值运行完整的测试步骤。对于每个 epsilon 值,我们还保存最终的准确率和一些成功的对抗性示例,以便在接下来的部分中绘制。请注意,随着 epsilon 值的增加,打印出的准确率也在降低。另外,请注意 ϵ = 0 \epsilon=0 ϵ=0的情况代表原始的测试准确率,没有攻击。
accuracies = []
examples = []

# Run test for each epsilon
for eps in epsilons:
    acc, ex = test(model, device, test_loader, eps)
    accuracies.append(acc)
    examples.append(ex)
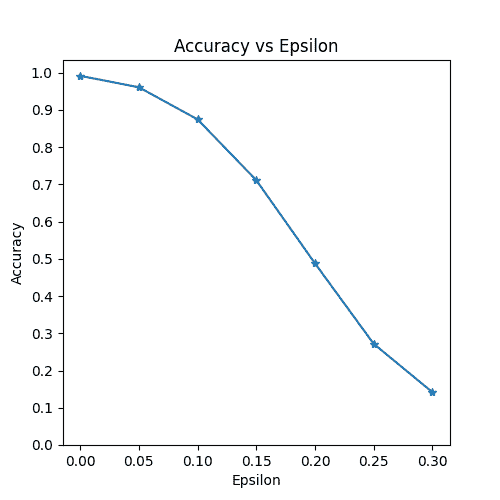
Epsilon: 0      Test Accuracy = 9912 / 10000 = 0.9912
Epsilon: 0.05   Test Accuracy = 9605 / 10000 = 0.9605
Epsilon: 0.1    Test Accuracy = 8743 / 10000 = 0.8743
Epsilon: 0.15   Test Accuracy = 7111 / 10000 = 0.7111
Epsilon: 0.2    Test Accuracy = 4877 / 10000 = 0.4877
Epsilon: 0.25   Test Accuracy = 2717 / 10000 = 0.2717
Epsilon: 0.3    Test Accuracy = 1418 / 10000 = 0.1418
结果
准确率 vs Epsilon
第一个结果是准确率与 epsilon 的图。正如前面提到的,随着 epsilon 的增加,我们预计测试准确率会降低。这是因为更大的 epsilon 意味着我们朝着最大化损失的方向迈出更大的一步。请注意,尽管 epsilon 值是线性间隔的,但曲线的趋势并不是线性的。例如,在 ϵ = 0.05 \epsilon=0.05 ϵ=0.05时的准确率仅比 ϵ = 0 \epsilon=0 ϵ=0时低约 4%,但在 ϵ = 0.2 \epsilon=0.2 ϵ=0.2时的准确率比 ϵ = 0.15 \epsilon=0.15 ϵ=0.15低 25%。另外,请注意,在 ϵ = 0.25 \epsilon=0.25 ϵ=0.25和 ϵ = 0.3 \epsilon=0.3 ϵ=0.3之间,模型的准确率达到了一个随机准确率,这是一个 10 类分类器。
plt.figure(figsize=(5,5))
plt.plot(epsilons, accuracies, "*-")
plt.yticks(np.arange(0, 1.1, step=0.1))
plt.xticks(np.arange(0, .35, step=0.05))
plt.title("Accuracy vs Epsilon")
plt.xlabel("Epsilon")
plt.ylabel("Accuracy")
plt.show()
示例对抗性示例
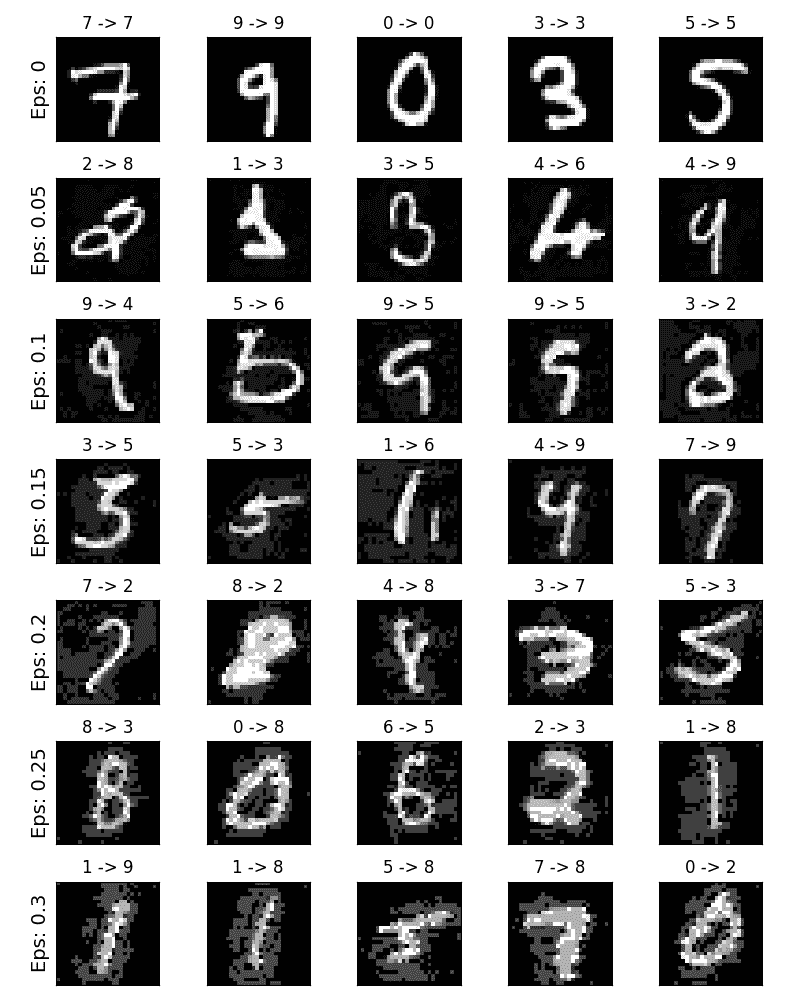
记住没有免费午餐的概念吗?在这种情况下,随着 epsilon 的增加,测试准确率降低但扰动变得更容易察觉。实际上,攻击者必须考虑准确率降低和可察觉性之间的权衡。在这里,我们展示了每个 epsilon 值下一些成功的对抗性示例的示例。图的每一行显示不同的 epsilon 值。第一行是 ϵ = 0 \epsilon=0 ϵ=0的示例,代表没有扰动的原始“干净”图像。每个图像的标题显示“原始分类 -> 对抗性分类”。请注意,在 ϵ = 0.15 \epsilon=0.15 ϵ=0.15时,扰动开始变得明显,在 ϵ = 0.3 \epsilon=0.3 ϵ=0.3时非常明显。然而,在所有情况下,人类仍然能够识别出正确的类别,尽管增加了噪音。
# Plot several examples of adversarial samples at each epsilon
cnt = 0
plt.figure(figsize=(8,10))
for i in range(len(epsilons)):
    for j in range(len(examples[i])):
        cnt += 1
        plt.subplot(len(epsilons),len(examples[0]),cnt)
        plt.xticks([], [])
        plt.yticks([], [])
        if j == 0:
            plt.ylabel(f"Eps: {epsilons[i]}", fontsize=14)
        orig,adv,ex = examples[i][j]
        plt.title(f"{orig} -> {adv}")
        plt.imshow(ex, cmap="gray")
plt.tight_layout()
plt.show()
接下来去哪里?
希望本教程能够为对抗性机器学习的主题提供一些见解。从这里出发有许多潜在的方向。这种攻击代表了对抗性攻击研究的最初阶段,自那时以来,已经有许多关于如何攻击和防御 ML 模型的后续想法。事实上,在 NIPS 2017 年有一个对抗性攻击和防御竞赛,许多竞赛中使用的方法在这篇论文中有描述:对抗性攻击和防御竞赛。对防御的工作也引出了使机器学习模型更加健壮的想法,既对自然扰动又对对抗性制作的输入。
另一个前进方向是在不同领域进行对抗性攻击和防御。对抗性研究不仅限于图像领域,可以查看这篇关于语音转文本模型的攻击。但也许了解更多关于对抗性机器学习的最佳方法是动手实践。尝试实现来自 NIPS 2017 竞赛的不同攻击,看看它与 FGSM 有何不同。然后,尝试防御模型免受您自己的攻击。
根据可用资源,另一个前进方向是修改代码以支持批处理、并行处理或分布式处理,而不是在上面的每个epsilon test()循环中一次处理一个攻击。
脚本的总运行时间: (3 分钟 52.817 秒)
下载 Python 源代码:fgsm_tutorial.py
下载 Jupyter 笔记本:fgsm_tutorial.ipynb
Sphinx-Gallery 生成的画廊
DCGAN 教程
原文:
pytorch.org/tutorials/beginner/dcgan_faces_tutorial.html译者:飞龙
协议:CC BY-NC-SA 4.0
注意
点击这里下载完整示例代码
作者:Nathan Inkawhich
介绍
本教程将通过一个示例介绍 DCGAN。我们将训练一个生成对抗网络(GAN),向其展示许多真实名人的照片后,生成新的名人。这里的大部分代码来自pytorch/examples,本文档将对实现进行详细解释,并阐明这个模型是如何工作的。但不用担心,不需要对 GAN 有任何先验知识,但可能需要初学者花一些时间思考底层实际发生的事情。另外,为了节省时间,最好有一个 GPU,或两个。让我们从头开始。
生成对抗网络
什么是 GAN?
GAN 是一个框架,用于教授深度学习模型捕获训练数据分布,以便我们可以从相同分布生成新数据。GAN 是由 Ian Goodfellow 于 2014 年发明的,并首次在论文生成对抗网络中描述。它们由两个不同的模型组成,一个生成器和一个判别器。生成器的任务是生成看起来像训练图像的“假”图像。判别器的任务是查看图像并输出它是来自真实训练图像还是来自生成器的假图像的概率。在训练过程中,生成器不断尝试欺骗判别器,生成越来越好的假图像,而判别器则努力成为更好的侦探,并正确分类真实和假图像。这个游戏的平衡是当生成器生成完美的假图像,看起来就像直接来自训练数据时,判别器总是以 50%的置信度猜测生成器的输出是真实的还是假的。
现在,让我们定义一些符号,这些符号将在整个教程中使用,从判别器开始。让 x x x表示代表图像的数据。 D ( x ) D(x) D(x)是判别器网络,它输出 x x x来自训练数据而不是生成器的(标量)概率。在这里,由于我们处理的是图像, D ( x ) D(x) D(x)的输入是 CHW 大小为 3x64x64 的图像。直观地说,当 x x x来自训练数据时, D ( x ) D(x) D(x)应该是高的,当 x x x来自生成器时, D ( x ) D(x) D(x)应该是低的。 D ( x ) D(x) D(x)也可以被视为传统的二元分类器。
对于生成器的表示,让 z z z是从标准正态分布中采样的潜在空间向量。 G ( z ) G(z) G(z)表示生成器函数,它将潜在向量 z z z映射到数据空间。生成器 G G G的目标是估计训练数据来自的分布( p d a t a p_{data} pdata),以便可以从该估计分布( p g p_g pg)生成假样本。
因此, D ( G ( z ) ) D(G(z)) D(G(z))是生成器 G G G的输出是真实图像的概率(标量)。如Goodfellow 的论文所述, D D D和 G G G在一个最小最大游戏中发挥作用,其中 D D D试图最大化它正确分类真实和假图像的概率( l o g D ( x ) logD(x) logD(x)),而 G G G试图最小化 D D D预测其输出是假的概率( l o g ( 1 − D ( G ( z ) ) ) log(1-D(G(z))) log(1−D(G(z))))。从论文中,GAN 的损失函数为:
min G max D V ( D , G ) = E x ∼ p d a t a ( x ) [ l o g D ( x ) ] + E z ∼ p z ( z ) [ l o g ( 1 − D ( G ( z ) ) ) ] \underset{G}{\text{min}} \underset{D}{\text{max}}V(D,G) = \mathbb{E}_{x\sim p_{data}(x)}\big[logD(x)\big] + \mathbb{E}_{z\sim p_{z}(z)}\big[log(1-D(G(z)))\big] GminDmaxV(D,G)=Ex∼pdata(x)[logD(x)]+Ez∼pz(z)[log(1−D(G(z)))]
理论上,这个极小极大博弈的解是当 p g = p d a t a p_g = p_{data} pg=pdata时,如果输入是真实的还是伪造的,鉴别器会随机猜测。然而,GAN 的收敛理论仍在积极研究中,实际上模型并不总是训练到这一点。
什么是 DCGAN?
DCGAN 是上述 GAN 的直接扩展,除了明确在鉴别器和生成器中使用卷积和卷积转置层。它首次由 Radford 等人在论文使用深度卷积生成对抗网络进行无监督表示学习中描述。鉴别器由步进的卷积层、批量归一化层和LeakyReLU激活组成。输入是一个 3x64x64 的输入图像,输出是一个标量概率,表示输入来自真实数据分布。生成器由卷积转置层、批量归一化层和ReLU激活组成。输入是一个从标准正态分布中抽取的潜在向量 z z z,输出是一个 3x64x64 的 RGB 图像。步进的卷积转置层允许将潜在向量转换为与图像形状相同的体积。在论文中,作者还提供了一些建议,关于如何设置优化器、如何计算损失函数以及如何初始化模型权重,所有这些将在接下来的章节中解释。
#%matplotlib inline
import argparse
import os
import random
import torch
import torch.nn as nn
import torch.nn.parallel
import torch.optim as optim
import torch.utils.data
import torchvision.datasets as dset
import torchvision.transforms as transforms
import torchvision.utils as vutils
import numpy as np
import matplotlib.pyplot as plt
import matplotlib.animation as animation
from IPython.display import HTML

# Set random seed for reproducibility
manualSeed = 999
#manualSeed = random.randint(1, 10000) # use if you want new results
print("Random Seed: ", manualSeed)
random.seed(manualSeed)
torch.manual_seed(manualSeed)
torch.use_deterministic_algorithms(True) # Needed for reproducible results
Random Seed: 999
输入
让我们为运行定义一些输入:
-
dataroot- 数据集文件夹根目录的路径。我们将在下一节详细讨论数据集。 -
workers- 用于使用DataLoader加载数据的工作线程数。 -
batch_size- 训练中使用的批量大小。DCGAN 论文使用批量大小为 128。 -
image_size- 用于训练的图像的空间尺寸。此实现默认为 64x64。如果需要其他尺寸,则必须更改 D 和 G 的结构。有关更多详细信息,请参见这里。 -
nc- 输入图像中的颜色通道数。对于彩色图像,这是 3。 -
nz- 潜在向量的长度。 -
ngf- 与通过生成器传递的特征图的深度有关。 -
ndf- 设置通过鉴别器传播的特征图的深度。 -
num_epochs- 要运行的训练周期数。训练时间更长可能会导致更好的结果,但也会花费更多时间。 -
lr- 训练的学习率。如 DCGAN 论文所述,此数字应为 0.0002。 -
beta1- Adam 优化器的 beta1 超参数。如论文所述,此数字应为 0.5。 -
ngpu- 可用的 GPU 数量。如果为 0,则代码将在 CPU 模式下运行。如果此数字大于 0,则将在该数量的 GPU 上运行。
# Root directory for dataset
dataroot = "data/celeba"

# Number of workers for dataloader
workers = 2

# Batch size during training
batch_size = 128

# Spatial size of training images. All images will be resized to this
#   size using a transformer.
image_size = 64

# Number of channels in the training images. For color images this is 3
nc = 3

# Size of z latent vector (i.e. size of generator input)
nz = 100

# Size of feature maps in generator
ngf = 64

# Size of feature maps in discriminator
ndf = 64

# Number of training epochs
num_epochs = 5

# Learning rate for optimizers
lr = 0.0002

# Beta1 hyperparameter for Adam optimizers
beta1 = 0.5

# Number of GPUs available. Use 0 for CPU mode.
ngpu = 1
数据
在本教程中,我们将使用Celeb-A Faces 数据集,可以在链接的网站上下载,或在Google Drive中下载。数据集将下载为名为img_align_celeba.zip的文件。下载后,创建一个名为celeba的目录,并将 zip 文件解压缩到该目录中。然后,将此笔记本的dataroot输入设置为您刚刚创建的celeba目录。生成的目录结构应为:
/path/to/celeba
  ->  img_align_celeba
  ->  188242.jpg
  ->  173822.jpg
  ->  284702.jpg
  ->  537394.jpg
  ...
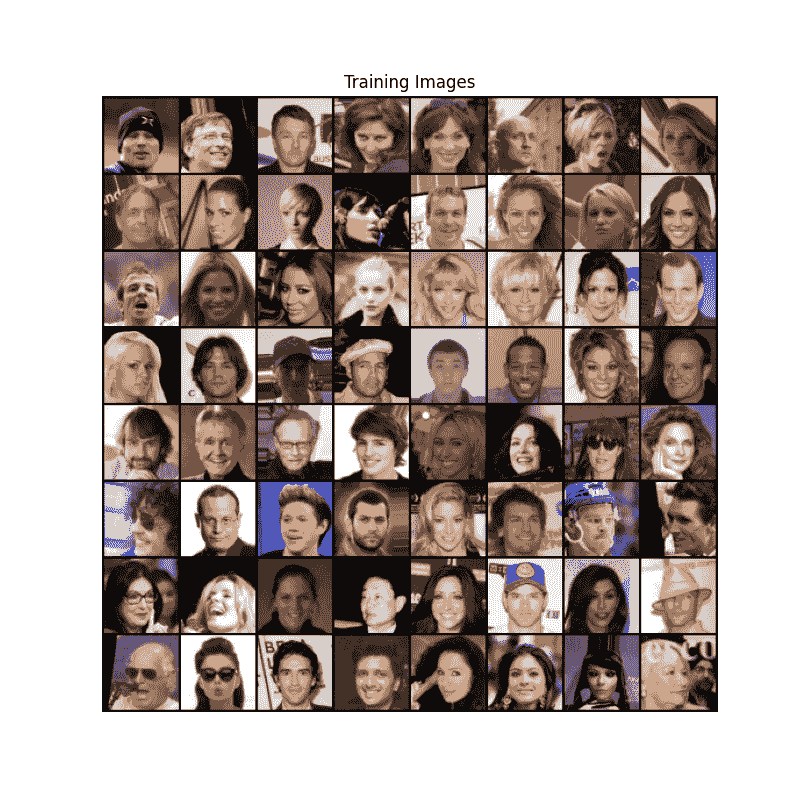
这是一个重要的步骤,因为我们将使用ImageFolder数据集类,这要求数据集根文件夹中有子目录。现在,我们可以创建数据集,创建数据加载器,设置设备运行,并最终可视化一些训练数据。
# We can use an image folder dataset the way we have it setup.
# Create the dataset
dataset = dset.ImageFolder(root=dataroot,
                           transform=transforms.Compose([
                               transforms.Resize(image_size),
                               transforms.CenterCrop(image_size),
                               transforms.ToTensor(),
                               transforms.Normalize((0.5, 0.5, 0.5), (0.5, 0.5, 0.5)),
                           ]))
# Create the dataloader
dataloader = torch.utils.data.DataLoader(dataset, batch_size=batch_size,
                                         shuffle=True, num_workers=workers)

# Decide which device we want to run on
device = torch.device("cuda:0" if (torch.cuda.is_available() and ngpu > 0) else "cpu")

# Plot some training images
real_batch = next(iter(dataloader))
plt.figure(figsize=(8,8))
plt.axis("off")
plt.title("Training Images")
plt.imshow(np.transpose(vutils.make_grid(real_batch[0].to(device)[:64], padding=2, normalize=True).cpu(),(1,2,0)))
plt.show()
实现
设置好我们的输入参数并准备好数据集后,现在可以开始实现了。我们将从权重初始化策略开始,然后详细讨论生成器、鉴别器、损失函数和训练循环。
权重初始化
根据 DCGAN 论文,作者规定所有模型权重应该从正态分布中随机初始化,mean=0,stdev=0.02。weights_init函数接受一个初始化的模型作为输入,并重新初始化所有卷积、卷积转置和批量归一化层,以满足这个标准。这个函数在初始化后立即应用于模型。
# custom weights initialization called on ``netG`` and ``netD``
def weights_init(m):
    classname = m.__class__.__name__
    if classname.find('Conv') != -1:
        nn.init.normal_(m.weight.data, 0.0, 0.02)
    elif classname.find('BatchNorm') != -1:
        nn.init.normal_(m.weight.data, 1.0, 0.02)
        nn.init.constant_(m.bias.data, 0)
生成器
生成器 G G G旨在将潜在空间向量( z z z)映射到数据空间。由于我们的数据是图像,将 z z z转换为数据空间最终意味着创建一个与训练图像相同大小的 RGB 图像(即 3x64x64)。在实践中,通过一系列步进的二维卷积转置层来实现这一点,每个层都与一个 2D 批量归一化层和一个 relu 激活函数配对。生成器的输出通过 tanh 函数传递,将其返回到输入数据范围 [ − 1 , 1 ] [-1,1] [−1,1]。值得注意的是,在卷积转置层之后存在批量归一化函数,这是 DCGAN 论文的一个重要贡献。这些层有助于训练过程中梯度的流动。下面是生成器的代码。
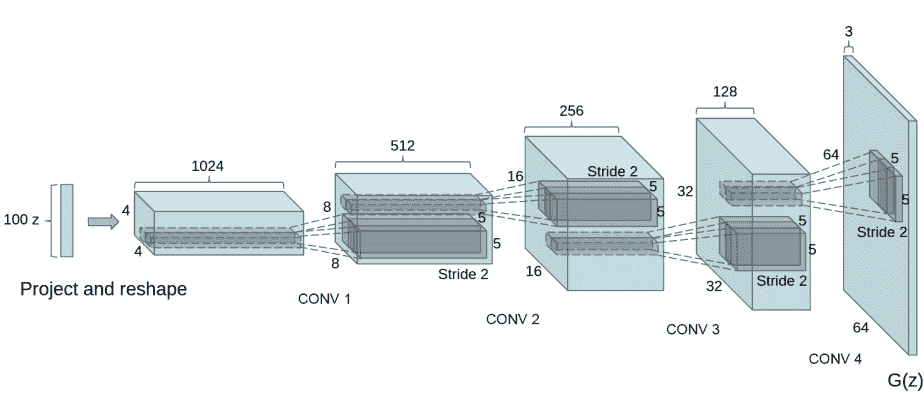
注意,在输入部分设置的输入(nz、ngf和nc)如何影响代码中的生成器架构。nz是 z 输入向量的长度,ngf与通过生成器传播的特征图的大小有关,nc是输出图像中的通道数(对于 RGB 图像设置为 3)。
# Generator Code

class Generator(nn.Module):
    def __init__(self, ngpu):
        super(Generator, self).__init__()
        self.ngpu = ngpu
        self.main = nn.Sequential(
            # input is Z, going into a convolution
            nn.ConvTranspose2d( nz, ngf * 8, 4, 1, 0, bias=False),
            nn.BatchNorm2d(ngf * 8),
            nn.ReLU(True),
            # state size. ``(ngf*8) x 4 x 4``
            nn.ConvTranspose2d(ngf * 8, ngf * 4, 4, 2, 1, bias=False),
            nn.BatchNorm2d(ngf * 4),
            nn.ReLU(True),
            # state size. ``(ngf*4) x 8 x 8``
            nn.ConvTranspose2d( ngf * 4, ngf * 2, 4, 2, 1, bias=False),
            nn.BatchNorm2d(ngf * 2),
            nn.ReLU(True),
            # state size. ``(ngf*2) x 16 x 16``
            nn.ConvTranspose2d( ngf * 2, ngf, 4, 2, 1, bias=False),
            nn.BatchNorm2d(ngf),
            nn.ReLU(True),
            # state size. ``(ngf) x 32 x 32``
            nn.ConvTranspose2d( ngf, nc, 4, 2, 1, bias=False),
            nn.Tanh()
            # state size. ``(nc) x 64 x 64``
        )

    def forward(self, input):
        return self.main(input)
现在,我们可以实例化生成器并应用weights_init函数。查看打印出的模型,看看生成器对象的结构是如何的。
# Create the generator
netG = Generator(ngpu).to(device)

# Handle multi-GPU if desired
if (device.type == 'cuda') and (ngpu > 1):
    netG = nn.DataParallel(netG, list(range(ngpu)))

# Apply the ``weights_init`` function to randomly initialize all weights
#  to ``mean=0``, ``stdev=0.02``.
netG.apply(weights_init)

# Print the model
print(netG)
Generator(
  (main): Sequential(
    (0): ConvTranspose2d(100, 512, kernel_size=(4, 4), stride=(1, 1), bias=False)
    (1): BatchNorm2d(512, eps=1e-05, momentum=0.1, affine=True, track_running_stats=True)
    (2): ReLU(inplace=True)
    (3): ConvTranspose2d(512, 256, kernel_size=(4, 4), stride=(2, 2), padding=(1, 1), bias=False)
    (4): BatchNorm2d(256, eps=1e-05, momentum=0.1, affine=True, track_running_stats=True)
    (5): ReLU(inplace=True)
    (6): ConvTranspose2d(256, 128, kernel_size=(4, 4), stride=(2, 2), padding=(1, 1), bias=False)
    (7): BatchNorm2d(128, eps=1e-05, momentum=0.1, affine=True, track_running_stats=True)
    (8): ReLU(inplace=True)
    (9): ConvTranspose2d(128, 64, kernel_size=(4, 4), stride=(2, 2), padding=(1, 1), bias=False)
    (10): BatchNorm2d(64, eps=1e-05, momentum=0.1, affine=True, track_running_stats=True)
    (11): ReLU(inplace=True)
    (12): ConvTranspose2d(64, 3, kernel_size=(4, 4), stride=(2, 2), padding=(1, 1), bias=False)
    (13): Tanh()
  )
)
鉴别器
如前所述,鉴别器 D D D是一个二元分类网络,接受图像作为输入,并输出一个标量概率,表示输入图像是真实的(而不是假的)。在这里, D D D接受一个 3x64x64 的输入图像,通过一系列的 Conv2d、BatchNorm2d 和 LeakyReLU 层处理,通过 Sigmoid 激活函数输出最终概率。如果需要,可以通过添加更多层来扩展这个架构,但是使用步进卷积、BatchNorm 和 LeakyReLU 具有重要意义。DCGAN 论文提到,使用步进卷积而不是池化进行下采样是一个好的做法,因为它让网络学习自己的池化函数。此外,批量归一化和 LeakyReLU 函数有助于促进健康的梯度流,这对于 G G G和 D D D的学习过程至关重要。
鉴别器代码
class Discriminator(nn.Module):
    def __init__(self, ngpu):
        super(Discriminator, self).__init__()
        self.ngpu = ngpu
        self.main = nn.Sequential(
            # input is ``(nc) x 64 x 64``
            nn.Conv2d(nc, ndf, 4, 2, 1, bias=False),
            nn.LeakyReLU(0.2, inplace=True),
            # state size. ``(ndf) x 32 x 32``
            nn.Conv2d(ndf, ndf * 2, 4, 2, 1, bias=False),
            nn.BatchNorm2d(ndf * 2),
            nn.LeakyReLU(0.2, inplace=True),
            # state size. ``(ndf*2) x 16 x 16``
            nn.Conv2d(ndf * 2, ndf * 4, 4, 2, 1, bias=False),
            nn.BatchNorm2d(ndf * 4),
            nn.LeakyReLU(0.2, inplace=True),
            # state size. ``(ndf*4) x 8 x 8``
            nn.Conv2d(ndf * 4, ndf * 8, 4, 2, 1, bias=False),
            nn.BatchNorm2d(ndf * 8),
            nn.LeakyReLU(0.2, inplace=True),
            # state size. ``(ndf*8) x 4 x 4``
            nn.Conv2d(ndf * 8, 1, 4, 1, 0, bias=False),
            nn.Sigmoid()
        )

    def forward(self, input):
        return self.main(input)
现在,就像生成器一样,我们可以创建鉴别器,应用weights_init函数,并打印模型的结构。
# Create the Discriminator
netD = Discriminator(ngpu).to(device)

# Handle multi-GPU if desired
if (device.type == 'cuda') and (ngpu > 1):
    netD = nn.DataParallel(netD, list(range(ngpu)))

# Apply the ``weights_init`` function to randomly initialize all weights
# like this: ``to mean=0, stdev=0.2``.
netD.apply(weights_init)

# Print the model
print(netD)
Discriminator(
  (main): Sequential(
    (0): Conv2d(3, 64, kernel_size=(4, 4), stride=(2, 2), padding=(1, 1), bias=False)
    (1): LeakyReLU(negative_slope=0.2, inplace=True)
    (2): Conv2d(64, 128, kernel_size=(4, 4), stride=(2, 2), padding=(1, 1), bias=False)
    (3): BatchNorm2d(128, eps=1e-05, momentum=0.1, affine=True, track_running_stats=True)
    (4): LeakyReLU(negative_slope=0.2, inplace=True)
    (5): Conv2d(128, 256, kernel_size=(4, 4), stride=(2, 2), padding=(1, 1), bias=False)
    (6): BatchNorm2d(256, eps=1e-05, momentum=0.1, affine=True, track_running_stats=True)
    (7): LeakyReLU(negative_slope=0.2, inplace=True)
    (8): Conv2d(256, 512, kernel_size=(4, 4), stride=(2, 2), padding=(1, 1), bias=False)
    (9): BatchNorm2d(512, eps=1e-05, momentum=0.1, affine=True, track_running_stats=True)
    (10): LeakyReLU(negative_slope=0.2, inplace=True)
    (11): Conv2d(512, 1, kernel_size=(4, 4), stride=(1, 1), bias=False)
    (12): Sigmoid()
  )
)
损失函数和优化器
设置好 D D D和 G G G后,我们可以通过损失函数和优化器指定它们的学习方式。我们将使用二元交叉熵损失(BCELoss)函数,PyTorch 中定义如下:
ℓ ( x , y ) = L = { l 1 , … , l N } ⊤ , l n = − [ y n ⋅ log x n + ( 1 − y n ) ⋅ log ( 1 − x n ) ] \ell(x, y) = L = \{l_1,\dots,l_N\}^\top, \quad l_n = - \left[ y_n \cdot \log x_n + (1 - y_n) \cdot \log (1 - x_n) \right] ℓ(x,y)=L={l1,…,lN}⊤,ln=−[yn⋅logxn+(1−yn)⋅log(1−xn)]
请注意,此函数提供了目标函数中两个 log 组件的计算(即 l o g ( D ( x ) ) log(D(x)) log(D(x))和 l o g ( 1 − D ( G ( z ) ) ) log(1-D(G(z))) log(1−D(G(z))))。我们可以通过输入 y y y来指定要使用 BCE 方程的哪一部分。这将在即将到来的训练循环中完成,但重要的是要理解我们如何通过改变 y y y(即 GT 标签)来选择我们希望计算的组件。
接下来,我们将把真实标签定义为 1,将假标签定义为 0。在计算 D D D和 G G G的损失时将使用这些标签,这也是原始 GAN 论文中使用的惯例。最后,我们设置了两个单独的优化器,一个用于 D D D,一个用于 G G G。如 DCGAN 论文中所指定的,两者都是 Adam 优化器,学习率为 0.0002,Beta1 = 0.5。为了跟踪生成器的学习进展,我们将生成一批固定的潜在向量,这些向量是从高斯分布中抽取的(即 fixed_noise)。在训练循环中,我们将定期将这个 fixed_noise 输入到 G G G中,随着迭代的进行,我们将看到图像从噪音中生成出来。
# Initialize the ``BCELoss`` function
criterion = nn.BCELoss()

# Create batch of latent vectors that we will use to visualize
#  the progression of the generator
fixed_noise = torch.randn(64, nz, 1, 1, device=device)

# Establish convention for real and fake labels during training
real_label = 1.
fake_label = 0.

# Setup Adam optimizers for both G and D
optimizerD = optim.Adam(netD.parameters(), lr=lr, betas=(beta1, 0.999))
optimizerG = optim.Adam(netG.parameters(), lr=lr, betas=(beta1, 0.999))
训练
最后,现在我们已经定义了 GAN 框架的所有部分,我们可以开始训练。请注意,训练 GAN 有点像一种艺术形式,因为不正确的超参数设置会导致模式崩溃,而对出现问题的原因却没有太多解释。在这里,我们将紧密遵循Goodfellow 的论文中的算法 1,同时遵循ganhacks中显示的一些最佳实践。换句话说,我们将“为真实和伪造图像构建不同的小批量”,并调整 G 的目标函数以最大化 l o g ( D ( G ( z ) ) ) log(D(G(z))) log(D(G(z)))。训练分为两个主要部分。第一部分更新鉴别器,第二部分更新生成器。
第一部分 - 训练鉴别器
回想一下,训练鉴别器的目标是最大化将给定输入正确分类为真实或伪造的概率。就 Goodfellow 而言,我们希望“通过升高其随机梯度来更新鉴别器”。实际上,我们希望最大化 l o g ( D ( x ) ) + l o g ( 1 − D ( G ( z ) ) ) log(D(x)) + log(1-D(G(z))) log(D(x))+log(1−D(G(z)))。由于ganhacks中的单独小批量建议,我们将分两步计算这个过程。首先,我们将从训练集中构建一批真实样本,通过 D D D进行前向传播,计算损失( l o g ( D ( x ) ) log(D(x)) log(D(x))),然后通过反向传播计算梯度。其次,我们将使用当前生成器构建一批伪造样本,将这批样本通过 D D D进行前向传播,计算损失( l o g ( 1 − D ( G ( z ) ) ) log(1-D(G(z))) log(1−D(G(z)))),并通过反向传播累积梯度。现在,通过从所有真实和所有伪造批次中累积的梯度,我们调用鉴别器的优化器步骤。
第二部分 - 训练生成器
如原始论文所述,我们希望通过最小化
l
o
g
(
1
−
D
(
G
(
z
)
)
)
log(1-D(G(z)))
log(1−D(G(z)))来训练生成器,以生成更好的伪造品。正如提到的,Goodfellow 指出,特别是在学习过程的早期,这并不能提供足够的梯度。为了解决这个问题,我们希望最大化
l
o
g
(
D
(
G
(
z
)
)
)
log(D(G(z)))
log(D(G(z)))。在代码中,我们通过以下方式实现这一点:用鉴别器对第一部分的生成器输出进行分类,使用真实标签作为 GT 计算 G 的损失,通过反向传播计算 G 的梯度,最后使用优化器步骤更新 G 的参数。在损失函数中使用真实标签作为 GT 标签可能看起来有些反直觉,但这使我们可以使用BCELoss中的
l
o
g
(
x
)
log(x)
log(x)部分(而不是
l
o
g
(
1
−
x
)
log(1-x)
log(1−x)部分),这正是我们想要的。
最后,我们将进行一些统计报告,并在每个时代结束时将我们的 fixed_noise 批次通过生成器,以直观地跟踪 G 的训练进度。报告的训练统计数据为:
-
Loss_D - 判别器损失,计算为所有真实批次和所有虚假批次的损失之和( l o g ( D ( x ) ) + l o g ( 1 − D ( G ( z ) ) ) log(D(x)) + log(1 - D(G(z))) log(D(x))+log(1−D(G(z))))。
-
Loss_G - 生成器损失,计算为 l o g ( D ( G ( z ) ) ) log(D(G(z))) log(D(G(z)))
-
D(x) - 判别器对所有真实批次的平均输出(跨批次)。这应该从接近 1 开始,然后在生成器变得更好时理论上收敛到 0.5。想一想为什么会这样。
-
D(G(z)) - 所有虚假批次的平均判别器输出。第一个数字是在更新 D 之前,第二个数字是在更新 D 之后。这些数字应该从接近 0 开始,随着 G 变得更好而收敛到 0.5。想一想为什么会这样。
注意: 这一步可能需要一段时间,取决于您运行了多少个 epochs 以及是否从数据集中删除了一些数据。
# Training Loop

# Lists to keep track of progress
img_list = []
G_losses = []
D_losses = []
iters = 0

print("Starting Training Loop...")
# For each epoch
for epoch in range(num_epochs):
    # For each batch in the dataloader
    for i, data in enumerate(dataloader, 0):

        ############################
        # (1) Update D network: maximize log(D(x)) + log(1 - D(G(z)))
        ###########################
        ## Train with all-real batch
        netD.zero_grad()
        # Format batch
        real_cpu = data[0].to(device)
        b_size = real_cpu.size(0)
        label = torch.full((b_size,), real_label, dtype=torch.float, device=device)
        # Forward pass real batch through D
        output = netD(real_cpu).view(-1)
        # Calculate loss on all-real batch
        errD_real = criterion(output, label)
        # Calculate gradients for D in backward pass
        errD_real.backward()
        D_x = output.mean().item()

        ## Train with all-fake batch
        # Generate batch of latent vectors
        noise = torch.randn(b_size, nz, 1, 1, device=device)
        # Generate fake image batch with G
        fake = netG(noise)
        label.fill_(fake_label)
        # Classify all fake batch with D
        output = netD(fake.detach()).view(-1)
        # Calculate D's loss on the all-fake batch
        errD_fake = criterion(output, label)
        # Calculate the gradients for this batch, accumulated (summed) with previous gradients
        errD_fake.backward()
        D_G_z1 = output.mean().item()
        # Compute error of D as sum over the fake and the real batches
        errD = errD_real + errD_fake
        # Update D
        optimizerD.step()

        ############################
        # (2) Update G network: maximize log(D(G(z)))
        ###########################
        netG.zero_grad()
        label.fill_(real_label)  # fake labels are real for generator cost
        # Since we just updated D, perform another forward pass of all-fake batch through D
        output = netD(fake).view(-1)
        # Calculate G's loss based on this output
        errG = criterion(output, label)
        # Calculate gradients for G
        errG.backward()
        D_G_z2 = output.mean().item()
        # Update G
        optimizerG.step()

        # Output training stats
        if i % 50 == 0:
            print('[%d/%d][%d/%d]\tLoss_D: %.4f\tLoss_G: %.4f\tD(x): %.4f\tD(G(z)): %.4f / %.4f'
                  % (epoch, num_epochs, i, len(dataloader),
                     errD.item(), errG.item(), D_x, D_G_z1, D_G_z2))

        # Save Losses for plotting later
        G_losses.append(errG.item())
        D_losses.append(errD.item())

        # Check how the generator is doing by saving G's output on fixed_noise
        if (iters % 500 == 0) or ((epoch == num_epochs-1) and (i == len(dataloader)-1)):
            with torch.no_grad():
                fake = netG(fixed_noise).detach().cpu()
            img_list.append(vutils.make_grid(fake, padding=2, normalize=True))

        iters += 1
Starting Training Loop...
[0/5][0/1583]   Loss_D: 1.4640  Loss_G: 6.9360  D(x): 0.7143    D(G(z)): 0.5877 / 0.0017
[0/5][50/1583]  Loss_D: 0.0174  Loss_G: 23.7368 D(x): 0.9881    D(G(z)): 0.0000 / 0.0000
[0/5][100/1583] Loss_D: 0.5983  Loss_G: 9.9471  D(x): 0.9715    D(G(z)): 0.3122 / 0.0003
[0/5][150/1583] Loss_D: 0.4940  Loss_G: 5.6772  D(x): 0.7028    D(G(z)): 0.0241 / 0.0091
[0/5][200/1583] Loss_D: 0.5931  Loss_G: 7.1186  D(x): 0.9423    D(G(z)): 0.3016 / 0.0018
[0/5][250/1583] Loss_D: 0.3846  Loss_G: 3.2697  D(x): 0.7663    D(G(z)): 0.0573 / 0.0739
[0/5][300/1583] Loss_D: 1.3306  Loss_G: 8.3204  D(x): 0.8768    D(G(z)): 0.6353 / 0.0009
[0/5][350/1583] Loss_D: 0.6451  Loss_G: 6.0499  D(x): 0.9025    D(G(z)): 0.3673 / 0.0060
[0/5][400/1583] Loss_D: 0.4211  Loss_G: 3.7316  D(x): 0.8407    D(G(z)): 0.1586 / 0.0392
[0/5][450/1583] Loss_D: 0.6569  Loss_G: 2.4818  D(x): 0.6437    D(G(z)): 0.0858 / 0.1129
[0/5][500/1583] Loss_D: 1.2208  Loss_G: 2.9943  D(x): 0.4179    D(G(z)): 0.0109 / 0.1133
[0/5][550/1583] Loss_D: 0.3400  Loss_G: 4.7669  D(x): 0.9135    D(G(z)): 0.1922 / 0.0145
[0/5][600/1583] Loss_D: 0.5756  Loss_G: 4.8500  D(x): 0.9189    D(G(z)): 0.3193 / 0.0187
[0/5][650/1583] Loss_D: 0.2470  Loss_G: 4.1606  D(x): 0.9460    D(G(z)): 0.1545 / 0.0250
[0/5][700/1583] Loss_D: 0.3887  Loss_G: 4.1884  D(x): 0.8518    D(G(z)): 0.1562 / 0.0297
[0/5][750/1583] Loss_D: 0.5353  Loss_G: 4.1742  D(x): 0.8034    D(G(z)): 0.1958 / 0.0302
[0/5][800/1583] Loss_D: 0.3213  Loss_G: 5.8919  D(x): 0.9076    D(G(z)): 0.1572 / 0.0065
[0/5][850/1583] Loss_D: 0.8850  Loss_G: 7.4333  D(x): 0.9258    D(G(z)): 0.4449 / 0.0017
[0/5][900/1583] Loss_D: 1.2624  Loss_G: 10.0392 D(x): 0.9896    D(G(z)): 0.6361 / 0.0002
[0/5][950/1583] Loss_D: 0.8802  Loss_G: 6.9221  D(x): 0.5527    D(G(z)): 0.0039 / 0.0045
[0/5][1000/1583]        Loss_D: 0.5799  Loss_G: 3.1800  D(x): 0.7062    D(G(z)): 0.0762 / 0.0884
[0/5][1050/1583]        Loss_D: 0.9647  Loss_G: 6.6894  D(x): 0.9429    D(G(z)): 0.5270 / 0.0035
[0/5][1100/1583]        Loss_D: 0.5624  Loss_G: 3.6715  D(x): 0.7944    D(G(z)): 0.2069 / 0.0445
[0/5][1150/1583]        Loss_D: 0.6205  Loss_G: 4.8995  D(x): 0.8634    D(G(z)): 0.3046 / 0.0169
[0/5][1200/1583]        Loss_D: 0.2569  Loss_G: 4.2945  D(x): 0.9455    D(G(z)): 0.1528 / 0.0255
[0/5][1250/1583]        Loss_D: 0.4921  Loss_G: 3.2500  D(x): 0.8152    D(G(z)): 0.1892 / 0.0753
[0/5][1300/1583]        Loss_D: 0.4068  Loss_G: 3.7702  D(x): 0.8153    D(G(z)): 0.1335 / 0.0472
[0/5][1350/1583]        Loss_D: 1.1704  Loss_G: 7.3408  D(x): 0.9443    D(G(z)): 0.5863 / 0.0022
[0/5][1400/1583]        Loss_D: 0.6111  Loss_G: 2.2676  D(x): 0.6714    D(G(z)): 0.0793 / 0.1510
[0/5][1450/1583]        Loss_D: 0.7817  Loss_G: 4.0744  D(x): 0.7915    D(G(z)): 0.3573 / 0.0242
[0/5][1500/1583]        Loss_D: 0.7177  Loss_G: 1.9253  D(x): 0.5770    D(G(z)): 0.0257 / 0.1909
[0/5][1550/1583]        Loss_D: 0.4518  Loss_G: 2.8314  D(x): 0.7991    D(G(z)): 0.1479 / 0.0885
[1/5][0/1583]   Loss_D: 0.4267  Loss_G: 4.5150  D(x): 0.8976    D(G(z)): 0.2401 / 0.0196
[1/5][50/1583]  Loss_D: 0.5106  Loss_G: 2.7800  D(x): 0.7073    D(G(z)): 0.0663 / 0.0932
[1/5][100/1583] Loss_D: 0.6300  Loss_G: 1.8648  D(x): 0.6557    D(G(z)): 0.0756 / 0.2118
[1/5][150/1583] Loss_D: 1.1727  Loss_G: 5.1536  D(x): 0.8397    D(G(z)): 0.5261 / 0.0125
[1/5][200/1583] Loss_D: 0.4675  Loss_G: 2.9615  D(x): 0.7645    D(G(z)): 0.1400 / 0.0780
[1/5][250/1583] Loss_D: 0.7938  Loss_G: 3.1614  D(x): 0.6958    D(G(z)): 0.2248 / 0.0678
[1/5][300/1583] Loss_D: 0.9869  Loss_G: 5.9243  D(x): 0.9619    D(G(z)): 0.5349 / 0.0063
[1/5][350/1583] Loss_D: 0.5178  Loss_G: 3.0236  D(x): 0.7795    D(G(z)): 0.1769 / 0.0700
[1/5][400/1583] Loss_D: 1.4509  Loss_G: 2.7187  D(x): 0.3278    D(G(z)): 0.0133 / 0.1273
[1/5][450/1583] Loss_D: 0.5530  Loss_G: 4.8110  D(x): 0.9151    D(G(z)): 0.3237 / 0.0160
[1/5][500/1583] Loss_D: 0.4621  Loss_G: 4.1158  D(x): 0.8720    D(G(z)): 0.2278 / 0.0293
[1/5][550/1583] Loss_D: 0.4987  Loss_G: 4.0199  D(x): 0.8533    D(G(z)): 0.2367 / 0.0287
[1/5][600/1583] Loss_D: 1.0630  Loss_G: 4.6502  D(x): 0.9145    D(G(z)): 0.5018 / 0.0218
[1/5][650/1583] Loss_D: 0.6081  Loss_G: 4.3172  D(x): 0.8670    D(G(z)): 0.3312 / 0.0221
[1/5][700/1583] Loss_D: 0.4703  Loss_G: 2.4900  D(x): 0.7538    D(G(z)): 0.1245 / 0.1188
[1/5][750/1583] Loss_D: 0.4827  Loss_G: 2.2941  D(x): 0.7372    D(G(z)): 0.1105 / 0.1300
[1/5][800/1583] Loss_D: 0.4013  Loss_G: 3.8850  D(x): 0.8895    D(G(z)): 0.2179 / 0.0324
[1/5][850/1583] Loss_D: 0.7245  Loss_G: 1.9088  D(x): 0.6100    D(G(z)): 0.0950 / 0.1898
[1/5][900/1583] Loss_D: 0.8372  Loss_G: 1.2346  D(x): 0.5232    D(G(z)): 0.0332 / 0.3633
[1/5][950/1583] Loss_D: 0.5561  Loss_G: 3.2048  D(x): 0.7660    D(G(z)): 0.2035 / 0.0594
[1/5][1000/1583]        Loss_D: 0.6859  Loss_G: 1.6347  D(x): 0.5764    D(G(z)): 0.0435 / 0.2540
[1/5][1050/1583]        Loss_D: 0.6785  Loss_G: 4.3244  D(x): 0.9066    D(G(z)): 0.3835 / 0.0203
[1/5][1100/1583]        Loss_D: 0.4835  Loss_G: 2.4080  D(x): 0.7428    D(G(z)): 0.1073 / 0.1147
[1/5][1150/1583]        Loss_D: 0.5507  Loss_G: 2.5400  D(x): 0.7857    D(G(z)): 0.2182 / 0.1092
[1/5][1200/1583]        Loss_D: 0.6054  Loss_G: 3.4802  D(x): 0.8263    D(G(z)): 0.2934 / 0.0441
[1/5][1250/1583]        Loss_D: 0.4788  Loss_G: 2.3533  D(x): 0.7872    D(G(z)): 0.1698 / 0.1327
[1/5][1300/1583]        Loss_D: 0.5314  Loss_G: 2.7018  D(x): 0.8273    D(G(z)): 0.2423 / 0.0921
[1/5][1350/1583]        Loss_D: 0.8579  Loss_G: 4.6214  D(x): 0.9623    D(G(z)): 0.5089 / 0.0159
[1/5][1400/1583]        Loss_D: 0.4919  Loss_G: 2.7656  D(x): 0.8122    D(G(z)): 0.2147 / 0.0864
[1/5][1450/1583]        Loss_D: 0.4461  Loss_G: 3.0576  D(x): 0.8042    D(G(z)): 0.1798 / 0.0619
[1/5][1500/1583]        Loss_D: 0.7182  Loss_G: 3.7270  D(x): 0.8553    D(G(z)): 0.3713 / 0.0382
[1/5][1550/1583]        Loss_D: 0.6378  Loss_G: 3.7489  D(x): 0.8757    D(G(z)): 0.3523 / 0.0317
[2/5][0/1583]   Loss_D: 0.3965  Loss_G: 2.6262  D(x): 0.7941    D(G(z)): 0.1247 / 0.0963
[2/5][50/1583]  Loss_D: 0.6504  Loss_G: 3.9890  D(x): 0.9267    D(G(z)): 0.3865 / 0.0275
[2/5][100/1583] Loss_D: 0.6523  Loss_G: 3.8724  D(x): 0.8707    D(G(z)): 0.3613 / 0.0299
[2/5][150/1583] Loss_D: 0.7685  Loss_G: 3.9059  D(x): 0.9361    D(G(z)): 0.4534 / 0.0278
[2/5][200/1583] Loss_D: 0.6587  Loss_G: 1.9218  D(x): 0.6469    D(G(z)): 0.1291 / 0.1888
[2/5][250/1583] Loss_D: 0.6971  Loss_G: 2.2256  D(x): 0.6208    D(G(z)): 0.1226 / 0.1465
[2/5][300/1583] Loss_D: 0.5797  Loss_G: 2.4846  D(x): 0.7762    D(G(z)): 0.2434 / 0.1098
[2/5][350/1583] Loss_D: 0.4674  Loss_G: 1.8800  D(x): 0.8045    D(G(z)): 0.1903 / 0.1877
[2/5][400/1583] Loss_D: 0.6462  Loss_G: 1.9510  D(x): 0.7018    D(G(z)): 0.1935 / 0.1792
[2/5][450/1583] Loss_D: 0.9817  Loss_G: 4.2519  D(x): 0.9421    D(G(z)): 0.5381 / 0.0233
[2/5][500/1583] Loss_D: 0.7721  Loss_G: 1.0928  D(x): 0.5402    D(G(z)): 0.0316 / 0.3927
[2/5][550/1583] Loss_D: 0.6037  Loss_G: 2.6914  D(x): 0.7719    D(G(z)): 0.2504 / 0.0896
[2/5][600/1583] Loss_D: 1.4213  Loss_G: 5.4727  D(x): 0.9408    D(G(z)): 0.6792 / 0.0064
[2/5][650/1583] Loss_D: 0.7246  Loss_G: 1.7030  D(x): 0.6716    D(G(z)): 0.2184 / 0.2246
[2/5][700/1583] Loss_D: 0.6642  Loss_G: 3.3809  D(x): 0.8554    D(G(z)): 0.3438 / 0.0591
[2/5][750/1583] Loss_D: 0.6649  Loss_G: 2.0197  D(x): 0.7169    D(G(z)): 0.2333 / 0.1565
[2/5][800/1583] Loss_D: 0.4594  Loss_G: 2.6623  D(x): 0.8150    D(G(z)): 0.1930 / 0.0944
[2/5][850/1583] Loss_D: 1.1957  Loss_G: 3.1871  D(x): 0.7790    D(G(z)): 0.5576 / 0.0568
[2/5][900/1583] Loss_D: 0.6657  Loss_G: 1.5311  D(x): 0.7092    D(G(z)): 0.2122 / 0.2558
[2/5][950/1583] Loss_D: 0.6795  Loss_G: 1.4149  D(x): 0.6134    D(G(z)): 0.1195 / 0.2937
[2/5][1000/1583]        Loss_D: 0.5995  Loss_G: 2.1744  D(x): 0.7325    D(G(z)): 0.2054 / 0.1484
[2/5][1050/1583]        Loss_D: 0.6706  Loss_G: 1.6705  D(x): 0.6425    D(G(z)): 0.1414 / 0.2310
[2/5][1100/1583]        Loss_D: 1.2840  Loss_G: 4.4620  D(x): 0.9736    D(G(z)): 0.6601 / 0.0225
[2/5][1150/1583]        Loss_D: 0.7568  Loss_G: 3.1238  D(x): 0.8153    D(G(z)): 0.3717 / 0.0581
[2/5][1200/1583]        Loss_D: 0.6331  Loss_G: 1.9048  D(x): 0.6799    D(G(z)): 0.1604 / 0.1814
[2/5][1250/1583]        Loss_D: 0.5802  Loss_G: 2.4358  D(x): 0.7561    D(G(z)): 0.2194 / 0.1095
[2/5][1300/1583]        Loss_D: 0.9613  Loss_G: 2.3290  D(x): 0.7463    D(G(z)): 0.3952 / 0.1349
[2/5][1350/1583]        Loss_D: 0.5367  Loss_G: 1.7398  D(x): 0.7580    D(G(z)): 0.1898 / 0.2216
[2/5][1400/1583]        Loss_D: 0.7762  Loss_G: 3.6246  D(x): 0.9006    D(G(z)): 0.4378 / 0.0364
[2/5][1450/1583]        Loss_D: 0.7183  Loss_G: 4.0442  D(x): 0.8602    D(G(z)): 0.3857 / 0.0254
[2/5][1500/1583]        Loss_D: 0.5416  Loss_G: 2.0642  D(x): 0.7393    D(G(z)): 0.1758 / 0.1532
[2/5][1550/1583]        Loss_D: 0.5295  Loss_G: 1.7855  D(x): 0.6768    D(G(z)): 0.0886 / 0.2154
[3/5][0/1583]   Loss_D: 0.8635  Loss_G: 1.7508  D(x): 0.4918    D(G(z)): 0.0280 / 0.2154
[3/5][50/1583]  Loss_D: 0.8697  Loss_G: 0.7859  D(x): 0.5216    D(G(z)): 0.1124 / 0.4941
[3/5][100/1583] Loss_D: 0.8607  Loss_G: 4.5255  D(x): 0.9197    D(G(z)): 0.4973 / 0.0157
[3/5][150/1583] Loss_D: 0.4805  Loss_G: 2.3071  D(x): 0.7743    D(G(z)): 0.1742 / 0.1291
[3/5][200/1583] Loss_D: 0.4925  Loss_G: 2.6018  D(x): 0.7907    D(G(z)): 0.1970 / 0.0948
[3/5][250/1583] Loss_D: 0.7870  Loss_G: 3.3529  D(x): 0.8408    D(G(z)): 0.4050 / 0.0469
[3/5][300/1583] Loss_D: 0.5479  Loss_G: 1.7376  D(x): 0.7216    D(G(z)): 0.1592 / 0.2227
[3/5][350/1583] Loss_D: 0.8117  Loss_G: 3.4145  D(x): 0.9076    D(G(z)): 0.4685 / 0.0437
[3/5][400/1583] Loss_D: 0.4210  Loss_G: 2.3880  D(x): 0.7543    D(G(z)): 0.1047 / 0.1217
[3/5][450/1583] Loss_D: 1.5745  Loss_G: 0.2366  D(x): 0.2747    D(G(z)): 0.0361 / 0.8096
[3/5][500/1583] Loss_D: 0.7196  Loss_G: 2.1319  D(x): 0.7332    D(G(z)): 0.2935 / 0.1403
[3/5][550/1583] Loss_D: 0.5697  Loss_G: 2.6649  D(x): 0.8816    D(G(z)): 0.3210 / 0.0917
[3/5][600/1583] Loss_D: 0.7779  Loss_G: 1.2727  D(x): 0.5540    D(G(z)): 0.0855 / 0.3412
[3/5][650/1583] Loss_D: 0.4090  Loss_G: 2.6893  D(x): 0.8334    D(G(z)): 0.1835 / 0.0855
[3/5][700/1583] Loss_D: 0.8108  Loss_G: 3.8991  D(x): 0.9241    D(G(z)): 0.4716 / 0.0281
[3/5][750/1583] Loss_D: 0.9907  Loss_G: 4.7885  D(x): 0.9111    D(G(z)): 0.5402 / 0.0123
[3/5][800/1583] Loss_D: 0.4725  Loss_G: 2.3347  D(x): 0.7577    D(G(z)): 0.1400 / 0.1222
[3/5][850/1583] Loss_D: 1.5580  Loss_G: 4.9586  D(x): 0.8954    D(G(z)): 0.7085 / 0.0132
[3/5][900/1583] Loss_D: 0.5785  Loss_G: 1.6395  D(x): 0.6581    D(G(z)): 0.1003 / 0.2411
[3/5][950/1583] Loss_D: 0.6592  Loss_G: 1.0890  D(x): 0.5893    D(G(z)): 0.0451 / 0.3809
[3/5][1000/1583]        Loss_D: 0.7280  Loss_G: 3.5368  D(x): 0.8898    D(G(z)): 0.4176 / 0.0409
[3/5][1050/1583]        Loss_D: 0.7088  Loss_G: 3.4301  D(x): 0.8558    D(G(z)): 0.3845 / 0.0457
[3/5][1100/1583]        Loss_D: 0.5651  Loss_G: 2.1150  D(x): 0.7602    D(G(z)): 0.2127 / 0.1532
[3/5][1150/1583]        Loss_D: 0.5412  Loss_G: 1.7790  D(x): 0.6602    D(G(z)): 0.0801 / 0.2088
[3/5][1200/1583]        Loss_D: 1.2277  Loss_G: 1.1464  D(x): 0.4864    D(G(z)): 0.2915 / 0.3665
[3/5][1250/1583]        Loss_D: 0.7148  Loss_G: 1.3957  D(x): 0.5948    D(G(z)): 0.1076 / 0.2876
[3/5][1300/1583]        Loss_D: 1.0675  Loss_G: 1.3018  D(x): 0.4056    D(G(z)): 0.0310 / 0.3355
[3/5][1350/1583]        Loss_D: 0.8064  Loss_G: 0.7482  D(x): 0.5846    D(G(z)): 0.1453 / 0.5147
[3/5][1400/1583]        Loss_D: 0.6032  Loss_G: 3.0601  D(x): 0.8474    D(G(z)): 0.3189 / 0.0590
[3/5][1450/1583]        Loss_D: 0.5329  Loss_G: 2.8172  D(x): 0.8234    D(G(z)): 0.2567 / 0.0795
[3/5][1500/1583]        Loss_D: 0.9292  Loss_G: 3.5544  D(x): 0.8686    D(G(z)): 0.4887 / 0.0410
[3/5][1550/1583]        Loss_D: 0.5929  Loss_G: 2.9118  D(x): 0.8614    D(G(z)): 0.3239 / 0.0702
[4/5][0/1583]   Loss_D: 0.5564  Loss_G: 2.7516  D(x): 0.8716    D(G(z)): 0.3145 / 0.0799
[4/5][50/1583]  Loss_D: 1.0485  Loss_G: 0.6751  D(x): 0.4332    D(G(z)): 0.0675 / 0.5568
[4/5][100/1583] Loss_D: 0.6753  Loss_G: 1.4046  D(x): 0.6028    D(G(z)): 0.0882 / 0.2901
[4/5][150/1583] Loss_D: 0.5946  Loss_G: 1.7618  D(x): 0.6862    D(G(z)): 0.1488 / 0.2016
[4/5][200/1583] Loss_D: 0.4866  Loss_G: 2.2638  D(x): 0.7628    D(G(z)): 0.1633 / 0.1321
[4/5][250/1583] Loss_D: 0.7493  Loss_G: 1.0999  D(x): 0.5541    D(G(z)): 0.0659 / 0.3787
[4/5][300/1583] Loss_D: 1.0886  Loss_G: 4.6532  D(x): 0.9370    D(G(z)): 0.5811 / 0.0149
[4/5][350/1583] Loss_D: 0.6106  Loss_G: 1.9212  D(x): 0.6594    D(G(z)): 0.1322 / 0.1825
[4/5][400/1583] Loss_D: 0.5226  Loss_G: 2.9611  D(x): 0.8178    D(G(z)): 0.2378 / 0.0731
[4/5][450/1583] Loss_D: 1.0068  Loss_G: 1.3267  D(x): 0.4310    D(G(z)): 0.0375 / 0.3179
[4/5][500/1583] Loss_D: 3.1088  Loss_G: 0.1269  D(x): 0.0706    D(G(z)): 0.0061 / 0.8897
[4/5][550/1583] Loss_D: 1.7889  Loss_G: 0.4800  D(x): 0.2175    D(G(z)): 0.0143 / 0.6479
[4/5][600/1583] Loss_D: 0.6732  Loss_G: 3.5685  D(x): 0.8775    D(G(z)): 0.3879 / 0.0362
[4/5][650/1583] Loss_D: 0.5169  Loss_G: 2.1943  D(x): 0.7222    D(G(z)): 0.1349 / 0.1416
[4/5][700/1583] Loss_D: 0.4567  Loss_G: 2.4442  D(x): 0.7666    D(G(z)): 0.1410 / 0.1204
[4/5][750/1583] Loss_D: 0.5972  Loss_G: 2.2992  D(x): 0.6286    D(G(z)): 0.0670 / 0.1283
[4/5][800/1583] Loss_D: 0.5461  Loss_G: 1.9777  D(x): 0.7013    D(G(z)): 0.1318 / 0.1795
[4/5][850/1583] Loss_D: 0.6317  Loss_G: 2.2345  D(x): 0.6962    D(G(z)): 0.1854 / 0.1385
[4/5][900/1583] Loss_D: 0.6034  Loss_G: 3.2300  D(x): 0.8781    D(G(z)): 0.3448 / 0.0517
[4/5][950/1583] Loss_D: 0.6371  Loss_G: 2.7755  D(x): 0.8595    D(G(z)): 0.3357 / 0.0826
[4/5][1000/1583]        Loss_D: 0.6077  Loss_G: 3.3958  D(x): 0.9026    D(G(z)): 0.3604 / 0.0458
[4/5][1050/1583]        Loss_D: 0.5057  Loss_G: 3.2545  D(x): 0.8705    D(G(z)): 0.2691 / 0.0546
[4/5][1100/1583]        Loss_D: 0.4552  Loss_G: 2.0632  D(x): 0.7887    D(G(z)): 0.1704 / 0.1524
[4/5][1150/1583]        Loss_D: 0.9933  Loss_G: 1.0264  D(x): 0.4507    D(G(z)): 0.0636 / 0.4182
[4/5][1200/1583]        Loss_D: 0.5037  Loss_G: 1.9940  D(x): 0.6967    D(G(z)): 0.0959 / 0.1698
[4/5][1250/1583]        Loss_D: 0.4760  Loss_G: 2.5973  D(x): 0.8192    D(G(z)): 0.2164 / 0.0945
[4/5][1300/1583]        Loss_D: 1.0137  Loss_G: 3.8782  D(x): 0.9330    D(G(z)): 0.5405 / 0.0309
[4/5][1350/1583]        Loss_D: 0.9084  Loss_G: 3.1406  D(x): 0.7540    D(G(z)): 0.3980 / 0.0648
[4/5][1400/1583]        Loss_D: 0.6724  Loss_G: 4.1269  D(x): 0.9536    D(G(z)): 0.4234 / 0.0236
[4/5][1450/1583]        Loss_D: 0.6452  Loss_G: 3.5163  D(x): 0.8730    D(G(z)): 0.3555 / 0.0412
[4/5][1500/1583]        Loss_D: 0.8843  Loss_G: 1.4950  D(x): 0.5314    D(G(z)): 0.1035 / 0.2835
[4/5][1550/1583]        Loss_D: 2.3345  Loss_G: 1.0675  D(x): 0.1448    D(G(z)): 0.0228 / 0.4177
结果
最后,让我们看看我们的表现如何。在这里,我们将看到三种不同的结果。首先,我们将看到 D 和 G 的损失在训练过程中如何变化。其次,我们将可视化 G 在每个 epoch 的 fixed_noise 批次上的输出。第三,我们将查看一批真实数据和 G 生成的虚假数据相邻。
损失与训练迭代次数
下面是 D 和 G 的损失与训练迭代次数的图表。
plt.figure(figsize=(10,5))
plt.title("Generator and Discriminator Loss During Training")
plt.plot(G_losses,label="G")
plt.plot(D_losses,label="D")
plt.xlabel("iterations")
plt.ylabel("Loss")
plt.legend()
plt.show()
训练过程中的生成器和判别器损失
G 的进展可视化
记得我们在每个训练 epoch 后保存了生成器在 fixed_noise 批次上的输出。现在,我们可以通过动画来可视化 G 的训练进展。点击播放按钮开始动画。
fig = plt.figure(figsize=(8,8))
plt.axis("off")
ims = [[plt.imshow(np.transpose(i,(1,2,0)), animated=True)] for i in img_list]
ani = animation.ArtistAnimation(fig, ims, interval=1000, repeat_delay=1000, blit=True)

HTML(ani.to_jshtml())

空间变换网络教程
原文:
pytorch.org/tutorials/intermediate/spatial_transformer_tutorial.html译者:飞龙
协议:CC BY-NC-SA 4.0
注意
点击这里下载完整的示例代码
作者:Ghassen HAMROUNI

在本教程中,您将学习如何使用称为空间变换网络的视觉注意机制来增强您的网络。您可以在DeepMind 论文中关于空间变换网络的信息。
空间变换网络是可微分注意力的泛化,适用于任何空间变换。空间变换网络(简称 STN)允许神经网络学习如何对输入图像执行空间变换,以增强模型的几何不变性。例如,它可以裁剪感兴趣的区域,缩放和校正图像的方向。这可能是一个有用的机制,因为 CNN 对旋转和缩放以及更一般的仿射变换不具有不变性。
STN 最好的一点是能够简单地将其插入到任何现有的 CNN 中,几乎不需要修改。
# License: BSD
# Author: Ghassen Hamrouni

import torch
import torch.nn as nn
import torch.nn.functional as F
import torch.optim as optim
import torchvision
from torchvision import datasets, transforms
import matplotlib.pyplot as plt
import numpy as np

plt.ion()   # interactive mode
<contextlib.ExitStack object at 0x7fc0914a7160>
加载数据
在本文中,我们使用经典的 MNIST 数据集进行实验。使用标准的卷积网络增强了空间变换网络。
from six.moves import urllib
opener = urllib.request.build_opener()
opener.addheaders = [('User-agent', 'Mozilla/5.0')]
urllib.request.install_opener(opener)

device = torch.device("cuda" if torch.cuda.is_available() else "cpu")

# Training dataset
train_loader = torch.utils.data.DataLoader(
    datasets.MNIST(root='.', train=True, download=True,
                   transform=transforms.Compose([
                       transforms.ToTensor(),
                       transforms.Normalize((0.1307,), (0.3081,))
                   ])), batch_size=64, shuffle=True, num_workers=4)
# Test dataset
test_loader = torch.utils.data.DataLoader(
    datasets.MNIST(root='.', train=False, transform=transforms.Compose([
        transforms.ToTensor(),
        transforms.Normalize((0.1307,), (0.3081,))
    ])), batch_size=64, shuffle=True, num_workers=4)
Downloading http://yann.lecun.com/exdb/mnist/train-images-idx3-ubyte.gz
Downloading http://yann.lecun.com/exdb/mnist/train-images-idx3-ubyte.gz to ./MNIST/raw/train-images-idx3-ubyte.gz

  0%|          | 0/9912422 [00:00<?, ?it/s]
100%|##########| 9912422/9912422 [00:00<00:00, 367023704.91it/s]
Extracting ./MNIST/raw/train-images-idx3-ubyte.gz to ./MNIST/raw

Downloading http://yann.lecun.com/exdb/mnist/train-labels-idx1-ubyte.gz
Downloading http://yann.lecun.com/exdb/mnist/train-labels-idx1-ubyte.gz to ./MNIST/raw/train-labels-idx1-ubyte.gz

  0%|          | 0/28881 [00:00<?, ?it/s]
100%|##########| 28881/28881 [00:00<00:00, 47653695.45it/s]
Extracting ./MNIST/raw/train-labels-idx1-ubyte.gz to ./MNIST/raw

Downloading http://yann.lecun.com/exdb/mnist/t10k-images-idx3-ubyte.gz
Downloading http://yann.lecun.com/exdb/mnist/t10k-images-idx3-ubyte.gz to ./MNIST/raw/t10k-images-idx3-ubyte.gz

  0%|          | 0/1648877 [00:00<?, ?it/s]
100%|##########| 1648877/1648877 [00:00<00:00, 343101225.21it/s]
Extracting ./MNIST/raw/t10k-images-idx3-ubyte.gz to ./MNIST/raw

Downloading http://yann.lecun.com/exdb/mnist/t10k-labels-idx1-ubyte.gz
Downloading http://yann.lecun.com/exdb/mnist/t10k-labels-idx1-ubyte.gz to ./MNIST/raw/t10k-labels-idx1-ubyte.gz

  0%|          | 0/4542 [00:00<?, ?it/s]
100%|##########| 4542/4542 [00:00<00:00, 48107395.88it/s]
Extracting ./MNIST/raw/t10k-labels-idx1-ubyte.gz to ./MNIST/raw
描绘空间变换网络
空间变换网络归结为三个主要组件:
-
本地化网络是一个普通的 CNN,用于回归变换参数。这个变换从未从这个数据集中明确学习,相反,网络自动学习增强全局准确性的空间变换。
-
网格生成器生成与输出图像中的每个像素对应的输入图像中的坐标网格。
-
采样器使用变换的参数并将其应用于输入图像。
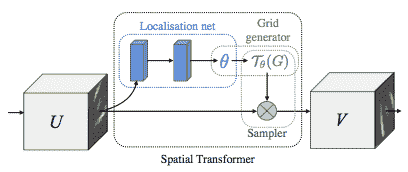
注意
我们需要包含 affine_grid 和 grid_sample 模块的最新版本的 PyTorch。
class Net(nn.Module):
    def __init__(self):
        super(Net, self).__init__()
        self.conv1 = nn.Conv2d(1, 10, kernel_size=5)
        self.conv2 = nn.Conv2d(10, 20, kernel_size=5)
        self.conv2_drop = nn.Dropout2d()
        self.fc1 = nn.Linear(320, 50)
        self.fc2 = nn.Linear(50, 10)

        # Spatial transformer localization-network
        self.localization = nn.Sequential(
            nn.Conv2d(1, 8, kernel_size=7),
            nn.MaxPool2d(2, stride=2),
            nn.ReLU(True),
            nn.Conv2d(8, 10, kernel_size=5),
            nn.MaxPool2d(2, stride=2),
            nn.ReLU(True)
        )

        # Regressor for the 3 * 2 affine matrix
        self.fc_loc = nn.Sequential(
            nn.Linear(10 * 3 * 3, 32),
            nn.ReLU(True),
            nn.Linear(32, 3 * 2)
        )

        # Initialize the weights/bias with identity transformation
        self.fc_loc[2].weight.data.zero_()
        self.fc_loc[2].bias.data.copy_(torch.tensor([1, 0, 0, 0, 1, 0], dtype=torch.float))

    # Spatial transformer network forward function
    def stn(self, x):
        xs = self.localization(x)
        xs = xs.view(-1, 10 * 3 * 3)
        theta = self.fc_loc(xs)
        theta = theta.view(-1, 2, 3)

        grid = F.affine_grid(theta, x.size())
        x = F.grid_sample(x, grid)

        return x

    def forward(self, x):
        # transform the input
        x = self.stn(x)

        # Perform the usual forward pass
        x = F.relu(F.max_pool2d(self.conv1(x), 2))
        x = F.relu(F.max_pool2d(self.conv2_drop(self.conv2(x)), 2))
        x = x.view(-1, 320)
        x = F.relu(self.fc1(x))
        x = F.dropout(x, training=self.training)
        x = self.fc2(x)
        return F.log_softmax(x, dim=1)

model = Net().to(device)
训练模型
现在,让我们使用 SGD 算法来训练模型。网络以监督方式学习分类任务。同时,模型以端到端的方式自动学习 STN。
optimizer = optim.SGD(model.parameters(), lr=0.01)

def train(epoch):
    model.train()
    for batch_idx, (data, target) in enumerate(train_loader):
        data, target = data.to(device), target.to(device)

        optimizer.zero_grad()
        output = model(data)
        loss = F.nll_loss(output, target)
        loss.backward()
        optimizer.step()
        if batch_idx % 500 == 0:
            print('Train Epoch: {} [{}/{} ({:.0f}%)]\tLoss: {:.6f}'.format(
                epoch, batch_idx * len(data), len(train_loader.dataset),
                100. * batch_idx / len(train_loader), loss.item()))
#
# A simple test procedure to measure the STN performances on MNIST.
#

def test():
    with torch.no_grad():
        model.eval()
        test_loss = 0
        correct = 0
        for data, target in test_loader:
            data, target = data.to(device), target.to(device)
            output = model(data)

            # sum up batch loss
            test_loss += F.nll_loss(output, target, size_average=False).item()
            # get the index of the max log-probability
            pred = output.max(1, keepdim=True)[1]
            correct += pred.eq(target.view_as(pred)).sum().item()

        test_loss /= len(test_loader.dataset)
        print('\nTest set: Average loss: {:.4f}, Accuracy: {}/{} ({:.0f}%)\n'
              .format(test_loss, correct, len(test_loader.dataset),
                      100. * correct / len(test_loader.dataset)))
可视化 STN 结果
现在,我们将检查我们学习的视觉注意机制的结果。
我们定义了一个小的辅助函数,以便在训练过程中可视化变换。
def convert_image_np(inp):
  """Convert a Tensor to numpy image."""
    inp = inp.numpy().transpose((1, 2, 0))
    mean = np.array([0.485, 0.456, 0.406])
    std = np.array([0.229, 0.224, 0.225])
    inp = std * inp + mean
    inp = np.clip(inp, 0, 1)
    return inp

# We want to visualize the output of the spatial transformers layer
# after the training, we visualize a batch of input images and
# the corresponding transformed batch using STN.

def visualize_stn():
    with torch.no_grad():
        # Get a batch of training data
        data = next(iter(test_loader))[0].to(device)

        input_tensor = data.cpu()
        transformed_input_tensor = model.stn(data).cpu()

        in_grid = convert_image_np(
            torchvision.utils.make_grid(input_tensor))

        out_grid = convert_image_np(
            torchvision.utils.make_grid(transformed_input_tensor))

        # Plot the results side-by-side
        f, axarr = plt.subplots(1, 2)
        axarr[0].imshow(in_grid)
        axarr[0].set_title('Dataset Images')

        axarr[1].imshow(out_grid)
        axarr[1].set_title('Transformed Images')

for epoch in range(1, 20 + 1):
    train(epoch)
    test()

# Visualize the STN transformation on some input batch
visualize_stn()

plt.ioff()
plt.show()
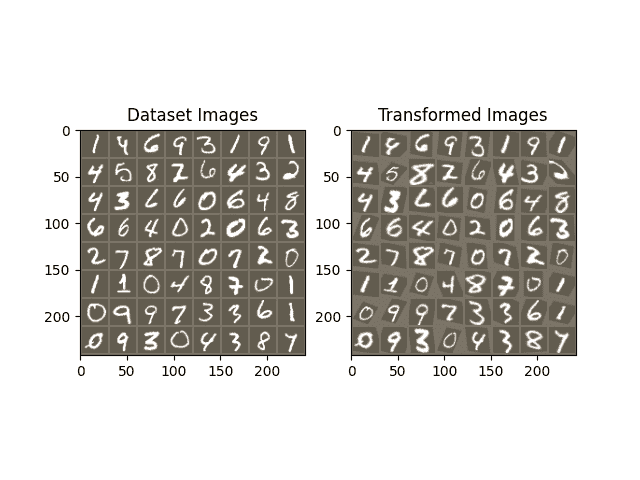
/opt/conda/envs/py_3.10/lib/python3.10/site-packages/torch/nn/functional.py:4377: UserWarning:

Default grid_sample and affine_grid behavior has changed to align_corners=False since 1.3.0\. Please specify align_corners=True if the old behavior is desired. See the documentation of grid_sample for details.

/opt/conda/envs/py_3.10/lib/python3.10/site-packages/torch/nn/functional.py:4316: UserWarning:

Default grid_sample and affine_grid behavior has changed to align_corners=False since 1.3.0\. Please specify align_corners=True if the old behavior is desired. See the documentation of grid_sample for details.

Train Epoch: 1 [0/60000 (0%)]   Loss: 2.315648
Train Epoch: 1 [32000/60000 (53%)]      Loss: 1.051217
/opt/conda/envs/py_3.10/lib/python3.10/site-packages/torch/nn/_reduction.py:42: UserWarning:

size_average and reduce args will be deprecated, please use reduction='sum' instead.

Test set: Average loss: 0.2563, Accuracy: 9282/10000 (93%)

Train Epoch: 2 [0/60000 (0%)]   Loss: 0.544514
Train Epoch: 2 [32000/60000 (53%)]      Loss: 0.312879

Test set: Average loss: 0.1506, Accuracy: 9569/10000 (96%)

Train Epoch: 3 [0/60000 (0%)]   Loss: 0.408838
Train Epoch: 3 [32000/60000 (53%)]      Loss: 0.221301

Test set: Average loss: 0.1207, Accuracy: 9634/10000 (96%)

Train Epoch: 4 [0/60000 (0%)]   Loss: 0.400088
Train Epoch: 4 [32000/60000 (53%)]      Loss: 0.166533

Test set: Average loss: 0.1176, Accuracy: 9634/10000 (96%)

Train Epoch: 5 [0/60000 (0%)]   Loss: 0.274838
Train Epoch: 5 [32000/60000 (53%)]      Loss: 0.223936

Test set: Average loss: 0.2812, Accuracy: 9136/10000 (91%)

Train Epoch: 6 [0/60000 (0%)]   Loss: 0.411823
Train Epoch: 6 [32000/60000 (53%)]      Loss: 0.114000

Test set: Average loss: 0.0697, Accuracy: 9790/10000 (98%)

Train Epoch: 7 [0/60000 (0%)]   Loss: 0.066122
Train Epoch: 7 [32000/60000 (53%)]      Loss: 0.208773

Test set: Average loss: 0.0660, Accuracy: 9799/10000 (98%)

Train Epoch: 8 [0/60000 (0%)]   Loss: 0.201612
Train Epoch: 8 [32000/60000 (53%)]      Loss: 0.081877

Test set: Average loss: 0.0672, Accuracy: 9798/10000 (98%)

Train Epoch: 9 [0/60000 (0%)]   Loss: 0.077046
Train Epoch: 9 [32000/60000 (53%)]      Loss: 0.147858

Test set: Average loss: 0.0645, Accuracy: 9811/10000 (98%)

Train Epoch: 10 [0/60000 (0%)]  Loss: 0.086268
Train Epoch: 10 [32000/60000 (53%)]     Loss: 0.185868

Test set: Average loss: 0.0678, Accuracy: 9794/10000 (98%)

Train Epoch: 11 [0/60000 (0%)]  Loss: 0.138696
Train Epoch: 11 [32000/60000 (53%)]     Loss: 0.119381

Test set: Average loss: 0.0663, Accuracy: 9795/10000 (98%)

Train Epoch: 12 [0/60000 (0%)]  Loss: 0.145220
Train Epoch: 12 [32000/60000 (53%)]     Loss: 0.204023

Test set: Average loss: 0.0592, Accuracy: 9808/10000 (98%)

Train Epoch: 13 [0/60000 (0%)]  Loss: 0.118743
Train Epoch: 13 [32000/60000 (53%)]     Loss: 0.100721

Test set: Average loss: 0.0643, Accuracy: 9801/10000 (98%)

Train Epoch: 14 [0/60000 (0%)]  Loss: 0.066341
Train Epoch: 14 [32000/60000 (53%)]     Loss: 0.107528

Test set: Average loss: 0.0551, Accuracy: 9838/10000 (98%)

Train Epoch: 15 [0/60000 (0%)]  Loss: 0.022679
Train Epoch: 15 [32000/60000 (53%)]     Loss: 0.055676

Test set: Average loss: 0.0474, Accuracy: 9862/10000 (99%)

Train Epoch: 16 [0/60000 (0%)]  Loss: 0.102644
Train Epoch: 16 [32000/60000 (53%)]     Loss: 0.165537

Test set: Average loss: 0.0574, Accuracy: 9839/10000 (98%)

Train Epoch: 17 [0/60000 (0%)]  Loss: 0.280918
Train Epoch: 17 [32000/60000 (53%)]     Loss: 0.206559

Test set: Average loss: 0.0533, Accuracy: 9846/10000 (98%)

Train Epoch: 18 [0/60000 (0%)]  Loss: 0.052316
Train Epoch: 18 [32000/60000 (53%)]     Loss: 0.082710

Test set: Average loss: 0.0484, Accuracy: 9865/10000 (99%)

Train Epoch: 19 [0/60000 (0%)]  Loss: 0.083889
Train Epoch: 19 [32000/60000 (53%)]     Loss: 0.121432

Test set: Average loss: 0.0522, Accuracy: 9839/10000 (98%)

Train Epoch: 20 [0/60000 (0%)]  Loss: 0.067540
Train Epoch: 20 [32000/60000 (53%)]     Loss: 0.024880

Test set: Average loss: 0.0868, Accuracy: 9773/10000 (98%)
脚本的总运行时间:(3 分钟 30.487 秒)
下载 Python 源代码:spatial_transformer_tutorial.py
下载 Jupyter 笔记本:spatial_transformer_tutorial.ipynb
Sphinx-Gallery 生成的画廊
优化用于部署的 Vision Transformer 模型
原文:
pytorch.org/tutorials/beginner/vt_tutorial.html译者:飞龙
协议:CC BY-NC-SA 4.0
注意
点击此处下载完整示例代码
Jeff Tang, Geeta Chauhan
Vision Transformer 模型应用了引入自自然语言处理的最先进的基于注意力的 Transformer 模型,以实现各种最先进(SOTA)结果,用于计算机视觉任务。Facebook Data-efficient Image Transformers DeiT是在 ImageNet 上进行图像分类训练的 Vision Transformer 模型。
在本教程中,我们将首先介绍 DeiT 是什么以及如何使用它,然后逐步介绍脚本化、量化、优化和在 iOS 和 Android 应用程序中使用模型的完整步骤。我们还将比较量化、优化和非量化、非优化模型的性能,并展示在各个步骤中应用量化和优化对模型的好处。
什么是 DeiT
自 2012 年深度学习兴起以来,卷积神经网络(CNNs)一直是图像分类的主要模型,但 CNNs 通常需要数亿张图像进行训练才能实现 SOTA 结果。DeiT 是一个视觉 Transformer 模型,需要更少的数据和计算资源进行训练,以与领先的 CNNs 竞争执行图像分类,这是由 DeiT 的两个关键组件实现的:
-
数据增强模拟在更大数据集上进行训练;
-
原生蒸馏允许 Transformer 网络从 CNN 的输出中学习。
DeiT 表明 Transformer 可以成功应用于计算机视觉任务,且对数据和资源的访问有限。有关 DeiT 的更多详细信息,请参见存储库和论文。
使用 DeiT 对图像进行分类
请按照 DeiT 存储库中的README.md中的详细信息来对图像进行分类,或者进行快速测试,首先安装所需的软件包:
pip install torch torchvision timm pandas requests
要在 Google Colab 中运行,请通过运行以下命令安装依赖项:
!pip install timm pandas requests
然后运行下面的脚本:
from PIL import Image
import torch
import timm
import requests
import torchvision.transforms as transforms
from timm.data.constants import IMAGENET_DEFAULT_MEAN, IMAGENET_DEFAULT_STD

print(torch.__version__)
# should be 1.8.0

model = torch.hub.load('facebookresearch/deit:main', 'deit_base_patch16_224', pretrained=True)
model.eval()

transform = transforms.Compose([
    transforms.Resize(256, interpolation=3),
    transforms.CenterCrop(224),
    transforms.ToTensor(),
    transforms.Normalize(IMAGENET_DEFAULT_MEAN, IMAGENET_DEFAULT_STD),
])

img = Image.open(requests.get("https://raw.githubusercontent.com/pytorch/ios-demo-app/master/HelloWorld/HelloWorld/HelloWorld/image.png", stream=True).raw)
img = transform(img)[None,]
out = model(img)
clsidx = torch.argmax(out)
print(clsidx.item())
2.2.0+cu121
Downloading: "https://github.com/facebookresearch/deit/zipball/main" to /var/lib/jenkins/.cache/torch/hub/main.zip
/var/lib/jenkins/.cache/torch/hub/facebookresearch_deit_main/models.py:63: UserWarning:

Overwriting deit_tiny_patch16_224 in registry with models.deit_tiny_patch16_224\. This is because the name being registered conflicts with an existing name. Please check if this is not expected.

/var/lib/jenkins/.cache/torch/hub/facebookresearch_deit_main/models.py:78: UserWarning:

Overwriting deit_small_patch16_224 in registry with models.deit_small_patch16_224\. This is because the name being registered conflicts with an existing name. Please check if this is not expected.

/var/lib/jenkins/.cache/torch/hub/facebookresearch_deit_main/models.py:93: UserWarning:

Overwriting deit_base_patch16_224 in registry with models.deit_base_patch16_224\. This is because the name being registered conflicts with an existing name. Please check if this is not expected.

/var/lib/jenkins/.cache/torch/hub/facebookresearch_deit_main/models.py:108: UserWarning:

Overwriting deit_tiny_distilled_patch16_224 in registry with models.deit_tiny_distilled_patch16_224\. This is because the name being registered conflicts with an existing name. Please check if this is not expected.

/var/lib/jenkins/.cache/torch/hub/facebookresearch_deit_main/models.py:123: UserWarning:

Overwriting deit_small_distilled_patch16_224 in registry with models.deit_small_distilled_patch16_224\. This is because the name being registered conflicts with an existing name. Please check if this is not expected.

/var/lib/jenkins/.cache/torch/hub/facebookresearch_deit_main/models.py:138: UserWarning:

Overwriting deit_base_distilled_patch16_224 in registry with models.deit_base_distilled_patch16_224\. This is because the name being registered conflicts with an existing name. Please check if this is not expected.

/var/lib/jenkins/.cache/torch/hub/facebookresearch_deit_main/models.py:153: UserWarning:

Overwriting deit_base_patch16_384 in registry with models.deit_base_patch16_384\. This is because the name being registered conflicts with an existing name. Please check if this is not expected.

/var/lib/jenkins/.cache/torch/hub/facebookresearch_deit_main/models.py:168: UserWarning:

Overwriting deit_base_distilled_patch16_384 in registry with models.deit_base_distilled_patch16_384\. This is because the name being registered conflicts with an existing name. Please check if this is not expected.

Downloading: "https://dl.fbaipublicfiles.com/deit/deit_base_patch16_224-b5f2ef4d.pth" to /var/lib/jenkins/.cache/torch/hub/checkpoints/deit_base_patch16_224-b5f2ef4d.pth

  0%|          | 0.00/330M [00:00<?, ?B/s]
  4%|3         | 12.4M/330M [00:00<00:02, 130MB/s]
  7%|7         | 24.7M/330M [00:00<00:02, 110MB/s]
 11%|#1        | 36.8M/330M [00:00<00:02, 117MB/s]
 15%|#4        | 49.2M/330M [00:00<00:02, 121MB/s]
 19%|#8        | 62.2M/330M [00:00<00:02, 127MB/s]
 23%|##3       | 76.7M/330M [00:00<00:01, 135MB/s]
 27%|##7       | 90.6M/330M [00:00<00:01, 139MB/s]
 32%|###1      | 106M/330M [00:00<00:01, 144MB/s]
 36%|###6      | 119M/330M [00:00<00:01, 125MB/s]
 40%|###9      | 132M/330M [00:01<00:01, 122MB/s]
 45%|####4     | 147M/330M [00:01<00:01, 132MB/s]
 49%|####8     | 162M/330M [00:01<00:01, 138MB/s]
 53%|#####3    | 176M/330M [00:01<00:01, 142MB/s]
 58%|#####7    | 190M/330M [00:01<00:01, 144MB/s]
 62%|######2   | 205M/330M [00:01<00:00, 147MB/s]
 67%|######6   | 220M/330M [00:01<00:00, 149MB/s]
 71%|#######   | 234M/330M [00:01<00:00, 148MB/s]
 76%|#######5  | 250M/330M [00:01<00:00, 155MB/s]
 81%|########1 | 268M/330M [00:01<00:00, 162MB/s]
 86%|########6 | 285M/330M [00:02<00:00, 168MB/s]
 91%|#########1| 302M/330M [00:02<00:00, 172MB/s]
 97%|#########6| 319M/330M [00:02<00:00, 175MB/s]
100%|##########| 330M/330M [00:02<00:00, 147MB/s]
269
输出应该是 269,根据 ImageNet 类索引到标签文件,对应timber wolf, grey wolf, gray wolf, Canis lupus。
现在我们已经验证了可以使用 DeiT 模型对图像进行分类,让我们看看如何修改模型以便在 iOS 和 Android 应用程序上运行。
脚本化 DeiT
要在移动设备上使用模型,我们首先需要对模型进行脚本化。查看脚本化和优化配方以获取快速概述。运行下面的代码将 DeiT 模型转换为 TorchScript 格式,以便在移动设备上运行。
model = torch.hub.load('facebookresearch/deit:main', 'deit_base_patch16_224', pretrained=True)
model.eval()
scripted_model = torch.jit.script(model)
scripted_model.save("fbdeit_scripted.pt")
Using cache found in /var/lib/jenkins/.cache/torch/hub/facebookresearch_deit_main
生成的脚本模型文件fbdeit_scripted.pt大小约为 346MB。
量化 DeiT
为了显著减小训练模型的大小,同时保持推理准确性大致相同,可以对模型应用量化。由于 DeiT 中使用的 Transformer 模型,我们可以轻松地将动态量化应用于模型,因为动态量化最适用于 LSTM 和 Transformer 模型(有关更多详细信息,请参见此处)。
现在运行下面的代码:
# Use 'x86' for server inference (the old 'fbgemm' is still available but 'x86' is the recommended default) and ``qnnpack`` for mobile inference.
backend = "x86" # replaced with ``qnnpack`` causing much worse inference speed for quantized model on this notebook
model.qconfig = torch.quantization.get_default_qconfig(backend)
torch.backends.quantized.engine = backend

quantized_model = torch.quantization.quantize_dynamic(model, qconfig_spec={torch.nn.Linear}, dtype=torch.qint8)
scripted_quantized_model = torch.jit.script(quantized_model)
scripted_quantized_model.save("fbdeit_scripted_quantized.pt")
/opt/conda/envs/py_3.10/lib/python3.10/site-packages/torch/ao/quantization/observer.py:220: UserWarning:

Please use quant_min and quant_max to specify the range for observers.                     reduce_range will be deprecated in a future release of PyTorch.
这将生成脚本化和量化版本的模型fbdeit_quantized_scripted.pt,大小约为 89MB,比 346MB 的非量化模型大小减少了 74%!
您可以使用scripted_quantized_model生成相同的推理结果:
out = scripted_quantized_model(img)
clsidx = torch.argmax(out)
print(clsidx.item())
# The same output 269 should be printed
269
优化 DeiT
在将量化和脚本化模型应用于移动设备之前的最后一步是对其进行优化:
from torch.utils.mobile_optimizer import optimize_for_mobile
optimized_scripted_quantized_model = optimize_for_mobile(scripted_quantized_model)
optimized_scripted_quantized_model.save("fbdeit_optimized_scripted_quantized.pt")
生成的fbdeit_optimized_scripted_quantized.pt文件的大小与量化、脚本化但非优化模型的大小大致相同。推理结果保持不变。
out = optimized_scripted_quantized_model(img)
clsidx = torch.argmax(out)
print(clsidx.item())
# Again, the same output 269 should be printed
269
使用 Lite 解释器
要查看 Lite 解释器可以导致多少模型大小减小和推理速度提升,请创建模型的精简版本。
optimized_scripted_quantized_model._save_for_lite_interpreter("fbdeit_optimized_scripted_quantized_lite.ptl")
ptl = torch.jit.load("fbdeit_optimized_scripted_quantized_lite.ptl")
尽管精简模型的大小与非精简版本相当,但在移动设备上运行精简版本时,预计会加快推理速度。
比较推理速度
要查看四个模型的推理速度差异 - 原始模型、脚本模型、量化和脚本模型、优化的量化和脚本模型 - 运行下面的代码:
with torch.autograd.profiler.profile(use_cuda=False) as prof1:
    out = model(img)
with torch.autograd.profiler.profile(use_cuda=False) as prof2:
    out = scripted_model(img)
with torch.autograd.profiler.profile(use_cuda=False) as prof3:
    out = scripted_quantized_model(img)
with torch.autograd.profiler.profile(use_cuda=False) as prof4:
    out = optimized_scripted_quantized_model(img)
with torch.autograd.profiler.profile(use_cuda=False) as prof5:
    out = ptl(img)

print("original model: {:.2f}ms".format(prof1.self_cpu_time_total/1000))
print("scripted model: {:.2f}ms".format(prof2.self_cpu_time_total/1000))
print("scripted & quantized model: {:.2f}ms".format(prof3.self_cpu_time_total/1000))
print("scripted & quantized & optimized model: {:.2f}ms".format(prof4.self_cpu_time_total/1000))
print("lite model: {:.2f}ms".format(prof5.self_cpu_time_total/1000))
original model: 123.27ms
scripted model: 111.89ms
scripted & quantized model: 129.99ms
scripted & quantized & optimized model: 129.94ms
lite model: 120.00ms
在 Google Colab 上运行的结果是:
original  model:  1236.69ms
scripted  model:  1226.72ms
scripted  &  quantized  model:  593.19ms
scripted  &  quantized  &  optimized  model:  598.01ms
lite  model:  600.72ms
以下结果总结了每个模型的推理时间以及相对于原始模型的每个模型的百分比减少。
import pandas as pd
import numpy as np

df = pd.DataFrame({'Model': ['original model','scripted model', 'scripted & quantized model', 'scripted & quantized & optimized model', 'lite model']})
df = pd.concat([df, pd.DataFrame([
    ["{:.2f}ms".format(prof1.self_cpu_time_total/1000), "0%"],
    ["{:.2f}ms".format(prof2.self_cpu_time_total/1000),
     "{:.2f}%".format((prof1.self_cpu_time_total-prof2.self_cpu_time_total)/prof1.self_cpu_time_total*100)],
    ["{:.2f}ms".format(prof3.self_cpu_time_total/1000),
     "{:.2f}%".format((prof1.self_cpu_time_total-prof3.self_cpu_time_total)/prof1.self_cpu_time_total*100)],
    ["{:.2f}ms".format(prof4.self_cpu_time_total/1000),
     "{:.2f}%".format((prof1.self_cpu_time_total-prof4.self_cpu_time_total)/prof1.self_cpu_time_total*100)],
    ["{:.2f}ms".format(prof5.self_cpu_time_total/1000),
     "{:.2f}%".format((prof1.self_cpu_time_total-prof5.self_cpu_time_total)/prof1.self_cpu_time_total*100)]],
    columns=['Inference Time', 'Reduction'])], axis=1)

print(df)

"""
 Model                             Inference Time    Reduction
0   original model                             1236.69ms           0%
1   scripted model                             1226.72ms        0.81%
2   scripted & quantized model                  593.19ms       52.03%
3   scripted & quantized & optimized model      598.01ms       51.64%
4   lite model                                  600.72ms       51.43%
"""
 Model  ... Reduction
0                          original model  ...        0%
1                          scripted model  ...     9.23%
2              scripted & quantized model  ...    -5.45%
3  scripted & quantized & optimized model  ...    -5.41%
4                              lite model  ...     2.65%

[5 rows x 3 columns]

'\n        Model                             Inference Time    Reduction\n0\toriginal model                             1236.69ms           0%\n1\tscripted model                             1226.72ms        0.81%\n2\tscripted & quantized model                  593.19ms       52.03%\n3\tscripted & quantized & optimized model      598.01ms       51.64%\n4\tlite model                                  600.72ms       51.43%\n'
了解更多
-
Facebook 数据高效图像变换器
-
使用 ImageNet 和 MNIST 在 iOS 上的 Vision Transformer
-
使用 ImageNet 和 MNIST 在 Android 上的 Vision Transformer
脚本的总运行时间:(0 分钟 20.779 秒)
下载 Python 源代码:vt_tutorial.py
下载 Jupyter 笔记本:vt_tutorial.ipynb
Sphinx-Gallery 生成的画廊
使用 PyTorch 和 TIAToolbox 进行全幻灯片图像分类
原文:
pytorch.org/tutorials/intermediate/tiatoolbox_tutorial.html译者:飞龙
协议:CC BY-NC-SA 4.0
提示
为了充分利用本教程,我们建议使用这个Colab 版本。这将允许您尝试下面介绍的信息。
介绍
在本教程中,我们将展示如何使用 PyTorch 深度学习模型和 TIAToolbox 来对全幻灯片图像(WSIs)进行分类。WSI 是通过手术或活检拍摄的人体组织样本的图像,并使用专门的扫描仪进行扫描。病理学家和计算病理学研究人员使用它们来研究疾病,如癌症在微观水平上的情况,以便了解肿瘤生长等情况,并帮助改善患者的治疗。
使 WSI 难以处理的是它们的巨大尺寸。例如,典型的幻灯片图像具有100,000x100,000 像素,其中每个像素可能对应于幻灯片上约 0.25x0.25 微米。这在加载和处理这样的图像中带来了挑战,更不用说单个研究中可能有数百甚至数千个 WSI(更大的研究产生更好的结果)!
传统的图像处理流程不适用于 WSI 处理,因此我们需要更好的工具。这就是TIAToolbox可以帮助的地方,它提供了一组有用的工具,以快速和高效地导入和处理组织幻灯片。通常,WSI 以金字塔结构保存,具有多个在各种放大级别上优化可视化的相同图像副本。金字塔的级别 0(或底层)包含具有最高放大倍数或缩放级别的图像,而金字塔中的较高级别具有基础图像的较低分辨率副本。金字塔结构如下所示。
 WSI 金字塔堆栈(来源)
TIAToolbox 允许我们自动化常见的下游分析任务,例如组织分类。在本教程中,我们将展示如何:1. 使用 TIAToolbox 加载 WSI 图像;2. 使用不同的 PyTorch 模型对幻灯片进行补丁级别的分类。在本教程中,我们将提供使用 TorchVision ResNet18模型和自定义 HistoEncoder <github.com/jopo666/HistoEncoder>`__ 模型的示例。
让我们开始吧!
设置环境
要运行本教程中提供的示例,需要以下软件包作为先决条件。
-
OpenJpeg
-
OpenSlide
-
Pixman
-
TIAToolbox
-
HistoEncoder(用于自定义模型示例)
请在终端中运行以下命令以安装这些软件包:
apt-get -y -qq install libopenjp2-7-dev libopenjp2-tools openslide-tools libpixman-1-dev pip install -q ‘tiatoolbox<1.5’ histoencoder && echo “安装完成。”
或者,您可以运行brew install openjpeg openslide在 MacOS 上安装先决条件软件包,而不是apt-get。有关安装的更多信息可以在这里找到。
导入相关库
"""Import modules required to run the Jupyter notebook."""
from __future__ import annotations

# Configure logging
import logging
import warnings
if logging.getLogger().hasHandlers():
    logging.getLogger().handlers.clear()
warnings.filterwarnings("ignore", message=".*The 'nopython' keyword.*")

# Downloading data and files
import shutil
from pathlib import Path
from zipfile import ZipFile

# Data processing and visualization
import matplotlib as mpl
import matplotlib.pyplot as plt
import numpy as np
import pandas as pd
from matplotlib import cm
import PIL
import contextlib
import io
from sklearn.metrics import accuracy_score, confusion_matrix

# TIAToolbox for WSI loading and processing
from tiatoolbox import logger
from tiatoolbox.models.architecture import vanilla
from tiatoolbox.models.engine.patch_predictor import (
    IOPatchPredictorConfig,
    PatchPredictor,
)
from tiatoolbox.utils.misc import download_data, grab_files_from_dir
from tiatoolbox.utils.visualization import overlay_prediction_mask
from tiatoolbox.wsicore.wsireader import WSIReader

# Torch-related
import torch
from torchvision import transforms

# Configure plotting
mpl.rcParams["figure.dpi"] = 160  # for high resolution figure in notebook
mpl.rcParams["figure.facecolor"] = "white"  # To make sure text is visible in dark mode

# If you are not using GPU, change ON_GPU to False
ON_GPU = True

# Function to suppress console output for overly verbose code blocks
def suppress_console_output():
    return contextlib.redirect_stderr(io.StringIO())
运行前清理
为了确保适当的清理(例如在异常终止时),此次运行中下载或创建的所有文件都保存在一个名为global_save_dir的单个目录中,我们将其设置为“./tmp/”。为了简化维护,目录的名称只出现在这一个地方,因此如果需要,可以轻松更改。
warnings.filterwarnings("ignore")
global_save_dir = Path("./tmp/")

def rmdir(dir_path: str | Path) -> None:
  """Helper function to delete directory."""
    if Path(dir_path).is_dir():
        shutil.rmtree(dir_path)
        logger.info("Removing directory %s", dir_path)

rmdir(global_save_dir)  # remove  directory if it exists from previous runs
global_save_dir.mkdir()
logger.info("Creating new directory %s", global_save_dir)
下载数据
对于我们的样本数据,我们将使用一个整个幻灯片图像,以及来自Kather 100k数据集验证子集的补丁。
wsi_path = global_save_dir / "sample_wsi.svs"
patches_path = global_save_dir / "kather100k-validation-sample.zip"
weights_path = global_save_dir / "resnet18-kather100k.pth"

logger.info("Download has started. Please wait...")

# Downloading and unzip a sample whole-slide image
download_data(
    "https://tiatoolbox.dcs.warwick.ac.uk/sample_wsis/TCGA-3L-AA1B-01Z-00-DX1.8923A151-A690-40B7-9E5A-FCBEDFC2394F.svs",
    wsi_path,
)

# Download and unzip a sample of the validation set used to train the Kather 100K dataset
download_data(
    "https://tiatoolbox.dcs.warwick.ac.uk/datasets/kather100k-validation-sample.zip",
    patches_path,
)
with ZipFile(patches_path, "r") as zipfile:
    zipfile.extractall(path=global_save_dir)

# Download pretrained model weights for WSI classification using ResNet18 architecture
download_data(
    "https://tiatoolbox.dcs.warwick.ac.uk/models/pc/resnet18-kather100k.pth",
    weights_path,
)

logger.info("Download is complete.")
读取数据
我们创建一个补丁列表和一个相应标签列表。例如,label_list中的第一个标签将指示patch_list中第一个图像补丁的类。
# Read the patch data and create a list of patches and a list of corresponding labels
dataset_path = global_save_dir / "kather100k-validation-sample"

# Set the path to the dataset
image_ext = ".tif"  # file extension of each image

# Obtain the mapping between the label ID and the class name
label_dict = {
    "BACK": 0, # Background (empty glass region)
    "NORM": 1, # Normal colon mucosa
    "DEB": 2,  # Debris
    "TUM": 3,  # Colorectal adenocarcinoma epithelium
    "ADI": 4,  # Adipose
    "MUC": 5,  # Mucus
    "MUS": 6,  # Smooth muscle
    "STR": 7,  # Cancer-associated stroma
    "LYM": 8,  # Lymphocytes
}

class_names = list(label_dict.keys())
class_labels = list(label_dict.values())

# Generate a list of patches and generate the label from the filename
patch_list = []
label_list = []
for class_name, label in label_dict.items():
    dataset_class_path = dataset_path / class_name
    patch_list_single_class = grab_files_from_dir(
        dataset_class_path,
        file_types="*" + image_ext,
    )
    patch_list.extend(patch_list_single_class)
    label_list.extend([label] * len(patch_list_single_class))

# Show some dataset statistics
plt.bar(class_names, [label_list.count(label) for label in class_labels])
plt.xlabel("Patch types")
plt.ylabel("Number of patches")

# Count the number of examples per class
for class_name, label in label_dict.items():
    logger.info(
        "Class ID: %d -- Class Name: %s -- Number of images: %d",
        label,
        class_name,
        label_list.count(label),
    )

# Overall dataset statistics
logger.info("Total number of patches: %d", (len(patch_list)))
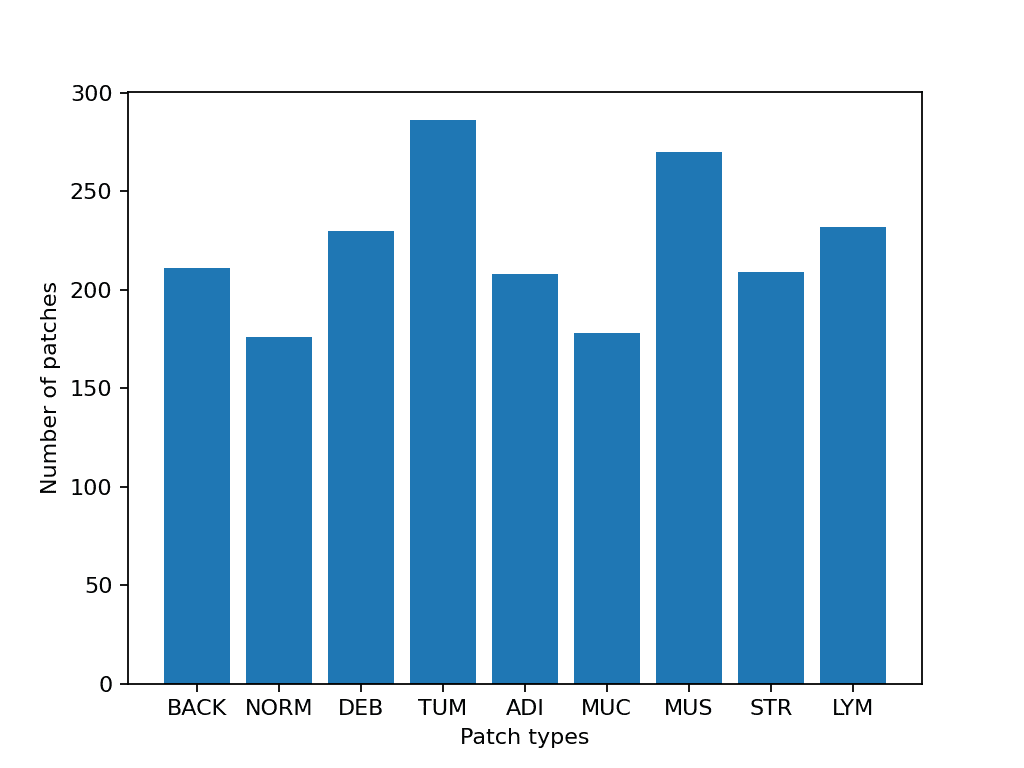
|2023-11-14|13:15:59.299| [INFO] Class ID: 0 -- Class Name: BACK -- Number of images: 211
|2023-11-14|13:15:59.299| [INFO] Class ID: 1 -- Class Name: NORM -- Number of images: 176
|2023-11-14|13:15:59.299| [INFO] Class ID: 2 -- Class Name: DEB -- Number of images: 230
|2023-11-14|13:15:59.299| [INFO] Class ID: 3 -- Class Name: TUM -- Number of images: 286
|2023-11-14|13:15:59.299| [INFO] Class ID: 4 -- Class Name: ADI -- Number of images: 208
|2023-11-14|13:15:59.299| [INFO] Class ID: 5 -- Class Name: MUC -- Number of images: 178
|2023-11-14|13:15:59.299| [INFO] Class ID: 6 -- Class Name: MUS -- Number of images: 270
|2023-11-14|13:15:59.299| [INFO] Class ID: 7 -- Class Name: STR -- Number of images: 209
|2023-11-14|13:15:59.299| [INFO] Class ID: 8 -- Class Name: LYM -- Number of images: 232
|2023-11-14|13:15:59.299| [INFO] Total number of patches: 2000
如您所见,对于这个补丁数据集,我们有 9 个类/标签,ID 为 0-8,并附带类名,描述补丁中的主要组织类型:
-
BACK ⟶ 背景(空玻璃区域)
-
LYM ⟶ 淋巴细胞
-
NORM ⟶ 正常结肠粘膜
-
DEB ⟶ 碎片
-
MUS ⟶ 平滑肌
-
STR ⟶ 癌相关基质
-
ADI ⟶ 脂肪
-
MUC ⟶ 粘液
-
TUM ⟶ 结直肠腺癌上皮
分类图像补丁
我们首先使用patch模式,然后使用wsi模式来为数字切片中的每个补丁获取预测。
定义PatchPredictor模型
PatchPredictor 类运行基于 PyTorch 编写的 CNN 分类器。
-
model可以是任何经过训练的 PyTorch 模型,约束是它应该遵循tiatoolbox.models.abc.ModelABC(文档)<tia-toolbox.readthedocs.io/en/latest/_autosummary/tiatoolbox.models.models_abc.ModelABC.html>__ 类结构。有关此事的更多信息,请参阅[我们关于高级模型技术的示例笔记本](https://github.com/TissueImageAnalytics/tiatoolbox/blob/develop/examples/07-advanced-modeling.ipynb)。为了加载自定义模型,您需要编写一个小的预处理函数,如preproc_func(img)`,确保输入张量的格式适合加载的网络。 -
或者,您可以将
pretrained_model作为字符串参数传递。这指定执行预测的 CNN 模型,必须是这里列出的模型之一。命令将如下:predictor = PatchPredictor(pretrained_model='resnet18-kather100k', pretrained_weights=weights_path, batch_size=32)。 -
pretrained_weights:当使用pretrained_model时,默认情况下也会下载相应的预训练权重。您可以通过pretrained_weight参数使用自己的一组权重覆盖默认设置。 -
batch_size:每次馈送到模型中的图像数量。此参数的较高值需要更大的(GPU)内存容量。
# Importing a pretrained PyTorch model from TIAToolbox
predictor = PatchPredictor(pretrained_model='resnet18-kather100k', batch_size=32)

# Users can load any PyTorch model architecture instead using the following script
model = vanilla.CNNModel(backbone="resnet18", num_classes=9) # Importing model from torchvision.models.resnet18
model.load_state_dict(torch.load(weights_path, map_location="cpu"), strict=True)
def preproc_func(img):
    img = PIL.Image.fromarray(img)
    img = transforms.ToTensor()(img)
    return img.permute(1, 2, 0)
model.preproc_func = preproc_func
predictor = PatchPredictor(model=model, batch_size=32)
预测补丁标签
我们创建一个预测器对象,然后使用patch模式调用predict方法。然后计算分类准确度和混淆矩阵。
with suppress_console_output():
    output = predictor.predict(imgs=patch_list, mode="patch", on_gpu=ON_GPU)

acc = accuracy_score(label_list, output["predictions"])
logger.info("Classification accuracy: %f", acc)

# Creating and visualizing the confusion matrix for patch classification results
conf = confusion_matrix(label_list, output["predictions"], normalize="true")
df_cm = pd.DataFrame(conf, index=class_names, columns=class_names)
df_cm
|2023-11-14|13:16:03.215| [INFO] Classification accuracy: 0.993000
| 背景 | 正常 | 碎片 | 肿瘤 | 脂肪 | 粘液 | 平滑肌 | 结缔组织 | 淋巴 | |
|---|---|---|---|---|---|---|---|---|---|
| BACK | 1.000000 | 0.000000 | 0.000000 | 0.000000 | 0.000000 | 0.000000 | 0.000000 | 0.000000 | 0.00000 |
| NORM | 0.000000 | 0.988636 | 0.000000 | 0.011364 | 0.000000 | 0.000000 | 0.000000 | 0.000000 | 0.00000 |
| DEB | 0.000000 | 0.000000 | 0.991304 | 0.000000 | 0.000000 | 0.000000 | 0.000000 | 0.008696 | 0.00000 |
| TUM | 0.000000 | 0.000000 | 0.000000 | 0.996503 | 0.000000 | 0.003497 | 0.000000 | 0.000000 | 0.00000 |
| ADI | 0.004808 | 0.000000 | 0.000000 | 0.000000 | 0.990385 | 0.000000 | 0.004808 | 0.000000 | 0.00000 |
| MUC | 0.000000 | 0.000000 | 0.000000 | 0.000000 | 0.000000 | 0.988764 | 0.000000 | 0.011236 | 0.00000 |
| MUS | 0.000000 | 0.000000 | 0.000000 | 0.000000 | 0.000000 | 0.000000 | 0.996296 | 0.003704 | 0.00000 |
| STR | 0.000000 | 0.000000 | 0.004785 | 0.000000 | 0.000000 | 0.004785 | 0.004785 | 0.985646 | 0.00000 |
| LYM | 0.000000 | 0.000000 | 0.000000 | 0.000000 | 0.000000 | 0.000000 | 0.000000 | 0.004310 | 0.99569 |
为整个幻灯片预测补丁标签
现在我们介绍IOPatchPredictorConfig,这是一个指定图像读取和预测写入的配置的类,用于模型预测引擎。这是为了通知分类器应该读取 WSI 金字塔的哪个级别,处理数据并生成输出。
IOPatchPredictorConfig的参数定义如下:
-
input_resolutions: 以字典形式的列表,指定每个输入的分辨率。列表元素必须与目标model.forward()中的顺序相同。如果您的模型只接受一个输入,您只需要放置一个指定'units'和'resolution'的字典。请注意,TIAToolbox 支持具有多个输入的模型。有关单位和分辨率的更多信息,请参阅TIAToolbox 文档。 -
patch_input_shape: 最大输入的形状(高度,宽度)格式。 -
stride_shape: 两个连续补丁之间的步幅(步数)的大小,在补丁提取过程中使用。如果用户将stride_shape设置为等于patch_input_shape,则将提取和处理补丁而不会重叠。
wsi_ioconfig = IOPatchPredictorConfig(
    input_resolutions=[{"units": "mpp", "resolution": 0.5}],
    patch_input_shape=[224, 224],
    stride_shape=[224, 224],
)
predict方法将 CNN 应用于输入补丁并获取结果。以下是参数及其描述:
-
mode: 要处理的输入类型。根据您的应用程序选择patch、tile或wsi。 -
imgs: 输入列表,应该是指向输入瓷砖或 WSI 的路径列表。 -
return_probabilities: 设置为True以在输入补丁的预测标签旁获取每个类别的概率。如果您希望合并预测以生成tile或wsi模式的预测地图,可以将return_probabilities=True。 -
ioconfig: 使用IOPatchPredictorConfig类设置 IO 配置信息。 -
resolution和unit(未在下面显示):这些参数指定我们计划从中提取补丁的 WSI 级别的级别或每像素微米分辨率,并可以代替ioconfig。在这里,我们将 WSI 级别指定为'baseline',相当于级别 0。一般来说,这是最高分辨率的级别。在这种特殊情况下,图像只有一个级别。更多信息可以在文档中找到。 -
masks: 与imgs列表中 WSI 的掩模对应的路径列表。这些掩模指定了我们要从原始 WSI 中提取补丁的区域。如果特定 WSI 的掩模指定为None,则将预测该 WSI 的所有补丁的标签(甚至是背景区域)。这可能导致不必要的计算。 -
merge_predictions: 如果需要生成补丁分类结果的二维地图,则可以将此参数设置为True。然而,对于大型 WSI,这将需要大量可用内存。另一种(默认)解决方案是将merge_predictions=False,然后使用稍后将看到的merge_predictions函数生成 2D 预测地图。
由于我们使用了大型 WSI,补丁提取和预测过程可能需要一些时间(如果您可以访问启用了 Cuda 的 GPU 和 PyTorch+Cuda,请确保将ON_GPU=True)。
with suppress_console_output():
    wsi_output = predictor.predict(
        imgs=[wsi_path],
        masks=None,
        mode="wsi",
        merge_predictions=False,
        ioconfig=wsi_ioconfig,
        return_probabilities=True,
        save_dir=global_save_dir / "wsi_predictions",
        on_gpu=ON_GPU,
    )
我们通过可视化wsi_output来查看预测模型在我们的全幻灯片图像上的工作方式。我们首先需要合并补丁预测输出,然后将其可视化为覆盖在原始图像上的叠加图。与之前一样,使用merge_predictions方法来合并补丁预测。在这里,我们设置参数resolution=1.25, units='power'以在 1.25 倍放大率下生成预测地图。如果您想要更高/更低分辨率(更大/更小)的预测地图,您需要相应地更改这些参数。当预测合并完成后,使用overlay_patch_prediction函数将预测地图叠加在 WSI 缩略图上,该缩略图应该以用于预测合并的分辨率提取。
overview_resolution = (
    4  # the resolution in which we desire to merge and visualize the patch predictions
)
# the unit of the `resolution` parameter. Can be "power", "level", "mpp", or "baseline"
overview_unit = "mpp"
wsi = WSIReader.open(wsi_path)
wsi_overview = wsi.slide_thumbnail(resolution=overview_resolution, units=overview_unit)
plt.figure(), plt.imshow(wsi_overview)
plt.axis("off")
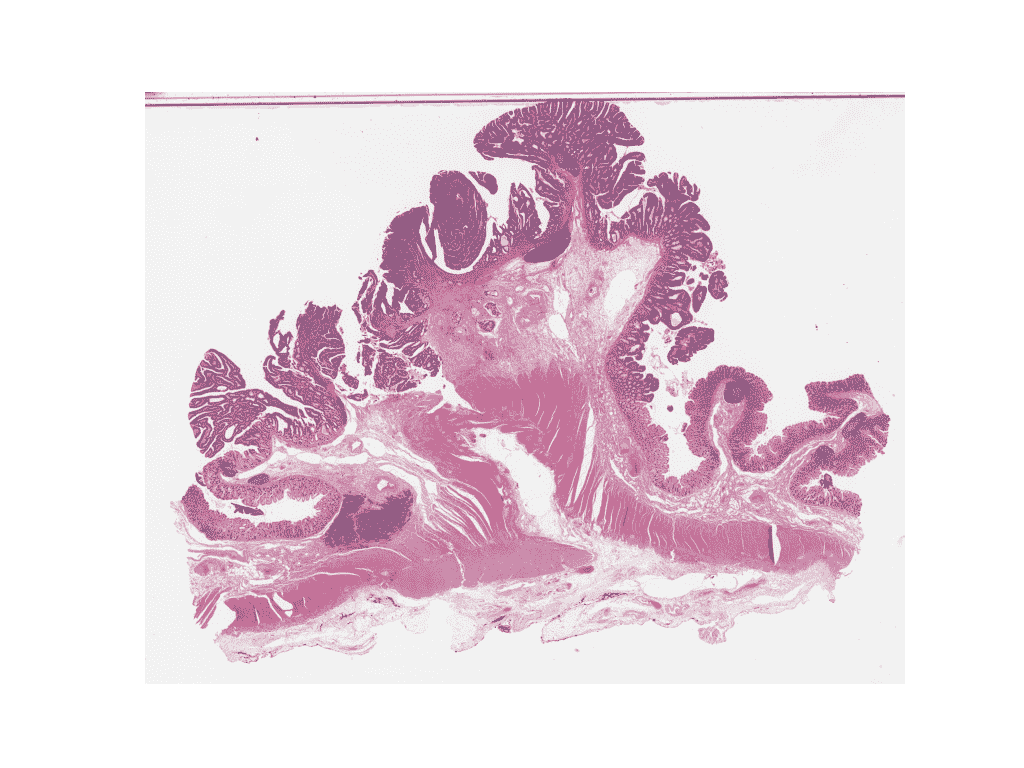
将预测地图叠加在这幅图像上如下所示:
# Visualization of whole-slide image patch-level prediction
# first set up a label to color mapping
label_color_dict = {}
label_color_dict[0] = ("empty", (0, 0, 0))
colors = cm.get_cmap("Set1").colors
for class_name, label in label_dict.items():
    label_color_dict[label + 1] = (class_name, 255 * np.array(colors[label]))

pred_map = predictor.merge_predictions(
    wsi_path,
    wsi_output[0],
    resolution=overview_resolution,
    units=overview_unit,
)
overlay = overlay_prediction_mask(
    wsi_overview,
    pred_map,
    alpha=0.5,
    label_info=label_color_dict,
    return_ax=True,
)
plt.show()
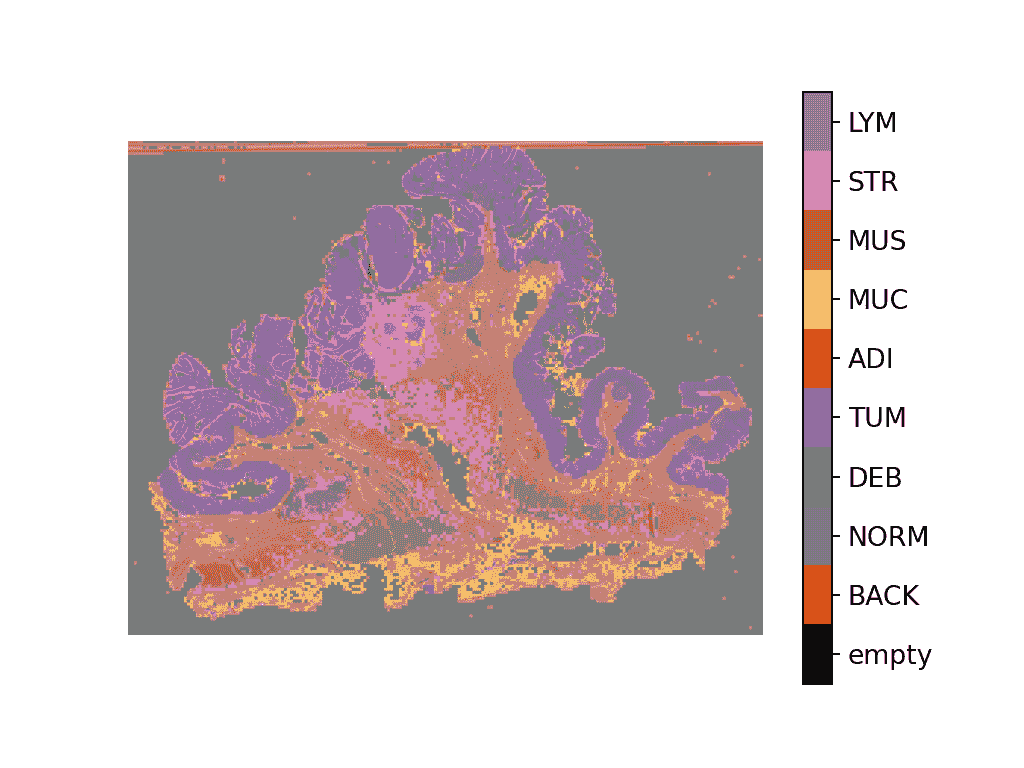
使用专门用于病理学的模型进行特征提取
在本节中,我们将展示如何从 TIAToolbox 之外存在的预训练 PyTorch 模型中提取特征,使用 TIAToolbox 提供的 WSI 推理引擎。为了说明这一点,我们将使用 HistoEncoder,这是一个专门用于计算病理学的模型,已经以自监督的方式进行训练,以从组织学图像中提取特征。该模型已经在这里提供:
‘HistoEncoder: Foundation models for digital pathology’ (github.com/jopo666/HistoEncoder) 由赫尔辛基大学的 Pohjonen, Joona 和团队提供。
我们将绘制一个 3D(RGB)的 UMAP 降维特征图,以可视化特征如何捕捉上述提到的一些组织类型之间的差异。
# Import some extra modules
import histoencoder.functional as F
import torch.nn as nn

from tiatoolbox.models.engine.semantic_segmentor import DeepFeatureExtractor, IOSegmentorConfig
from tiatoolbox.models.models_abc import ModelABC
import umap
TIAToolbox 定义了一个名为 ModelABC 的类,它是一个继承 PyTorch nn.Module的类,并指定了模型应该如何才能在 TIAToolbox 推理引擎中使用。histoencoder 模型不遵循这种结构,因此我们需要将其包装在一个类中,该类的输出和方法是 TIAToolbox 引擎所期望的。
class HistoEncWrapper(ModelABC):
  """Wrapper for HistoEnc model that conforms to tiatoolbox ModelABC interface."""

    def __init__(self: HistoEncWrapper, encoder) -> None:
        super().__init__()
        self.feat_extract = encoder

    def forward(self: HistoEncWrapper, imgs: torch.Tensor) -> torch.Tensor:
  """Pass input data through the model.

 Args:
 imgs (torch.Tensor):
 Model input.

 """
        out = F.extract_features(self.feat_extract, imgs, num_blocks=2, avg_pool=True)
        return out

    @staticmethod
    def infer_batch(
        model: nn.Module,
        batch_data: torch.Tensor,
        *,
        on_gpu: bool,
    ) -> list[np.ndarray]:
  """Run inference on an input batch.

 Contains logic for forward operation as well as i/o aggregation.

 Args:
 model (nn.Module):
 PyTorch defined model.
 batch_data (torch.Tensor):
 A batch of data generated by
 `torch.utils.data.DataLoader`.
 on_gpu (bool):
 Whether to run inference on a GPU.

 """
        img_patches_device = batch_data.to('cuda') if on_gpu else batch_data
        model.eval()
        # Do not compute the gradient (not training)
        with torch.inference_mode():
            output = model(img_patches_device)
        return [output.cpu().numpy()]
现在我们有了我们的包装器,我们将创建我们的特征提取模型,并实例化一个DeepFeatureExtractor以允许我们在 WSI 上使用这个模型。我们将使用与上面相同的 WSI,但这次我们将使用 HistoEncoder 模型从 WSI 的补丁中提取特征,而不是为每个补丁预测某个标签。
# create the model
encoder = F.create_encoder("prostate_medium")
model = HistoEncWrapper(encoder)

# set the pre-processing function
norm=transforms.Normalize(mean=[0.662, 0.446, 0.605],std=[0.169, 0.190, 0.155])
trans = [
    transforms.ToTensor(),
    norm,
]
model.preproc_func = transforms.Compose(trans)

wsi_ioconfig = IOSegmentorConfig(
    input_resolutions=[{"units": "mpp", "resolution": 0.5}],
    patch_input_shape=[224, 224],
    output_resolutions=[{"units": "mpp", "resolution": 0.5}],
    patch_output_shape=[224, 224],
    stride_shape=[224, 224],
)
当我们创建DeepFeatureExtractor时,我们将传递auto_generate_mask=True参数。这将自动使用大津阈值法创建组织区域的掩模,以便提取器仅处理包含组织的那些补丁。
# create the feature extractor and run it on the WSI
extractor = DeepFeatureExtractor(model=model, auto_generate_mask=True, batch_size=32, num_loader_workers=4, num_postproc_workers=4)
with suppress_console_output():
    out = extractor.predict(imgs=[wsi_path], mode="wsi", ioconfig=wsi_ioconfig, save_dir=global_save_dir / "wsi_features",)
这些特征可以用于训练下游模型,但在这里,为了对特征代表的内容有一些直观认识,我们将使用 UMAP 降维来在 RGB 空间中可视化特征。相似颜色标记的点应该具有相似的特征,因此我们可以检查当我们将 UMAP 降维叠加在 WSI 缩略图上时,特征是否自然地分离成不同的组织区域。我们将把它与上面的补丁级别预测地图一起绘制,以查看特征与补丁级别预测的比较。
# First we define a function to calculate the umap reduction
def umap_reducer(x, dims=3, nns=10):
  """UMAP reduction of the input data."""
    reducer = umap.UMAP(n_neighbors=nns, n_components=dims, metric="manhattan", spread=0.5, random_state=2)
    reduced = reducer.fit_transform(x)
    reduced -= reduced.min(axis=0)
    reduced /= reduced.max(axis=0)
    return reduced

# load the features output by our feature extractor
pos = np.load(global_save_dir / "wsi_features" / "0.position.npy")
feats = np.load(global_save_dir / "wsi_features" / "0.features.0.npy")
pos = pos / 8 # as we extracted at 0.5mpp, and we are overlaying on a thumbnail at 4mpp

# reduce the features into 3 dimensional (rgb) space
reduced = umap_reducer(feats)

# plot the prediction map the classifier again
overlay = overlay_prediction_mask(
    wsi_overview,
    pred_map,
    alpha=0.5,
    label_info=label_color_dict,
    return_ax=True,
)

# plot the feature map reduction
plt.figure()
plt.imshow(wsi_overview)
plt.scatter(pos[:,0], pos[:,1], c=reduced, s=1, alpha=0.5)
plt.axis("off")
plt.title("UMAP reduction of HistoEnc features")
plt.show()
我们看到,来自我们的补丁级预测器的预测地图和来自我们的自监督特征编码器的特征地图捕捉了 WSI 中关于组织类型的类似信息。这是一个很好的健全检查,表明我们的模型正在按预期工作。它还显示了 HistoEncoder 模型提取的特征捕捉了组织类型之间的差异,因此它们正在编码组织学相关信息。
下一步去哪里
在这个笔记本中,我们展示了如何使用PatchPredictor和DeepFeatureExtractor类及其predict方法来预测大块瓷砖和 WSI 的补丁的标签,或提取特征。我们介绍了merge_predictions和overlay_prediction_mask辅助函数,这些函数合并了补丁预测输出,并将结果预测地图可视化为覆盖在输入图像/WSI 上的叠加图。
所有过程都在 TIAToolbox 内部进行,我们可以轻松地将各个部分组合在一起,按照我们的示例代码。请确保正确设置输入和选项。我们鼓励您进一步调查更改predict函数参数对预测输出的影响。我们已经演示了如何在 TIAToolbox 框架中使用您自己预训练的模型或研究社区提供的模型来执行对大型 WSI 的推断,即使模型结构未在 TIAToolbox 模型类中定义。
您可以通过以下资源了解更多信息:
-
使用 PyTorch 和 TIAToolbox 进行高级模型处理
-
使用自定义 PyTorch 图神经网络为 WSI 创建幻灯片图



![[技术杂谈]如何下载vscode历史版本](https://img-blog.csdnimg.cn/direct/18e927e78e82496e80649940eb70a716.png)






![[嵌入式AI从0开始到入土]5_炼丹炉的搭建(基于wsl2_Ubuntu22.04)](https://img-blog.csdnimg.cn/direct/971108e55b2f48f0b2802e72653b00e5.png)