数据描述
| 字段名 | 描述 | 字段名 | 描述 |
| id | 蓝莓唯一标识 | MinOfUpperTRange | 花期内最高温带日平均气温的最低记录, |
| Clonesize | 蓝莓克隆平均大小 | AverageOfUpperTRange | 花期内最高温带日平均气温, |
| Honeybee | 蜜蜂密度 | MaxOfLowerTRange | 花期内最低温带日平均气温的最高记录, |
| Bumbles | 大型蜜蜂密度 | MinOfLowerTRange | 花期内最低温带日平均气温的最低记录, |
| Andrena | 安德烈纳蜂密度 | AverageOfLowerTRange | 花期内最低温带日平均气温, |
| Osmia | 钥匙蜂密度 | RainingDays | 花期内降雨量大于0的日数总和, |
| MaxOfUpperTRange | 花期内最高温带日平均气温的最高记录, | AverageRainingDays | 花期内降雨日数的平均值, |
| fruitset | 果实集 | seeds | 种子数 |
| fruitmass | 果实质量 | yield | 产量 |
数据预处理
# 读取数据
train_data <- read.csv("D:\\大三上\\r语言\\期末\\train.csv")
cat('数据集信息:\n')
str(train_data)
summary_data <- as.data.frame(summary(train_data))
summary_data<-t(summary_data)
# 显示数据框
print(summary_data)
summary(train_data)
# 查看各列缺失值
cat('数据集信息缺失情况:\n')
print(colSums(is.na(train_data)))

#将train_data数据集中有缺失数据所在行删掉
train_data<-train_data[complete.cases(train_data$honeybee, train_data$bumbles,train_data$MaxOfUpperTRange,
                                        train_data$MaxOfLowerTRange,train_data$MinOfLowerTRange), , drop = FALSE]
#再次检验缺失值
print(colSums(is.na(train_data)))

# 查看重复值
cat('数据集信息重复情况:\n')
print(sum(duplicated(train_data)))
cat(rep('-', 15), '\n')
set.seed(123)  # Set seed for reproducibility

#install.packages("corrplot")
library(corrplot)
col<-cor(train_data)
# 设置整体图形的大小
par(mar = c(1.2, 1.2, 1.2, 1.2))
corrplot(col, method = "color", addCoef.col = "black", tl.cex = 0.8,number.cex = 0.5)

par(mar = c(3.0,3.0,2.0,2.0))
hist(train_data$AverageOfUpperTRange,freq = FALSE)
lines(density(train_data$AverageOfUpperTRange),col='blue')
rug(jitter(train_data$AverageOfUpperTRange))


# 导入必要的库
library(ggplot2)
# 绘制yield属性的盒图
ggplot(data = train_data, aes(x = yield)) +
  geom_boxplot(fill = "lightblue") +
  geom_boxplot(fill = "blue", outlier.shape = NA, coef = 1.5, width = 0.2) +  # 设置填充颜色为蓝色,移除离群值的标记,调整箱体宽度
  theme_minimal() +
  ggtitle("Boxplot of Yield")+
  theme(plot.title = element_text(hjust = 0.5))
#按数据集的分类特征分布
# 属性分布箱线图
library(reshape2)
# 选择分类特征列
nominal_df <- train_data[, c('MaxOfUpperTRange', 'MinOfUpperTRange', 'AverageOfUpperTRange',
'MaxOfLowerTRange', 'MinOfLowerTRange', 'AverageOfLowerTRange',
'RainingDays', 'AverageRainingDays','yield')]
melted_df <- melt(nominal_df, id.vars = NULL)
# Create boxplot
p <- ggplot(melted_df, aes(x = variable, y = value, fill = as.factor(variable))) +
geom_boxplot(fill="lightblue") +
facet_wrap(~variable, scales = "free") +
theme_minimal() +
labs(x = "", y = "yield")
# Print the plot
print(p)
#数据集中蜜蜂类型的分布
hist_bumbles <- ggplot(train_data, aes(x = bumbles)) +
geom_histogram(fill="green") +
ggtitle("Histogram of bumbles column")
hist_andrena <- ggplot(train_data, aes(x = andrena)) +
geom_histogram(fill="red") +
ggtitle("Histogram of andrena column")
hist_osmia <- ggplot(train_data, aes(x = osmia)) +
geom_histogram(fill="yellow") +
ggtitle("Histogram of osmia column")
hist_clonesize <- ggplot(train_data, aes(x = clonesize)) +
geom_histogram(fill="purple") +
ggtitle("Histogram of clonesize column")
hist_honeybee <- ggplot(train_data, aes(x = honeybee)) +
geom_histogram(fill="pink") +
ggtitle("Histogram of honeybee column")
# Arrange histograms in a grid
grid.arrange(hist_bumbles, hist_andrena, hist_osmia, hist_clonesize, hist_honeybee, ncol = 3)
# 加载 corrplot 库
library(corrplot)
# 画矩阵相关性图
corrplot(col, method = "color", addCoef.col = "black", tl.cex = 0.8, number.cex = 0.5)
# 设置图形边距
par(mar = c(3.0, 3.0, 2.0, 2.0))
# 绘制直方图
hist(train_data$honeybee, freq = FALSE, col = "lightblue", main = "Histogram and Density Plot", breaks = seq(min(train_data$honeybee), max(train_data$honeybee), by = 0.05)
# 绘制核密度估计曲线
lines(density(train_data$honeybee), col = 'blue')
# 调整 jitter 大小,增加数据点密度
rug(jitter(train_data$honeybee, amount = 0.01), col = "darkred", lwd = 1.5)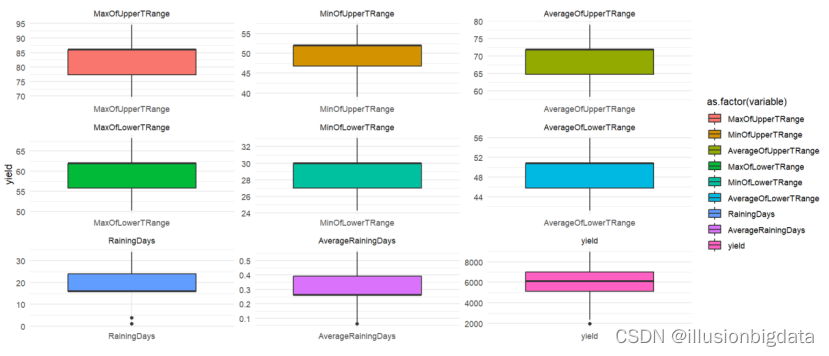

多元线性回归
检测多重线性
# 数据读取
train_data <- read.csv("D:\\学\\R作业\\大作业\\train.csv")
x <- train_data[, !(names(train_data) %in% c("yield"))]

# 计算VIF
lm_model <- lm(x[,1] ~ ., data = x)
vif_result <- car::vif(lm_model)

# 使用 kable 函数美化输出
kable(data.frame(Variable = names(vif_result), VIF = vif_result), format = "html", caption = "VIF Results") %>%
  kable_styling(full_width = FALSE)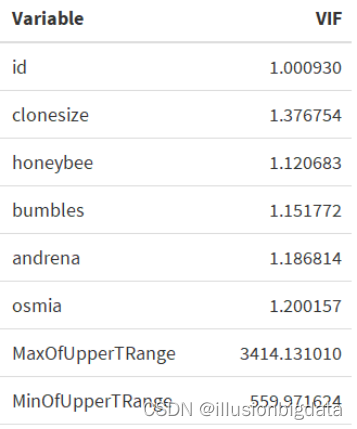
主成分分析
# 进行主成分分析
pca_result <- prcomp(x, scale. = TRUE)

# 计算主成分方差贡献率和累计方差贡献率
variance_contrib <- pca_result$sdev^2 / sum(pca_result$sdev^2)
cumulative_var_contrib <- cumsum(variance_contrib)

# 找到累积方差贡献率达到95%的主成分数量
num_components_95 <- which(cumulative_var_contrib >= 0.95)[1]

# 输出主成分方差贡献率和累计方差贡献率
print(data.frame(
  Principal_Component = 1:length(variance_contrib),
  Variance_Contribution = variance_contrib,
  Cumulative_Variance_Contribution = cumulative_var_contrib
))

# 输出累积方差贡献率达到95%的主成分数量和对应的主成分
cat("Number of components for 95% cumulative variance contribution:", num_components_95, "\n")
cat("Principal components for 95% cumulative variance contribution:", paste(1:num_components_95, collapse = ", "), "\n")
建立多元线性回归模型
# 选择累计方差贡献率达到95%以上的主成分
selected_components <- pca_result$x[, 1:num_components_95]

# 合并主成分和目标变量,并转换为数据框
data_for_regression <- data.frame(cbind(selected_components, yield = train_data$yield))

# 建立多元线性回归模型
linear_model <- lm(yield ~ ., data = data_for_regression)

# 主成分分析摘要
print("Principal Component Analysis:")
kable(data.frame(
  Principal_Component = 1:length(variance_contrib),
  Variance_Contribution = variance_contrib,
  Cumulative_Variance_Contribution = cumulative_var_contrib
), format = "html", caption = "Principal Component Analysis") %>%
  kable_styling(full_width = FALSE)

# 输出主成分方差贡献率达到95%的主成分数量和对应的主成分
cat("\nNumber of components for 95% cumulative variance contribution:", num_components_95, "\n")
cat("Principal components for 95% cumulative variance contribution:", paste(1:num_components_95, collapse = ", "), "\n")

# 多元线性回归模型摘要
print("\nMultiple Linear Regression Model:")
model_summary <- summary(linear_model)

# 使用 kable 函数美化输出
kable(as.data.frame(model_summary$coefficients), format = "html", caption = "Multiple Linear Regression Model") %>%
  kable_styling(full_width = FALSE)

# 计算预测值
predicted_values <- fitted(linear_model)

# 计算残差
residuals <- residuals(linear_model)

# 计算MSE
mse <- mean(residuals^2)

# 计算R-squared
r_squared <- model_summary$r.squared

# 打印MSE和R-squared
cat("Mean Squared Error (MSE):", mse, "\n")
cat("R-squared (R2):", r_squared, "\n")![]()
绘图检验
# 创建散点图(美化版)
scatter_plot <- ggplot(data = data_for_regression, aes(x = yield, y = predicted_values)) +
  geom_point(color = "blue", size = 0.5, alpha = 0.7) +  # 调整颜色、点的大小和透明度
  geom_smooth(method = "lm", se = FALSE, color = "red", linetype = "dashed") +
  labs(title = "Scatter Plot of Predicted vs Actual Yield",
       x = "Actual Yield",
       y = "Predicted Yield") +
  theme_minimal() +  # 使用简洁主题
  theme(legend.position = "none")  # 隐藏图例

# 打印美化散点图
print(scatter_plot)

###残差序列图
代码:
# 计算LOESS平滑曲线
smoothed_residuals <- loess.smooth(fitted(linear_model), residuals, span = 0.8)$y

# 绘制残差序列图(Residuals vs Fitted、Scale-Location、Residuals vs Leverage、Cook's Distance)
par(mfrow = c(2, 2))

# Residuals vs Fitted
plot(fitted(linear_model), residuals, main = "Residuals vs Fitted", xlab = "Fitted Values", ylab = "Residuals", col = "darkgreen", pch = 16, cex = 0.7)
lines(fitted(linear_model), smoothed_residuals, col = "red", lwd = 2)

# Scale-Location
sqrt_abs_residuals <- sqrt(abs(residuals))
plot(fitted(linear_model), sqrt_abs_residuals, main = "Scale-Location", xlab = "Fitted Values", ylab = "sqrt(|Residuals|)", col = "darkblue", pch = 16, cex = 0.7)
lines(fitted(linear_model), loess.smooth(fitted(linear_model), sqrt_abs_residuals, span = 0.8)$y, col = "red", lwd = 2)

# Residuals vs Leverage
plot(hatvalues(linear_model), residuals, main = "Residuals vs Leverage", xlab = "Leverage", ylab = "Residuals", col = "purple", pch = 16, cex = 0.7)
abline(h = 0, col = "red", lty = 2)

# Cook's Distance
cooksd <- cooks.distance(linear_model)
plot(cooksd, pch = "18", main = "Cook's Distance", col = "darkorange", xlab = "Obs Number", ylab = "Cook's distance", cex = 0.7)
abline(h = 4/(length(residuals) - length(coefficients(linear_model))), col = "red", lty = 2)

# 重置绘图参数
par(mfrow = c(1, 1))

###残差直方图

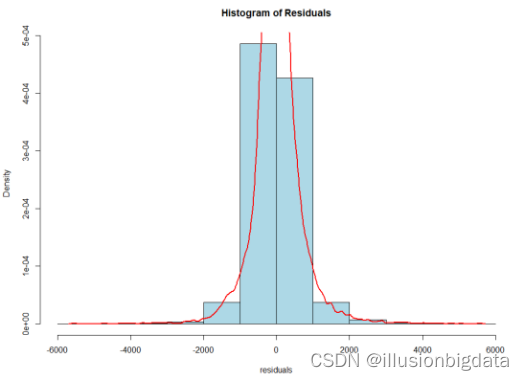
代码:
# 残差的直方图
hist(residuals, main = "Histogram of Residuals", col = "lightblue", border = "black", probability = TRUE)
lines(density(residuals), col = "red", lwd = 2)

###Q-Q图

代码:
# 绘制Q-Q图
qqnorm(residuals, main = "Q-Q Plot of Residuals", col = "blue")
qqline(residuals, col = "red")


###散点图

# 计算 LOESS 平滑曲线(调整 span 参数)
loess_fit <- loess(residuals ~ data_for_regression$yield, span = 0.7)  # 适当调整 span 的值

# 绘制散点图
plot(data_for_regression$yield, residuals, main = "Residuals vs. Actual Values", xlab = "Actual Values", ylab = "Residuals", col = "lightgreen", pch = 16)

# 添加 LOESS 拟合曲线
lines(data_for_regression$yield, predict(loess_fit), col = "red", lwd = 2)

##残差值与预测值

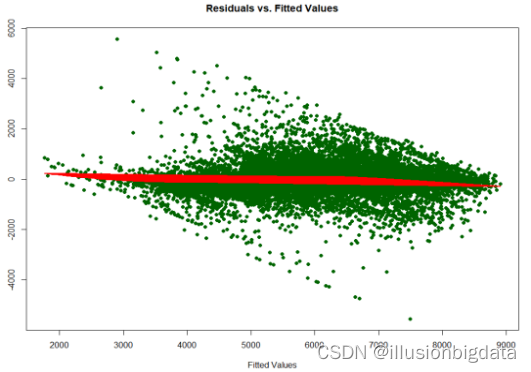
### 残差与预测值的散点图
# 计算LOESS平滑曲线
loess_fit <- loess(residuals ~ fitted(linear_model), span = 0.8)

# 绘制残差与拟合值的散点图
plot(fitted(linear_model), residuals, main = "Residuals vs. Fitted Values", xlab = "Fitted Values", ylab = "Residuals", col = "darkgreen", pch = 16)

# 添加LOESS拟合曲线
lines(fitted(linear_model), predict(loess_fit), col = "red", lwd = 2)

# 重置绘图参数
par(mfrow = c(1, 1))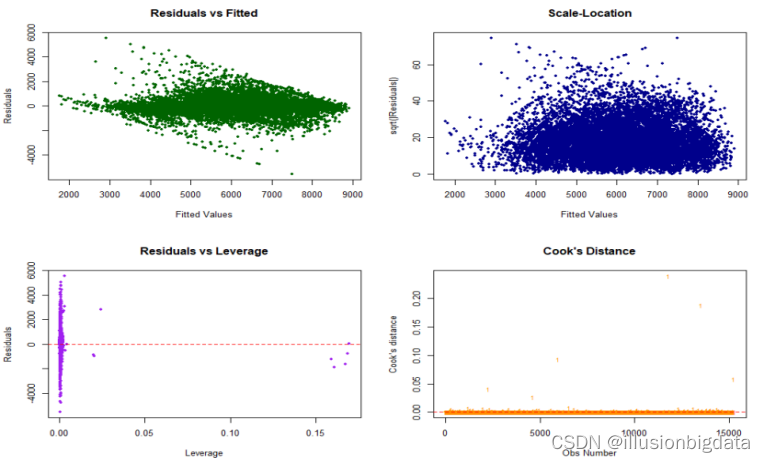


随机森林
x <- train_data[, !(names(train_data) %in% c("yield"))]  # 选择除了"yield"列之外的所有列作为特征
y <- train_data$yield  # "yield"列作为目标变量
library(lattice)
library(caret)
# 使用caret包中的createDataPartition函数划分数据
index <- createDataPartition(y, p = 0.7, list = FALSE)
x_train <- x[index, ]
x_test <- x[-index, ]
y_train <- y[index]
y_test <- y[-index]
library(ranger)
# 模型建立
rf_model <- ranger(y_train ~ ., data = x_train, num.trees = 500)
rf_model <- ranger(y_train ~ ., data = x_train, num.trees = 500, importance = "impurity")

# 预测
y_pred <- predict(rf_model, data = x_test)$predictions
mse <- mean((y_test - y_pred)^2)
r2 <- 1 - mse / var(y_test)

#install.packages("ranger")
library(ranger)
library(caret)
library(lattice)
# 设置随机搜索
# 设置随机搜索
set.seed(17)
rf_grid <- expand.grid(
  mtry = c(1, 17, by=1),
  splitrule = c("variance"),
  min.node.size = c(2, 5, 10)
)

ctrl <- trainControl(method = "cv", number = 15)
rf_search <- train(x_train, y_train, method = "ranger",
                   trControl = ctrl, tuneGrid = rf_grid)
rf_search_model <- rf_search$finalModel

# 获取最佳参数和评分
best_params <- rf_search$bestTune

#install.packages("ggplot2")
library(ggplot2)

# 提取交叉验证结果
cv_results <- rf_search$results
names(cv_results)
# 绘制超参数与性能之间的关系图
ggplot(cv_results, aes(x = mtry, y = RMSE)) +
  geom_point(size = 3) +
  labs(x = "mtry", y = "RMSE",
       title = "Hyperparameter Tuning with Random Forest") +
  theme_minimal()


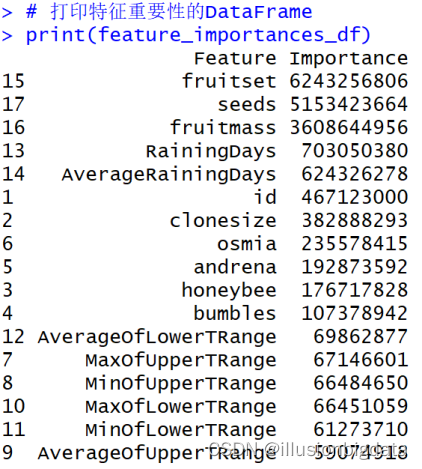
# 获取特征重要性
feature_importances <- ranger::importance(rf_model)

# 将命名向量转换为数据框
feature_importances_df <- data.frame(
  Feature = names(feature_importances),
  Importance = as.numeric(feature_importances)
)

# 按重要性降序排序
feature_importances_df <- feature_importances_df[order(-feature_importances_df$Importance), ]

# 打印特征重要性的DataFrame
print(feature_importances_df)


# 模型建立
rf_model <- ranger(y_train ~ ., data = x_train, num.trees = 500)
rf_model <- ranger(y_train ~ ., data = x_train, num.trees = 500, importance = "impurity")


# 使用训练好的模型对测试数据进行预测
test_data
test_predictions_rf <- predict(rf_model, data = x_test)$predictions


# 计算残差
residuals_rf <- test_predictions_rf - test_data$yield
class(residuals_rf)

mse <- mean((y_test - test_predictions_rf)^2)
r2 <- 1 - mse / var(y_test)

# 检查残差中的空值
missing_residuals <- which(is.na(residuals_rf))

# 移除残差中的空值
clean_residuals <- na.omit(residuals_rf)
# 计算残差的标准差
residual_sd <- sd(clean_residuals)
# 计算残差标准误差
n <- length(clean_residuals)
residual_se <- residual_sd / sqrt(n)

cat("Mean Squared Error (MSE):", mse, "\n")
cat("R-squared (R2):", r2, "\n")
#cat("Residuals:", residuals_rf, "\n")
cat("Residual Standard Error(RSE):", residual_se, "\n")

# 创建包含预测结果的新数据框
rf_test_data_with_predictions <- data.frame(x_test)
rf_test_data_with_predictions$predicted_yield <- test_predictions_rf

# 打印包含预测结果的数据框的前几行
print(head(rf_test_data_with_predictions))
#----------------------------由于randomForest运行时间太久,因此未采用以下代码——————————————————————————#

# 读取数据
train_data <- read.csv("D:\\学\\R作业\\大作业\\train.csv")

train_sub=sample(nrow(train_data),0.7*nrow(train_data))
train_data=train_data[train_sub,]
test_data=train_data[-train_sub,]
#按照7:3划分数据集

n<-length(names(train_data))
#计算数据集中自变量个数
rate=1
#设置模型误判率向量初始值
for(i in 1:(n-1)){
  set.seed(1234)
  rf_train<-randomForest(train_data$Label~.,data=train_data,mtry=i,ntree=1000)
  rate[i]<-mean(rf_train$err.rate)#计算基于OOB数据的模型误判率均值
}
rate
#展示所有模型误判率的均值
plot(rate,type='b',main="不同mtry取值的误判率",
     xlab="n",ylab="err.rate")
mtry <- which.min(rate)
#mtry取误差率最低时的n

set.seed(100)
rf_train<-randomForest(train_data$yield~.,
                       data=train_data,mtry=mtry,
                       ntree=1000)
plot(rf_train, panel.first=grid(10, 10),main="模型误差与ntree关系")
#绘制模型误差与决策树数量关系图
#黑线代表决策树的error,另外两条是bagging后的error
ntree=600

rfm<-randomForest(yield~.,data=train_data,
                  importance=TRUE,proximity=TRUE,
                  mtry=mtry,ntree=ntree)
rfm
#install.packages("caret")
library(ggplot2)
library(lattice)
#install.packages("future.apply")
library(caret)
#install.packages("pROC")
library(pROC) #绘制ROC曲线

rf_test <- predict(rfm,newdata=test_data,type="class")
#在训练集上使用模型
rf_cf <- caret::confusionMatrix(as.factor(rf_test),test_data$yield)
#输出模型的相关评价指标
rf_cf

rf_roc <- roc(test_data$yield,as.numeric(rf_test))
plot(rf_roc, print.auc=TRUE,
     auc.polygon=TRUE, grid=c(0.1, 0.2),
     grid.col="grey", max.auc.polygon=TRUE,
     auc.polygon.col="darkseagreen1", print.thres=TRUE,
     main='随机森林模型ROC曲线,mtry=4,ntree=200')
#绘制roc图

info=rfm$importance
info
varImpPlot(rfm, main = "衡量变量重要性的两个指标")
#MeanDecreaseAccuracy变量替换后随机森林预测准确性的降低程度
#MeanDecreaseGini变量替换后GINI系数(悬殊差距、异质性)的降低程度

data.frame(info)
importance=info[,3]+info[,4]
barplot(importance,cex.lab=0.5,main="各变量的重要性",col="darkseagreen")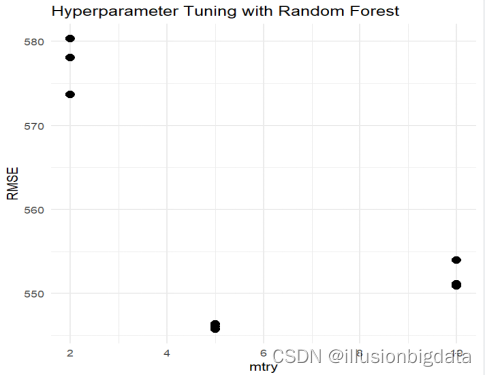


模型对比
| 模型评估指标 | MSE | R2 | RSE |
| 多元线性回归 | 381794.3 | 0.7864212 | 618.3 |
| 随机森林 | 310582.4 | 0.8273324 | 73.02739 |



![OPC UA 开源库编译方法及通过OPC UA连接西门S7-1200 PLC通信并进行数据交换[一]](https://img-blog.csdnimg.cn/direct/ffb2ce87bc27494091f89f1c71236ab2.png)
