一、Prometheus概述
1、Prometheus介绍
- Prometheus 是一个开源的服务监控系统和时序数据库,其提供了通用的数据模型和快捷数据采集、存储和查询接口。它的核心组件Prometheus server会定期从静态配置的监控目标或者基于服务发现自动配置的自标中进行拉取数据,当新拉取到的数据大于配置的内存缓存区时,数据就会持久化到存储设备当中。
- 每个被监控的主机都可以通过专用的exporter 程序提供输出监控数据的接口,它会在目标处收集监控数据,并暴露出一个HTTP接口供Prometheus server查询,Prometheus通过基于HTTP的pull的方式来周期性的采集数据。
- 任何被监控的目标都需要事先纳入到监控系统中才能进行时序数据采集、存储、告警和展示,监控目标可以通过配置信息以静态形式指定,也可以让Prometheus通过服务发现的机制进行动态管理。
2、Prometheus特点
- 多维数据模型:由度量名称和键值对标识的时间序列数据
时序数据,是在一段时间内通过重复测量(measurement)而获得的观测值的集合;将这些观测值绘制于图形之上,它会有一个数据轴和一个时间轴;
服务器指标数据、应用程序性能监控数据、网络数据等也都是时序数据;
- PromQL一种灵活的查询语言,可以利用多维数据完成复杂查询
- 内置时间序列数据库Prometheus;外置的远端存储通常会用:InfluxDB、openTsDB等
- 基于HTTP的pull(拉取)方式采集时间序列数据
- 同时支持PushGateway组件push(推送)方式收集数据
- 通过静态配置或服务发现发现目标
- 支持作为数据源接入Grafana,多种模式的绘图和仪表板支持
3、Prometheus架构
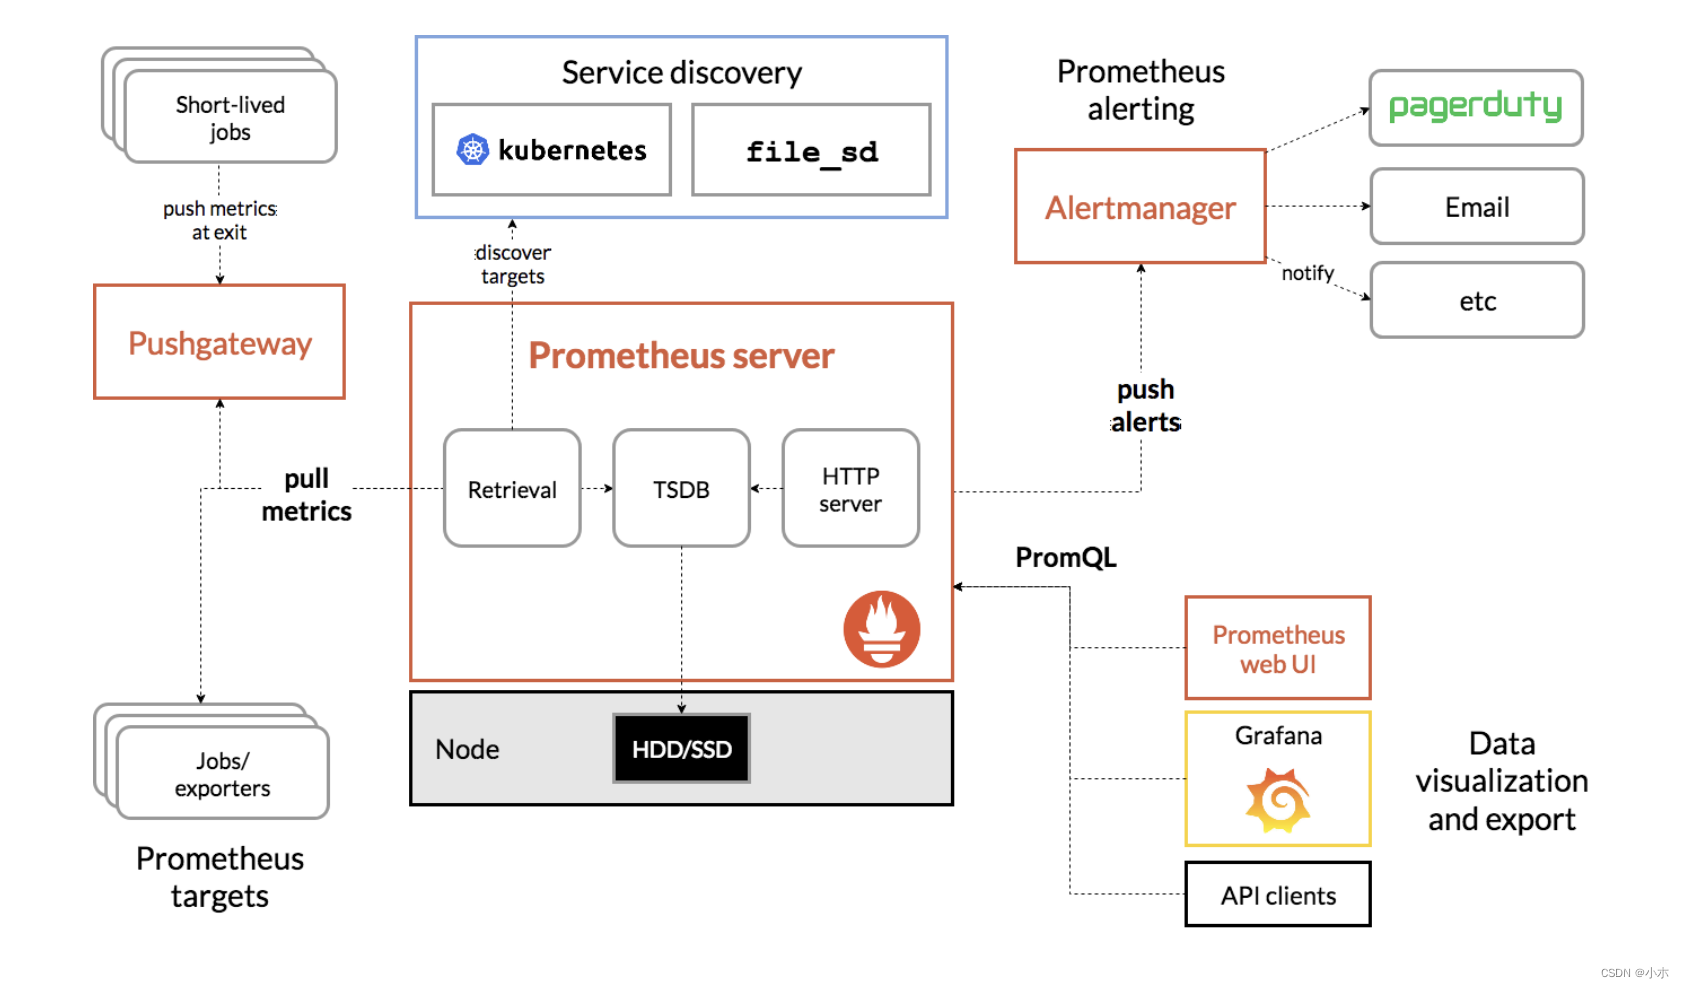
这张图说明了prometheus的架构和一些其生态系统组成:
4、Prometheus生态组件组成
- Prometheus server Prometheus服务器,用于抓取和存储时间序列数据。Prometheus server 由三个部分组成:Retrival,Storage,PromQL
Retrieval:负责在活跃的target 主机上抓取监控指标数据。
Storage:存储,主要是把采集到的数据存储到磁盘中。默认为15天(可修改)。
PromQL:是Prometheus提供的查询语言模块。
- client libraries 客户端库,用于检测应用程序代码的客户端库。目的在于为那些期望原生提供Instrumentation功能的应用程序提供便捷的开发途径。
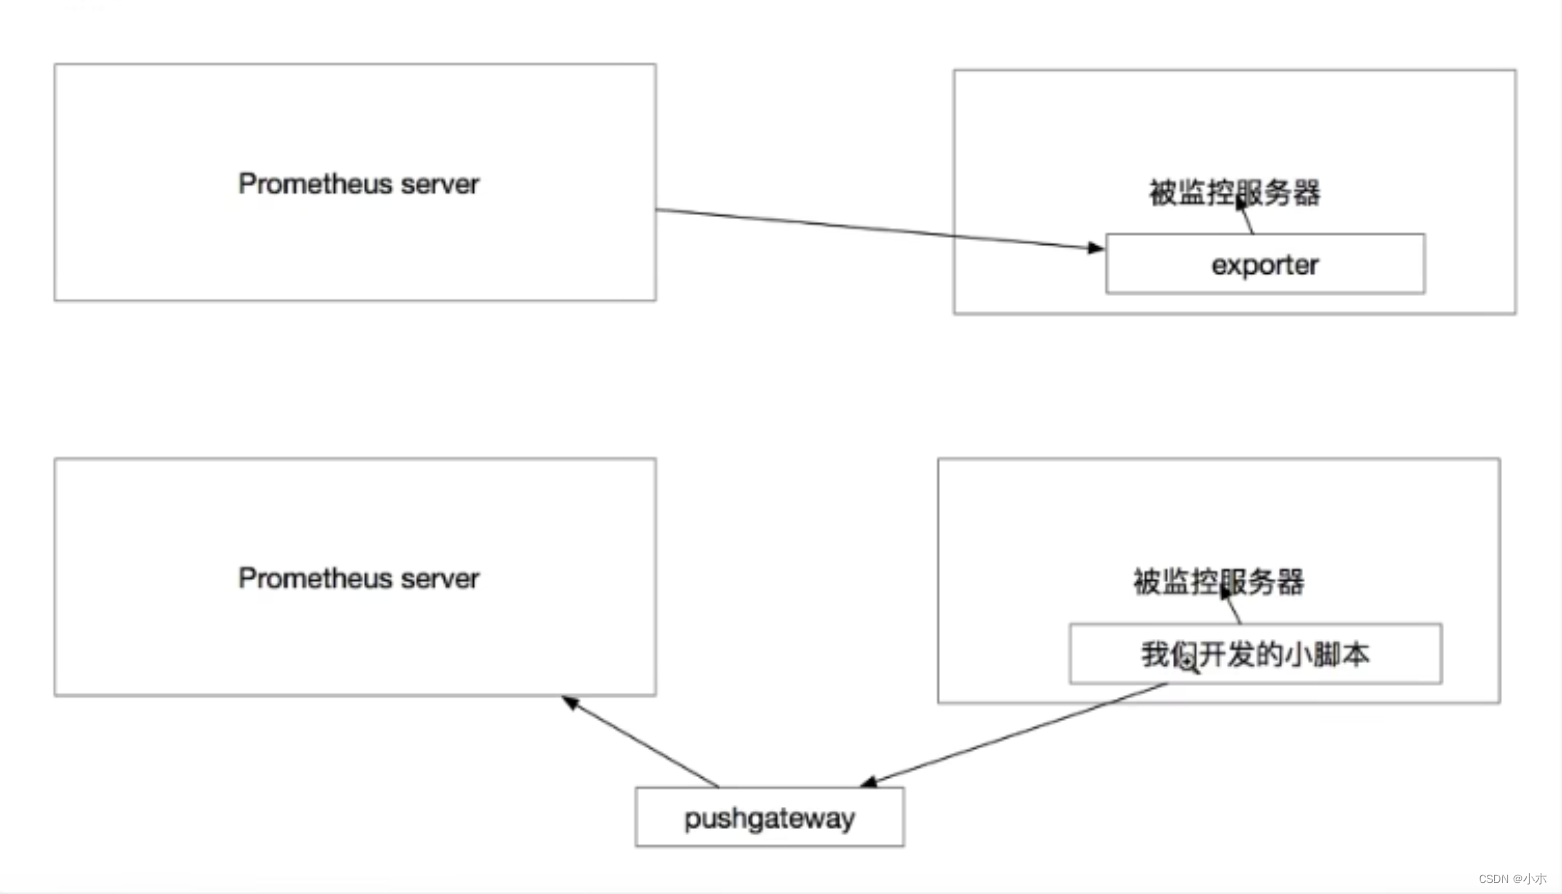
- push gateway 支持短期工作的推送网关。类似一个中转站,可以理解成目标主机可以上报短期任务的数据到Pushgateway,然后Prometheus server 统一从Pushgateway拉取数据。
- exporters 指标暴露器,负责收集不支持内建Instrumentation的应用程序或服务的性能指标数据,并通过HTTP接口供Prometheus Server获取。
- alertmanager 是一个独立的告警模块,从Prometheus server端接收到“告警通知”后,会进行去重、分组,并路由到相应的接收方,发出报警。
- Service Discovery:服务发现,用于动态发现待监控的Target,Prometheus支持多种服务发现机制,例如文件、DNS、Consul、Kubernetes等等。
- Grafana:是一个跨平台的开源的度量分析和可视化工具,可以将采集的数据可视化的展示,并及时通知给告警接收方。其官方库中具有丰富的仪表盘插件。
- various support tools 各种支持工具
注:大多数普罗米修斯组件都是用Go语言编写的,它们很容易作为静态二进制文件构建和部署。
exporter与pushgateway两种监控方式对比:
二、Prometheus配置
1、Prometheus安装
#解压上传后的软件包
[root@localhost opt]# tar xf prometheus-2.35.0.linux-amd64.tar.gz
#移动并命名
[root@localhost opt]# mv prometheus-2.35.0.linux-amd64 /usr/local/prometheus
[root@localhost opt]# cd /usr/local/prometheus
[root@localhost prometheus]# ls
console_libraries  consoles  LICENSE  NOTICE  prometheus  prometheus.yml  promtool
2、编写服务启动文件
vi /usr/lib/systemd/system/prometheus.service[Unit]
Description=Prometheus Server
Documentation=https://prometheus.io/
After=network.target
[Service]
Type=simple
ExecStart=/usr/local/prometheus/prometheus \
--web.listen-address=localhost:9090 \
--storage.tsdb.path="/mnt/data/prometheus" \
--storage.tsdb.retention.time=15d \
--config.file=/usr/local/prometheus/rometheus.yml \
--web.enable-lifecycle
ExecReload=/bin/kill -s HUP $MAINPID
ExecStop=/bin/kill -s QUIT $MAINPID
Restart=on-failure
[Install]
WantedBy=multi-user.target
3、服务启动参数介绍
--config.file=/usr/local/prometheus/prometheus.yml   #指定配置文件
--storage.tsdb.path=/usr/local/prometheus/data/   #数据存储目录
--storage.tsdb.retention.time=15d  #历史数据保存时间,支持:y, w, d, h, m, s, ms
--storage.tsdb.retention.size=512MB  #存储的最大字节数。支持单位为KB, MB, GB, TB, PB, EB
--web.enable-lifecycle  #开启配置文件热加载
--log.level=info  #日志级别,支持debug, info, warn, error
4、Pormetheus配置文件介绍
(1)global
#全局配置 (如果有内部单独设定,会覆盖这个参数)
//scrape_interval
//全局默认的数据拉取间隔
[ scrape_interval: <duration> | default = 1m ]

//scrape_timeout
//全局默认的单次数据拉取超时,当报context deadline exceeded错误时需要在特定的job下配置该字段。
[ scrape_timeout: <duration> | default = 10s ]

//evaluation_interval
//全局默认的规则(主要是报警规则)拉取间隔
[ evaluation_interval: <duration> | default = 1m ]

//external_labels
//该服务端在与其他系统对接所携带的标签
[ <labelname>: <labelvalue> ... ]
(2)alerting
#告警插件定义。与Alertmanager进行对接的配置。
alerting:
  alert_relabel_configs: # 动态修改 alert 属性的规则配置。
    - source_labels: [dc]
      regex: (.+)\d+
      target_label: dc1
  alertmanagers:
    - static_configs:
        - targets: ['127.0.0.1:9093'] # 单实例配置
        #- targets: ['172.31.10.167:19093','172.31.10.167:29093','172.31.10.167:39093'] # 集群配置
    - job_name: 'Alertmanager'
    # metrics_path defaults to '/metrics'
    # scheme defaults to 'http'.
    - static_configs:
      - targets: ['localhost:19093']
(3)rule_files:
#告警规则。 这个主要是用来设置告警规则,基于设定什么指标进行报警(类似触发器trigger)。这里设定好规则以后,prometheus会根据全局global设定的evaluation_interval参数进行扫描加载,规则改动后会自动加载。其报警媒介和route路由由alertmanager插件实现。
# Load rules once and periodically evaluate them according to the global 'evaluation_interval'.
rule_files:
  # - "first_rules.yml"
  # - "second_rules.yml"
first_rules.yml示例:
groups:
 - name: test-rules
   rules:
   - alert: InstanceDown # 告警名称
     expr: up == 0 # 告警的判定条件,参考Prometheus高级查询来设定
     for: 10s # 满足告警条件持续时间多久后,才会发送告警
     labels: #标签项
      severity: error
     annotations: # 解析项,详细解释告警信息
      summary: "{{$labels.instance}}: has been down"
      description: "{{$labels.instance}}: job {{$labels.job}} has been down "
(4)scrape_configs
#采集配置。配置数据源,包含分组job_name以及具体target。又分为静态配置和服务发现。
- job_name: "192.168.111.1"
  static_configs:
    - targets: ["192.168.111.1:8082"]
- job_name: "IPPing"
scrape_interval: 60s
scrape_timeout: 20s
metrics_path: /probe
params:
module: [icmp]
file_sd_configs:
- files:
- /usr/local/prometheus/prometheus/ip.yaml注:job_name 定义job名称,是一个拉取单元。每个job_name都会自动引入默认配置如:
scrape_interval 依赖全局配置
scrape_timeout 依赖全局配置
metrics_path 默认为’/metrics’
scheme 默认为’http’,切换抓取数据所用的协议
# 这些也可以在单独的job中自定义
(5)remote_write:
#用于Prometheus远程存储写配置
url: <string>

[ remote_timeout: <duration> | default = 30s ]

#写入数据时候进行标签过滤
write_relabel_configs:
  [ - <relabel_config> ... ]

basic_auth:
  [ username: <string> ]
  [ password: <string> ]
  [ password_file: <string> ]

[ bearer_token: <string> ]

[ bearer_token_file: /path/to/bearer/token/file ]

tls_config:
  [ <tls_config> ]

[ proxy_url: <string> ]

#远端写细粒度配置,这里暂时仅仅列出官方注释
queue_config:
  # Number of samples to buffer per shard before we start dropping them.
  [ capacity: <int> | default = 10000 ]
  # Maximum number of shards, i.e. amount of concurrency.
  [ max_shards: <int> | default = 1000 ]
  # Maximum number of samples per send.
  [ max_samples_per_send: <int> | default = 100]
  # Maximum time a sample will wait in buffer.
  [ batch_send_deadline: <duration> | default = 5s ]
  # Maximum number of times to retry a batch on recoverable errors.
  [ max_retries: <int> | default = 3 ]
  # Initial retry delay. Gets doubled for every retry.
  [ min_backoff: <duration> | default = 30ms ]
  # Maximum retry delay.
  [ max_backoff: <duration> | default = 100ms ]
(6)remote_read:
#用于Prometheus远程读配置
#远程读取的url
url: <string>

#通过标签来过滤读取的数据
required_matchers:
  [ <labelname>: <labelvalue> ... ]

[ remote_timeout: <duration> | default = 1m ]

#当远端不是存储的时候激活该项
[ read_recent: <boolean> | default = false ]

basic_auth:
  [ username: <string> ]
  [ password: <string> ]
  [ password_file: <string> ]
[ bearer_token: <string> ]
[ bearer_token_file: /path/to/bearer/token/file ]
tls_config:
  [ <tls_config> ]
[ proxy_url: <string> ]
三、Prometheus的服务发现配置
参考官网:Configuration | Prometheus
1、基于文件的服务发现
基于文件的服务发现是仅仅略优于静态配置的服务发现方式,它不依赖于任何平台或第三方服务,因而也是最为简单和通用的实现方式。Prometheus Server 会定期从文件中加载 Target 信息,文件可使用 YAML 和 JSON 格式,它含有定义的 Target 列表,以及可选的标签信息。
创建用于服务发现的文件,在文件中配置所需的 target:
1、
cd /usr/local/prometheus
mkdir targets

vim targets/node-exporter.yaml
- targets:
  - 192.168.109.131:9100
  - 192.168.109.132:9100
  - 192.168.109.133:9100
  labels:
    app: node-exporter
    job: node


2、#修改 prometheus 配置文件,发现 target 的配置,定义在配置文件的 job 之中
vim /usr/local/prometheus/prometheus.yml
......
scrape_configs:
  - job_name: nodes
    file_sd_configs:                  #指定使用文件服务发现
    - files:                          #指定要加载的文件列表
      - targets/node*.yaml            #文件加载支持通配符
      refresh_interval: 2m            #每隔 2 分钟重新加载一次文件中定义的 Targets,默认为 5m
systemctl reload prometheus


3、浏览器查看 Prometheus 页面的 Status -> Targets
2、基于Consul的服务发现
Consul 是一款基于 golang 开发的开源工具,主要面向分布式,服务化的系统提供服务注册、服务发现和配置管理的功能。提供服务注册/发现、健康检查、Key/Value存储、多数据中心和分布式一致性保证等功能。
(1)部署consul服务
cd /opt/
unzip consul_1.9.2_linux_amd64.zip
mv consul /usr/local/bin/

#创建 Consul 服务的数据目录和配置目录
mkdir /var/lib/consul-data
mkdir /etc/consul/

#使用 server 模式启动 Consul 服务
consul agent \
-server \
-bootstrap \
-ui \
-data-dir=/var/lib/consul-data \
-config-dir=/etc/consul/ \
-bind=192.168.109.138 \
-client=0.0.0.0 \
-node=consul-server01 &> /var/log/consul.log &

#查看 consul 集群成员
consul members
(2)在consul上注册services
#在配置目录中添加文件
vim /etc/consul/nodes.json
{
  "services": [
    {
      "id": "node_exporter-node01",
      "name": "node01",
      "address": "192.168.109.138",
      "port": 9100,
      "tags": ["nodes"],
      "checks": [{
        "http": "http://192.168.109.138:9100/metrics",
        "interval": "5s"
      }]
    },
    {
      "id": "node_exporter-node02",
      "name": "node02",
      "address": "192.168.109.134",
      "port": 9100,
      "tags": ["nodes"],
      "checks": [{
        "http": "http://192.168.109.134:9100/metrics",
        "interval": "5s"
      }]
    }
  ]
}

#让 consul 重新加载配置信息
consul reload

浏览器访问:http://192.168.109.138:8500
(3)修改prometheus配置文件
vim /usr/local/prometheus/prometheus.yml
......
  - job_name: nodes
    consul_sd_configs:                  #指定使用 consul 服务发现
    - server: 192.168.109.138:8500        #指定 consul 服务的端点列表
      tags:                             #指定 consul 服务发现的 services 中哪些 service 能够加入到 prometheus 监控的标签
      - nodes
      refresh_interval: 2m


systemctl reload prometheus
浏览器查看 Prometheus 页面的 Status -> Targets

#让 consul 注销 Service
consul services deregister -id="node_exporter-node02"

#重新注册
consul services register /etc/consul/nodes.json
四、部署exporter监控
1、下载安装包解压安装
cd /opt/
tar xf node_exporter-1.3.1.linux-amd64.tar.gz
mv node_exporter-1.3.1.linux-amd64/node_exporter /usr/local/bin
2、配置启动文件并启动exporter服务
cat > /usr/lib/systemd/system/node_exporter.service <<'EOF'
[Unit]
Description=node_exporter
Documentation=https://prometheus.io/
After=network.target

[Service]
Type=simple
ExecStart=/usr/local/bin/node_exporter \
--collector.ntp \
--collector.mountstats \
--collector.systemd \
--collector.tcpstat

ExecReload=/bin/kill -HUP $MAINPID
Restart=on-failure

[Install]
WantedBy=multi-user.target
EOF
3、修改Prometheus配置文件
vim /usr/local/prometheus/prometheus.yml
#在尾部增加如下内容
  - job_name: nodes
    metrics_path: "/metrics"
    static_configs:
    - targets:
	  - 192.168.109.138:9100
	  - 192.168.109.137:9100
	  - 192.168.109.136:9100
      labels:
        service: kubernetes
4、重新加载Prometheus服务
curl -X POST http://192.168.109.138:9090/-/reload     #热加载
或systemctl reload prometheus
浏览器查看 Prometheus 页面的 Status -> Targets
五、部署pushgateway监控
1、下载安装包解压安装
pushgateway可以在任何服务器上部署
cd /usr/local
wget https://github.com/prometheus/pushgateway/releases/download/v1.4.3/pushgateway-1.4.3.linux-amd64.tar.gz
tar -xf pushgateway-1.4.3.linux-amd64.tar.gz
2、编写启动文件
[Unit]
Description=Prometheus pushgateway
Requires=network.target remote-fs.target
After=network.target remote-fs.target

[Service]
Type=simple
User=root
Group=root
ExecStart=/usr/local/pushgateway/pushgateway --persistence.file="/usr/local/pushgateway/data/" --persistence.interval=5m #保存时间5分钟
ExecReload=/bin/kill -HUP $MAINPID
KillMode=process
Restart=on-failure
RestartSec=5s

[Install]
WantedBy=multi-user.target
3、启动服务
默认端口为9091,可通过–web.listen-address更改监听端口
4、prometheus添加配置
vim /usr/local/prometheus/prometheus.yml
  - job_name: 'pushgateway'
    scrape_interval: 30s
    honor_labels: true  #加上此配置exporter节点上传数据中的一些标签将不会被pushgateway节点的相同标签覆盖
    static_configs:
      - targets: ['192.168.1.1:9091']
        labels:
          instance: pushgateway
5、pushgateway数据推送
(1)pushgateway自定义监控项脚本
pushgateway本身没有任何抓取监控数据的功能,它只能被动地等待数据被推送过来,故需要用户自行编写数据采集脚本。
例:采集TCP waiting_connection瞬时数量
1、编写脚本
vi tcp_waiting_connection.sh

#!/bin/bash
# 获取hostname,且host不能为localhost
instance_name=`hostname -f | cut -d '.' -f 1`
if [ $instance_name = "localhost" ];then
  echo "Must FQDN hostname"
  exit 1
fi

# For waiting connections
label="count_netstat_wait_connetions"
count_netstat_wait_connetions=`netstat -an | grep -i wait | wc -l`
echo "$label:$count_netstat_wait_connetions"
echo "$label $count_netstat_wait_connetions" | curl --data-binary @- http://localhost:9091/metrics/job/pushgateway/instance/$instance_name
注:
1)netstat -an | grep -i wait | wc -l该自定义监控的取值方法
2)实际上就是将K/V键值对通过POST方式推送给pushgateway,格式如下:
http://localhost:9091/metrics # pushgateway url
job/pushgateway # 数据推送过去的label,即exported_job=“pushgateway”
instance/$instance_name #数据推送过去的label,instance,即exported_instance=“hsotname”
2、定时执行脚本
crontab -e

* * * * * /app/scripts/pushgateway/tcp_waiting_connection.sh >/dev/null 2>&1
3、Prometheus查看监控数据
promethues可查询监控值count_netstat_wait_connetions
注:prometheus默认每15秒从pushgateway获取一次数据,而cron定时任务最小精度是每分钟执行一次。此时可通过以下方法解决。
方法1:sleep:定义多条定时任务
* * * * * /app/scripts/pushgateway/tcp_waiting_connection.sh >/dev/null 2>&1
* * * * * * sleep 15; /app/scripts/pushgateway/tcp_waiting_connection.sh >/dev/null 2>&1
* * * * * * sleep 30; /app/scripts/pushgateway/tcp_waiting_connection.sh >/dev/null 2>&1
* * * * * * sleep 45; /app/scripts/pushgateway/tcp_waiting_connection.sh >/dev/null 2>&1
方法2:for循环
#!/bin/bash
time=15
for (( i=0; i<60; i=i+time )); do
  instance_name=`hostname -f | cut -d '.' -f 1`
  if [ $instance_name = "localhost" ];then
    echo "Must FQDN hostname"
    exit 1
  fi
  label="count_netstat_wait_connetions"
  count_netstat_wait_connetions=`netstat -an | grep -i wait | wc -l`
  echo "$label:$count_netstat_wait_connetions"
  echo "$label $count_netstat_wait_connetions" | curl --data-binary @- http://localhost:9091/metrics/job/pushgateway/instance/$instance_name

  sleep $time
done
exit 0
此时cron定时任务只需要定义一条:
crontab -e

* * * * * /app/scripts/pushgateway/tcp_waiting_connection.sh >/dev/null 2>&1
(2)Client SDK推送
Prometheus本身提供了支持多种语言的SDK,可通过SDK的方式,生成相关的数据,并推送到pushgateway,这也是官方推荐的方案,详情可参见此链接:https://prometheus.io/docs/instrumenting/clientlibs/。
本示例以python为例,讲解SDK的使用:
from prometheus_client import Counter,Gauge,push_to_gateway
from prometheus_client.core import CollectorRegistry

registry = CollectorRegistry()
data1 = Gauge('gauge_test_metric','This is a gauge-test-metric',['method','path','instance'],registry=registry)
data1.labels(method='get',path='/aaa',instance='instance1').inc(3)

push_to_gateway('10.12.61.3:9091', job='alex-job',registry=registry)


#注解:
#第1、2行代码:引入相关的Prometheus SDK;

#第5行代码:创建相关的指标,类型为Gauge。其中“gauge_test_metric”为指标名称,'This is a gauge-test-metric’为指标注释,[‘method’,‘path’,‘instance’] 为指标相关的label。

#第6行代码:添加相关的label信息和指标value 值。

#第8行代码:push数据到pushgateway,'10.12.61.3:9091’为发送地址,job指定该任务名称。
六、PromQL介绍
1、指标类型
2、表达式函数
参考官网:Query functions | Prometheus
七、AlertManager介绍
八、Grafana介绍(展示+告警)
5、Metrics指标类型:
1、Gauge:
1个简单的返回值,瞬时采集值,没有规律变化的值。(例如CPU使用率、队列数)
2、Counter
计数器,从0开始不断累加计算,正常情况下是只能一直增长,不会降低。(例如累积访问量)
3、Histogram
比例型,近似的百分比估算数值

![[LLM]nanoGPT---训练一个写唐诗的GPT](https://img-blog.csdnimg.cn/direct/d97732b772834f85a0cbc62a71c72464.png)