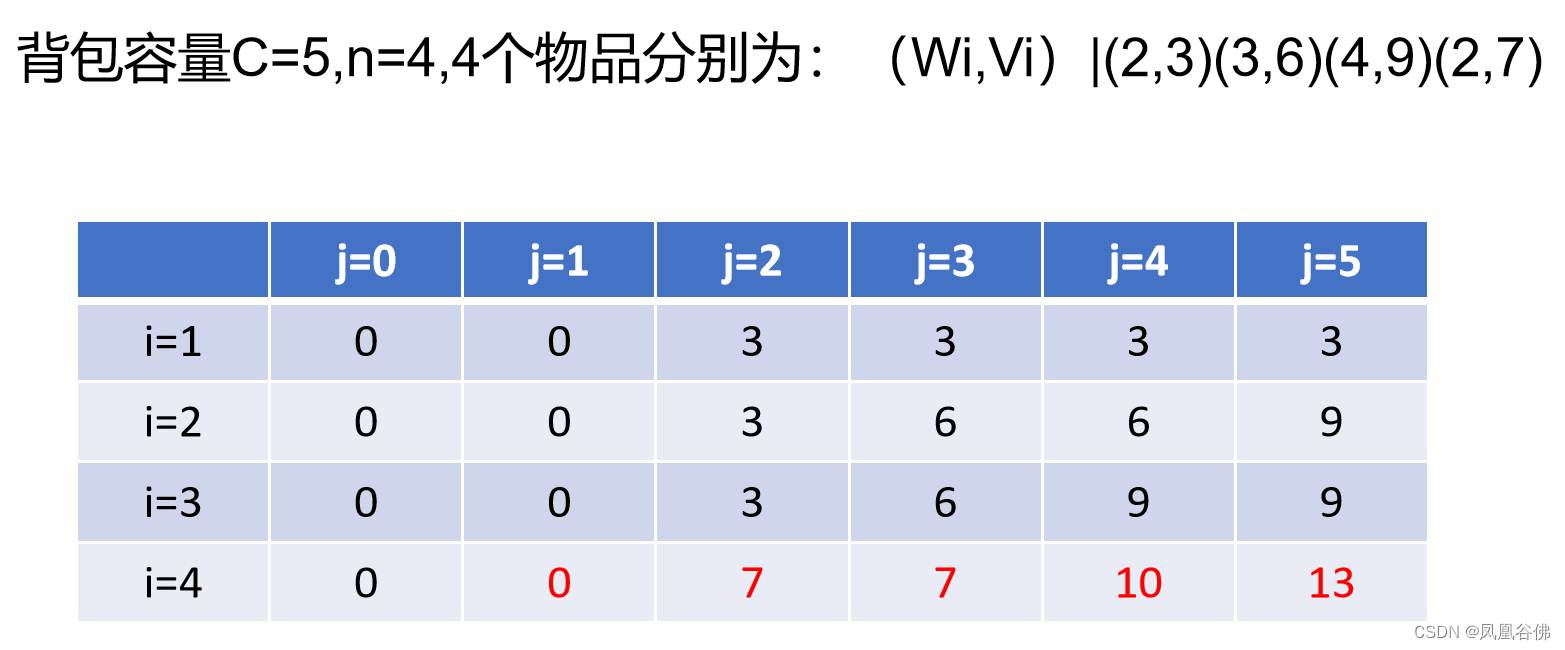
效果图(珙县就是轮播高亮的效果)
思路:初始化一张完整的地图,然后定时器去挨个生成每个县上的地图,并且覆盖在原来的位置,每到一定的时间,就清除之前生成高亮图并且生成下一张高亮图
如何引入地图 上篇文章已详细发过
略
父组件
获取地图的数据,并且在数据中加上color对应的颜色,并且传递给地图渲染的方法。
map是我初始化进来定义的

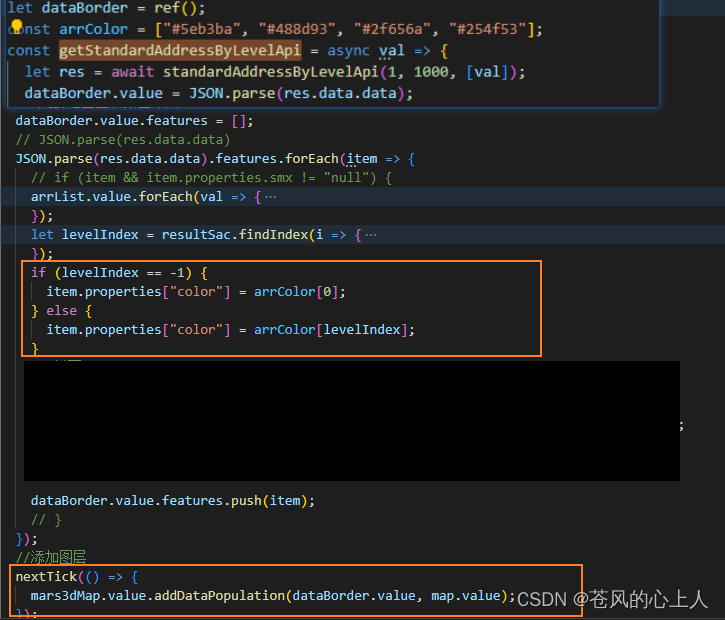
子组件(详情我放在代码的注释中)
// 定义轮播到第几个地图数据
let cyclicNum = ref(0);
// 定时器
let timer = ref();
//  val就是地图的数据  map就是初始化定义的map
const addDataPopulation = (val, map) => {
	// 先清除已经存在再添加
	if (map.getLayerById("childLineLayer")) {
		map.removeLayer(map.getLayerById("childLineLayer"));
	}
	// 清除一下定时器
	if (timer.value) {
		clearInterval(timer.value);
	}
	// 生成最底下的地图
	const childLineLayer = new mars3d.layer.GeoJsonLayer({
		id: "childLineLayer",
		name: "数据总体概览",
		data: val,
		symbol: {
			type: "polygon",
			styleOptions: {
				fill: true,
				// 定义每个区域的颜色
				color: "{color}",
				// 边界
				outline: true,
				outlineStyle: {
					width: 3,
					color: "#fff"
				},
				// 高亮-鼠标移入区块高亮的方式,可以是click 也可以是hover
				highlight: {
					type: "click",
					fill: true,
					color: "#22906a",
					outline: true,
					outlineStyle: {
						width: 8,
						color: "#3ee9d5",
						// 要加高度,不然原地图上的颜色没法覆盖了
						addHeight: 100
					}
				},
				// 名字-区块上显示的名字
				label: {
					text: "{name}",
					font_size: 20,
					font_family: "楷体",
					outline: true,
					outlineColor: "#000",
					outlineWidth: 3,

					background: false,
					backgroundColor: "#fff",
					backgroundOpacity: 0.1,

					font_weight: "normal",
					font_style: "normal",

					scaleByDistance: true,
					scaleByDistance_far: 20000000,
					scaleByDistance_farValue: 0.1,
					scaleByDistance_near: 1000,
					scaleByDistance_nearValue: 1,

					distanceDisplayCondition: false,
					distanceDisplayCondition_far: 10000,
					distanceDisplayCondition_near: 0,
					visibleDepth: false
				}
			}
		}
	});
	map.addLayer(childLineLayer);
	// 下钻聚焦
	childLineLayer.flyTo({
		scale: 1.5
	});
	// 高亮轮播-使用定时器
	timer.value = setInterval(() => {
		cyclicHighlighting(val, map);
	}, 3500);
	// 点击事件-下钻
	childLineLayer.on(mars3d.EventType.dblClick, function (event) {
		if (map.getLayerById("cyclicHighlightingLayer")) {
			map.removeLayer(map.getLayerById("cyclicHighlightingLayer"));
		}
		let req = {
			parentCode: event.graphic.options.attr.adcode,
			name: event.graphic.options.attr.name
		};

		emit("nextLevelFun", req);
	});
	// 绑定事件-点击高亮
	childLineLayer.on(mars3d.EventType.click, function (e) {
		clearInterval(timer.value);
		if (map.getLayerById("cyclicHighlightingLayer")) {
			map.removeLayer(map.getLayerById("cyclicHighlightingLayer"));
		}
		// console.log("鼠标移入", e.propagatedFrom.options.attr);
		emit("highlightingFun", e.propagatedFrom.options.attr);
	});
	// 绑定事件-取消高亮
	childLineLayer.on(mars3d.EventType.highlightClose, function () {
		timer.value = setInterval(() => {
			cyclicHighlighting(val, map);
		}, 3500);
		console.log("鼠标移出");
	});
};

// 循环高亮 val和map 同上
const cyclicHighlighting = (val, map) => {
	// 判断高亮的地图区块是否存在
	if (map.getLayerById("cyclicHighlightingLayer")) {
		map.removeLayer(map.getLayerById("cyclicHighlightingLayer"));
	}
	// 当区块的数据等于长度的时候 表示一轮已经轮播完了,要重头开始轮播
	if (cyclicNum.value >= val.features.length) {
		cyclicNum.value = 0;
	}
	// 生成高亮区块的地图数据
	let dataHighlighting = {
		features: [val.features[cyclicNum.value]],
		type: "FeatureCollection"
	};
	// 我这儿是需要高亮数据做联动,所以返回给父组件,如果没有需要 删除即可
	emit("highlightingFun", val.features[cyclicNum.value].properties);

	cyclicNum.value++;
	const cyclicHighlightingLayer = new mars3d.layer.GeoJsonLayer({
		id: "cyclicHighlightingLayer",
		name: "数据总体概览-单个",
		data: dataHighlighting,
		symbol: {
			// type: "polygon",
			styleOptions: {
				fill: true,
				opacity: 1,
				clampToGround: false,
				outline: true,
				outlineStyle: {
					width: 5,
					color: "#3ee9d5"
				},
				color: "#22906a",
				// 一定要设置高度,不然初始化的地图板块会盖住高亮颜色
				setHeight: 10
			}
		}
	});
	map.addLayer(cyclicHighlightingLayer);
};

