第二章 pandas
一、pandas 介绍
Python Data Analysis Library
pandas 是基于 NumPy 的一种工具,该工具是为了解决数据分析任务而创建的。Pandas 纳入了大量库和一些标准的数据模型,提供了高效地操作大型结构化数据集所需的工具。
二、pandas 核心数据结构
数据结构是计算机存储、组织数据的方式。通常情况下,精心选择的数据结构可以带来更高的运行或者存储效率。数据结构往往同高效的检索算法和索引技术有关。
Series 可以自定义索引的一维数组
DataFrame 可以自定义索引的二维数组
1. Series
Series 可以理解为一个一维的数组,只是 index 名称可以自己改动。类似于定长的有序字典,有 Index 和 value。
import pandas as pd
import numpy as np

# 创建一个空的系列
s = pd.Series()
# 从ndarray创建一个Series
data = np.array(['张三','李四','王五','赵柳'])
s = pd.Series(data)
print(s)
print('-' * 40)
s = pd.Series(data,index=['100','101','102','103'])
print(s)
print('-' * 40)
# 从字典创建一个Series
data = {'100' : '张三', '101' : '李四', '102' : '王五'}
s = pd.Series(data)
print(s)
print('-' * 40)
# 从标量创建一个Series
s = pd.Series(5, index=[0, 1, 2, 3])
print(s)
print('-' * 40)
"""
0    张三
1    李四
2    王五
3    赵柳
dtype: object
----------------------------------------
100    张三
101    李四
102    王五
103    赵柳
dtype: object
----------------------------------------
100    张三
101    李四
102    王五
dtype: object
----------------------------------------
0    5
1    5
2    5
3    5
dtype: int64
----------------------------------------
"""
访问 Series 中的数据:
import pandas as pd
# 使用索引检索元素
s = pd.Series([1,2,3,4,5],index = ['a','b','c','d','e'])
print(s[0], s[:3], s[-3:])
print('-' * 40)
# 使用标签检索数据
print(s['a'], s[['a','c','d']])
print('-' * 40)
"""
1 a    1
b    2
c    3
dtype: int64 c    3
d    4
e    5
dtype: int64
----------------------------------------
1 a    1
c    3
d    4
dtype: int64
----------------------------------------
"""
Series 常用属性:
s1.values  所有的值   返回一个ndarray
s1.index   所有的索引
s1.dtype
s1.size
s1.ndim
s1.shape
2. DataFrame
DataFrame 是一个类似于表格(有行有列)的数据类型,可以理解为一个二维数组,索引有两个维度(行级索引,列级索引),可更改。DataFrame 具有以下特点:
- 列和列之间可以是不同的类型 :不同的列的数据类型可以不同
- 大小可变 (扩容)
- 标记轴(行级索引 和 列级索引)
- 针对行与列进行轴向统计(水平,垂直)
import pandas as pd

# 创建一个空的DataFrame
df = pd.DataFrame()
print(df)

# 从列表创建DataFrame
data = [1,2,3,4,5]
df = pd.DataFrame(data)
print(df)


data = [['Alex',10],['Bob',12],['Clarke',13]]
df = pd.DataFrame(data,columns=['Name','Age'])
print(df)


data = [['Alex',10],['Bob',12],['Clarke',13]]
df = pd.DataFrame(data,columns=['Name','Age'],dtype=float)
print(df)

data = [{'a': 1, 'b': 2},{'a': 5, 'b': 10, 'c': 20}]
df = pd.DataFrame(data)
print(df)

# 从字典来创建DataFrame
data = {'Name':['Tom', 'Jack', 'Steve', 'Ricky'],'Age':[28,34,29,42]}
df = pd.DataFrame(data, index=['s1','s2','s3','s4'])
print(df)

data = {'one' : pd.Series([1, 2, 3], index=['a', 'b', 'c']),
        'two' : pd.Series([1, 2, 3, 4], index=['a', 'b', 'c', 'd'])}
df = pd.DataFrame(data)
print(df)

"""
Empty DataFrame
Columns: []
Index: []
   0
0  1
1  2
2  3
3  4
4  5
     Name  Age
0    Alex   10
1     Bob   12
2  Clarke   13
     Name   Age
0    Alex  10.0
1     Bob  12.0
2  Clarke  13.0
   a   b     c
0  1   2   NaN
1  5  10  20.0
     Name  Age
s1    Tom   28
s2   Jack   34
s3  Steve   29
s4  Ricky   42
   one  two
a  1.0    1
b  2.0    2
c  3.0    3
d  NaN    4
"""
DataFrame 常用属性
| 属性或方法 | 编号 | 描述 |
|---|---|---|
axes | 1 | 返回 行/列 标签(index)列表。 |
columns | 2 | 返回列标签 |
index | 3 | 返回行标签 |
dtypes | 4 | 返回对象的数据类型(dtype)。 |
empty | 5 | 如果系列为空,则返回True。 |
ndim | 6 | 返回底层数据的维数,默认定义:2。 |
size | 7 | 返回基础数据中的元素数。 |
values | 8 | 将系列作为ndarray返回。 |
head(n) | 9 | 返回前n行。 |
tail(n) | 10 | 返回最后n行。 |
实例代码:
import pandas as pd

data = {'Name':['Tom', 'Jack', 'Steve', 'Ricky'],'Age':[28,34,29,42]}
df = pd.DataFrame(data, index=['s1','s2','s3','s4'])
df['score']=pd.Series([90, 80, 70, 60], index=['s1','s2','s3','s4'])
print(df)
print(df.axes)
print(df['Age'].dtype)
print(df.empty)
print(df.ndim)
print(df.size)
print(df.values)
print(df.head(3)) # df的前三行
print(df.tail(3)) # df的后三行
"""
     Name  Age  score
s1    Tom   28     90
s2   Jack   34     80
s3  Steve   29     70
s4  Ricky   42     60
[Index(['s1', 's2', 's3', 's4'], dtype='object'), Index(['Name', 'Age', 'score'], dtype='object')]
int64
False
2
12
[['Tom' 28 90]
 ['Jack' 34 80]
 ['Steve' 29 70]
 ['Ricky' 42 60]]
     Name  Age  score
s1    Tom   28     90
s2   Jack   34     80
s3  Steve   29     70
     Name  Age  score
s2   Jack   34     80
s3  Steve   29     70
s4  Ricky   42     60
"""
3. 核心数据结构操作
CRUD:行和列的增删改查
3.1 列访问
DataFrame 的单列数据为一个 Series。根据 DataFrame 的定义可以 知晓 DataFrame 是一个带有标签的二维数组,每个标签相当每一列的列名。
import pandas as pd

d = {'one' : pd.Series([1, 2, 3], index=['a', 'b', 'c']),
     'two' : pd.Series([1, 2, 3, 4], index=['a', 'b', 'c', 'd']),
     'three' : pd.Series([1, 3, 4], index=['a', 'c', 'd'])}

df = pd.DataFrame(d)

print(df['one'])
print(df[df.columns[:2]])
"""
a    1.0
b    2.0
c    3.0
d    NaN
Name: one, dtype: float64
   one  two
a  1.0    1
b  2.0    2
c  3.0    3
d  NaN    4
"""
3.2 列添加
DataFrame 添加一列的方法非常简单,只需要新建一个列索引。并对该索引下的数据进行赋值操作即可。
import pandas as pd
df['four']=pd.Series([90, 80, 70, 60], index=['a', 'b', 'c', 'd'])
print(df)
# 注意:创建新的列时,要给出原有dataframe的index
"""
one two three four
a 1.0 1 1.0 90
b 2.0 2 NaN 80
c 3.0 3 3.0 70
d NaN 4 4.0 60
"""
3.3 列删除
删除某列数据需要用到 pandas 提供的方法 pop,pop 方法的用法如下:
import pandas as pd
d = {'one' : pd.Series([1, 2, 3], index=['a', 'b', 'c']),
'two' : pd.Series([1, 2, 3, 4], index=['a', 'b', 'c', 'd']),
'three' : pd.Series([10, 20, 30], index=['a', 'b', 'c'])}
df = pd.DataFrame(d)
print("dataframe is:")
print(df)
# 删除一列: one
del(df['one'])
print(df)
#调用pop方法删除一列
df.pop('two')
print(df)
#如果想要删除多列呢?
#删除多列 drop 轴向axis=1是必须给的 默认axis=0删除行的 ,不会修改原数据
# inplace=False 不修改原数据
df2 = df.drop(['one','four'],axis=1,inplace=True)
print(df2)
"""
dataframe is:
one two three
a 1.0 1 10.0
b 2.0 2 20.0
c 3.0 3 30.0
d NaN 4 NaN
two three
a 1 10.0
b 2 20.0
c 3 30.0
d 4 NaN
three
a 10.0
b 20.0
c 30.0
d NaN
None
"""
3.4 行访问
如果只是需要访问 DataFrame 某几行数据的实现方式则采用数组的选取方式,使用 “:” 即可:
import pandas as pd

d = {'one' : pd.Series([1, 2, 3], index=['a', 'b', 'c']),
    'two' : pd.Series([1, 2, 3, 4], index=['a', 'b', 'c', 'd'])}

df = pd.DataFrame(d)
print(df[2:4])
"""
   one  two
c  3.0    3
d  NaN    4
"""
loc是针对 DataFrame 索引名称的切片方法。loc 方法使用方法如下:(只支持索引名称,不支持索引位置)
import pandas as pd

d = {'one' : pd.Series([1, 2, 3], index=['a', 'b', 'c']),
     'two' : pd.Series([1, 2, 3, 4], index=['a', 'b', 'c', 'd'])}

df = pd.DataFrame(d)
print(df.loc['b'])
print(df.loc[['a', 'b']])
"""
one    2.0
two    2.0
Name: b, dtype: float64
   one  two
a  1.0    1
b  2.0    2
"""
iloc和 loc 区别是 iloc 接收的必须是行索引和列索引的位置。iloc 方法的使用方法如下:
import pandas as pd

d = {'one' : pd.Series([1, 2, 3], index=['a', 'b', 'c']),
     'two' : pd.Series([1, 2, 3, 4], index=['a', 'b', 'c', 'd'])}

df = pd.DataFrame(d)
print(df)
print(df.iloc[2])
print(df.iloc[[2, 3]])
"""
   one  two
a  1.0    1
b  2.0    2
c  3.0    3
d  NaN    4
one    3.0
two    3.0
Name: c, dtype: float64
   one  two
c  3.0    3
d  NaN    4
"""
3.5 行添加
import pandas as pd

df = pd.DataFrame([['zs', 12], ['ls', 4]], columns = ['Name','Age'])
df2 = pd.DataFrame([['ww', 16], ['zl', 8]], columns = ['Name','Age'])

df = df.append(df2)
print(df)

"""
  Name  Age
0   zs   12
1   ls    4
0   ww   16
1   zl    8
"""
3.6 行删除
使用索引标签从 DataFrame 中删除或删除行。 如果标签重复,则会删除多行。
import pandas as pd

df = pd.DataFrame([['zs', 12], ['ls', 4]], columns = ['Name','Age'])
df2 = pd.DataFrame([['ww', 16], ['zl', 8]], columns = ['Name','Age'])
df = df.append(df2)
# 删除index为0的行
df = df.drop(0)
print(df)
"""
  Name  Age
1   ls    4
1   zl    8
"""
3.7 修改 DataFrame 中的数据(访问)
更改 DataFrame 中的数据,原理是将这部分数据提取出来,重新赋值为新的数据。
import pandas as pd

df = pd.DataFrame([['zs', 12], ['ls', 4]], columns = ['Name','Age'])
df2 = pd.DataFrame([['ww', 16], ['zl', 8]], columns = ['Name','Age'])
df = df.append(df2)
df['Name'][0] = 'Tom'
print(df)
"""
  Name  Age
0  Tom   12
1   ls    4
0  Tom   16
1   zl    8
"""

#如果想要通过访问数据,赋值修改的话
# 只能采用通过列,找行的方式,因为底层有赋值的过程
# 如果通过行找列,因为底层没有赋值的过程,所以没有效果,不会修改成功
三、数据加载
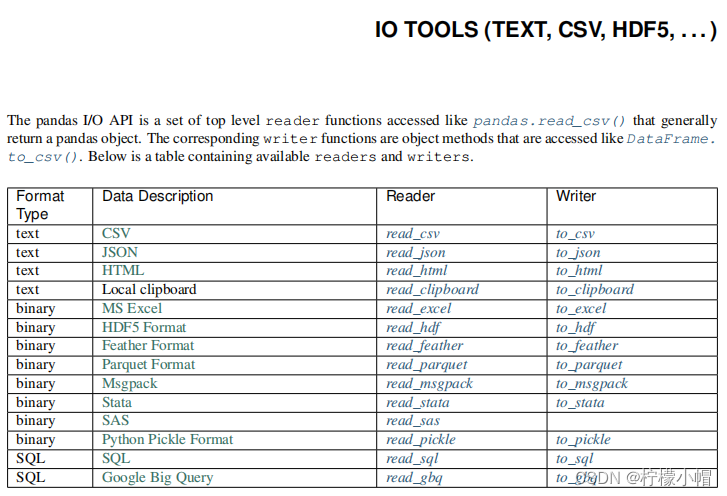
读 HTML 中的内容,要求:在 HTML 中必须要有 table 标签
1. 处理普通文本
1.1 读取文本:read_csv()
csv 文件:逗号分隔符文件,数据与数据之间使用逗号分隔。
| 方法参数 | 参数解释 |
|---|---|
| filepath_or_buffer | 文件路径 |
| sep | 列之间的分隔符。read_csv()默认为为’,’ |
| header | 默认将首行设为列名。header=None时应手动给出列名。 |
| names | header=None时设置此字段使用列表初始化列名。 |
| index_col | 将某一列作为行级索引。若使用列表,则设置复合索引。 |
| usecols | 选择读取文件中的某些列。设置为为相应列的索引列表。 |
| skiprows | 跳过行。可选择跳过前 n 行或给出跳过的行索引列表。 |
| encoding | 编码。 |
根据姓名,性别,学历,工作经验 预测薪资。
1.2 写入文本:dataFrame.to_csv()
| 方法参数 | 参数解释 |
|---|---|
| filepath_or_buffer | 文件路径 |
| sep | 列之间的分隔符。默认为’,’ |
| na_rep | 写入文件时 dataFrame 中缺失值的内容。默认空字符串。 |
| columns | 定义需要写入文件的列。 |
| header | 是否需要写入表头。默认为 True。 |
| index | 会否需要写入行索引。默认为 True。 |
| encoding | 编码。 |
案例:读取电信数据集。
pd.read_csv('../data/CustomerSurvival.csv', header=None, index_col=0)
2. 处理 JSON
2.1 读取 json:read_json()
| 方法参数 | 参数解释 |
|---|---|
| filepath_or_buffer | 文件路径 |
| encoding | 编码。 |
案例:读取电影评分数据:
pd.read_json('../data/ratings.json')
2.2 写入 json:to_json()
| 方法参数 | 参数解释 |
|---|---|
| filepath_or_buffer | 文件路径; 若设置为 None,则返回 json 字符串 |
| orient | 设置面向输出格式:[‘records’, ‘index’, ‘columns’, ‘values’] |
案例:
data = {'Name':['Tom', 'Jack', 'Steve', 'Ricky'],'Age':[28,34,29,42]}
df = pd.DataFrame(data, index=['s1','s2','s3','s4'])
print(df.to_json(orient='records'))
"""
[{"Name":"Tom","Age":28},{"Name":"Jack","Age":34},{"Name":"Steve","Age":29},{"Name":"Ricky","Age":42}]
"""
其他文件读取方法参见:https://www.pypandas.cn/docs/user_guide/io.html
读取 excel 文件内容:read_excel()
四、数值型描述统计
1. 算数平均值
$S = [s_1, s_2, …, s_n] $
样本中的每个值都是真值与误差的和。
m e a n = ( s 1 + s 2 + . . . + s n ) n mean = \frac{(s_1 + s_2 + ... + s_n) }{n} mean=n(s1+s2+...+sn)
算数平均值表示对真值的无偏估计。
m = np.mean(array)
m = array.mean()
m = df.mean(axis=0)
案例:针对电影评分数据做均值分析:
ratings = pd.read_json('./data_test/ratings.json')
print(ratings)
mean = ratings['John Carson'].mean()
print(mean)
mean = np.mean(ratings['John Carson'])
print(mean)
means = ratings.mean(axis=1)
print(means)

"""
                  John Carson  Michelle Peterson  ...  Alex Roberts  Michael Henry
Inception                 2.5                3.0  ...           3.0            NaN
Pulp Fiction              3.5                3.5  ...           4.0            4.5
Anger Management          3.0                1.5  ...           NaN            NaN
Fracture                  3.5                5.0  ...           5.0            4.0
Serendipity               2.5                3.5  ...           3.5            1.0
Jerry Maguire             3.0                3.0  ...           3.0            NaN

[6 rows x 7 columns]
3.0
3.0
Inception           2.800000
Pulp Fiction        3.714286
Anger Management    2.375000
Fracture            4.000000
Serendipity         2.500000
Jerry Maguire       3.416667
dtype: float64
"""
2. 加权平均值
求平均值时,考虑不同样本的重要性,可以为不同的样本赋予不同的权重。
样本: S = [ s 1 , s 2 , s 3 . . . s n ] S = [s_1, s_2, s_3 ... s_n] S=[s1,s2,s3...sn]
权重: W = [ w 1 , w 2 , w 3 . . . w n ] W =[w_1, w_2, w_3 ... w_n] W=[w1,w2,w3...wn]
加权平均值:
a = s 1 w 1 + s 2 w 2 + . . . + s n w n w 1 + w 2 + . . . + w n a = \frac{s_1w_1 + s_2w_2 + ... + s_nw_n}{w_1+w_2+...+w_n} a=w1+w2+...+wns1w1+s2w2+...+snwn
代码实现:
a = np.average(array, weights=volumes)
案例:自定义权重,求加权平均。
import numpy as np
import pandas as pd

ratings = pd.read_json('./data_test/ratings.json')
print(ratings)
# 加权均值
w = np.array([3,1,1,1,1,1,1])
print(w)
print(np.average(ratings.loc['Inception'], weights=w))

mask = ~pd.isna(ratings.loc['Inception'])
print(mask)
print(np.average(ratings.loc['Inception'][mask], weights=w[mask]))

"""
                  John Carson  Michelle Peterson  ...  Alex Roberts  Michael Henry
Inception                 2.5                3.0  ...           3.0            NaN
Pulp Fiction              3.5                3.5  ...           4.0            4.5
Anger Management          3.0                1.5  ...           NaN            NaN
Fracture                  3.5                5.0  ...           5.0            4.0
Serendipity               2.5                3.5  ...           3.5            1.0
Jerry Maguire             3.0                3.0  ...           3.0            NaN

[6 rows x 7 columns]
[3 1 1 1 1 1 1]
nan
John Carson           True
Michelle Peterson     True
William Reynolds      True
Jillian Hobart       False
Melissa Jones         True
Alex Roberts          True
Michael Henry        False
Name: Inception, dtype: bool
2.7142857142857144
"""
3. 最值
np.max() / np.min() / np.ptp(): 返回一个数组中最大值/最小值/极差(最大值减最小值)
import numpy as np
# 产生9个介于[10, 100)区间的随机数
a = np.random.randint(10, 100, 9)
print(a)
print(np.max(a), np.min(a), np.ptp(a))
"""
[19 36 15 53 22 48 13 77 36]
77 13 64
"""
np.argmax() np.argmin(): 返回一个数组中最大/最小元素的下标
import numpy as np
import pandas as pd
# 产生9个介于[10, 100)区间的随机数
a = np.random.randint(10, 100, 9)
print(a)
print(np.max(a), np.min(a), np.ptp(a))
# 在np中,使用argmax获取到最大值的下标
print(np.argmax(a), np.argmin(a))

series = pd.Series(a)
# 在pandas中,使用idxmax获取到最大值的下标
print(series.idxmax(), series.idxmin())
dataframe = pd.DataFrame(a)
print(dataframe.idxmax(), dataframe.idxmin())

"""
[80 28 82 38 26 85 37 34 14]
85 14 71
5 8
5 8
0    5
dtype: int64 0    8
dtype: int64
"""
np.maximum() np.minimum(): 将两个同维数组中对应元素中最大/最小元素构成一个新的数组
print(np.maximum(a, b), np.minimum(a, b), sep='\n')
[1 2 3 4 5 6 7 8 9]
[9 8 7 6 5 4 3 2 1]
[9 8 7 6 5 6 7 8 9]
[1 2 3 4 5 4 3 2 1]
4. 中位数
将多个样本按照大小排序,取中间位置的元素。
-
若样本数量为奇数,中位数为最中间的元素
- [ 1 , 2000 , 3000 , 4000 , 10000000 ] [1, 2000, 3000, 4000, 10000000] [1,2000,3000,4000,10000000]
-
若样本数量为偶数,中位数为最中间的两个元素的平均值
- [ 1 , 2000 , 3000 , 4000 , 5000 , 10000000 ] [1,2000,3000,4000,5000,10000000] [1,2000,3000,4000,5000,10000000]
案例:分析中位数的算法,测试 numpy 提供的中位数 API:
import numpy as np
closing_prices = np.loadtxt('./data_test/aapl.csv',
	delimiter=',', usecols=(6), unpack=True)
size = closing_prices.size
sorted_prices = np.msort(closing_prices)
median = (sorted_prices[int((size - 1) / 2)] +
          sorted_prices[int(size / 2)]) / 2
print(median)
median = np.median(closing_prices)
print(median)
"""
352.055
352.055
"""
5. 标准差
样本(sample):
S = [ s 1 , s 2 , s 3 , . . . , s n ] S = [s_1, s_2, s_3, ..., s_n] S=[s1,s2,s3,...,sn]
平均值:
m = s 1 + s 2 + s 3 + . . . + s n n m = \frac{s_1 + s_2 + s_3 + ... + s_n}{n} m=ns1+s2+s3+...+sn
离差(deviation):表示某组数据距离某个中心点的偏离程度
D = [ d 1 , d 2 , d 3 , . . . , d n ] d i = S i − m D = [d_1, d_2, d_3, ..., d_n]\\ d_i = S_i-m D=[d1,d2,d3,...,dn]di=Si−m
离差方:
Q = [ q 1 , q 2 , q 3 , . . . , q n ] q i = d i 2 Q = [q_1, q_2, q_3, ..., q_n]\\ q_i=d_i^2 Q=[q1,q2,q3,...,qn]qi=di2
总体方差(variance):
v = ( q 1 + q 2 + q 3 + . . . + q n ) n v = \frac{(q_1+q_2+q_3 + ... + q_n)}{n} v=n(q1+q2+q3+...+qn)
- 最整组离差方 , /n 得到离差的均值,为方差
- 方差越大,震荡越剧烈
- 方差越小,震荡越平缓
总体标准差(standard deviation):
s = v s = \sqrt{v} s=v
样本方差:
v ′ = ( q 1 + q 2 + q 3 + . . . + q n ) n − 1 , v = ( q 1 + q 2 + q 3 + . . . + q n ) n v' = \frac{(q_1+q_2+q_3 + ... + q_n)}{n-1} , v = \frac{(q_1+q_2+q_3 + ... + q_n)}{n} v′=n−1(q1+q2+q3+...+qn),v=n(q1+q2+q3+...+qn)
其中,n-1 称之为“贝塞尔校正”,这是因为抽取样本时候,采集的样本主要是落在中心值附近,那么通过这些样本计算的方差会小于等于对总体数据集方差的无偏估计值。为了能弥补这方面的缺陷,那么我们把公式的 n 改为 n-1,以此来提高方差的数值。称为贝塞尔校正系数。
样本标准差:
s ′ = v ′ s' = \sqrt{v'} s′=v′
案例: 根据标准差理论,针对评分数据进行方差分析:
print(ratings.std(axis=0))
"""
John Carson          0.447214
Michelle Peterson    1.129159
William Reynolds     0.645497
Jillian Hobart       0.790569
Melissa Jones        0.752773
Alex Roberts         0.836660
Michael Henry        1.892969
dtype: float64
"""


