Spatial Data Analysis(三):点模式分析
---- 1853年伦敦霍乱爆发
在此示例中,我将演示如何使用 John Snow 博士的经典霍乱地图在 Python 中执行 KDE 分析和距离函数。
感谢 Robin Wilson 将所有数据数字化并将其转换为友好的 GIS 格式。 原始数据从这里获得:
http://blog.rtwilson.com/john-snows-known-cholera-analysis-data-in-modern-gis-formats/
具体来说,我们需要这些包来进行分析:
rasterio:这是一个用于在 python 中处理栅格数据的包。 我们不使用栅格,但在这里使用它的原因是显示 GeoTiff 图像作为底图,该图像经过校正以与 GIS shapefile 对齐。seaborn:这实际上是一个可视化包; 但是,它们确实具有可用于二维空间数据的 KDE 功能。pointpats:这是一个用于进行 PPA 和最近邻分析的软件包。 我们需要用它来计算例如 G距离函数。
步骤1
导入所有需要的包
import geopandas as gpd
import rasterio
from rasterio.plot import show
import seaborn as sns
import numpy as np
import matplotlib.pyplot as plt
from pointpats import distance_statistics as stats
from pointpats import PointPattern, PoissonPointProcess
第2步
读入两个 shapefile:
- SnowGIS/Cholera_Deaths.shp 是一个包含所有死亡和位置的点形状文件
- SnowGIS/Pumps.shp 是包含所有泵的点形状文件
由于它们都是 shapefile,一旦我们使用“gpd.read_file()”将它们读入 python,我们就得到了 GeoDataFrame。
cases = gpd.read_file("https://raw.githubusercontent.com/Ziqi-Li/GEO4162C/main/data/SnowGIS/Cholera_Deaths.shp")

pump = gpd.read_file("https://raw.githubusercontent.com/Ziqi-Li/GEO4162C/main/data/SnowGIS/Pumps.shp")
在我们进行下一步操作之前,最好先检查数据。 例如,您需要执行以下操作:
- 1.查看数据表,了解GeoDataFrame中的属性
- 2.检查几何图形,看看是否可以绘制它们
- 3.检查您读入的shapefile是否具有相同的
crs
cases.head() #This returns you the first 5 rows in the GeoDataFrame
| Id | Count | geometry | |
|---|---|---|---|
| 0 | 0 | 3 | POINT (529308.741 181031.352) |
| 1 | 0 | 2 | POINT (529312.164 181025.172) |
| 2 | 0 | 1 | POINT (529314.382 181020.294) |
| 3 | 0 | 1 | POINT (529317.380 181014.259) |
| 4 | 0 | 4 | POINT (529320.675 181007.872) |
<script>
  const buttonEl =
    document.querySelector('#df-149da3d4-d8f5-4e15-82d9-0a5e55507ee2 button.colab-df-convert');
  buttonEl.style.display =
    google.colab.kernel.accessAllowed ? 'block' : 'none';

  async function convertToInteractive(key) {
    const element = document.querySelector('#df-149da3d4-d8f5-4e15-82d9-0a5e55507ee2');
    const dataTable =
      await google.colab.kernel.invokeFunction('convertToInteractive',
                                                [key], {});
    if (!dataTable) return;

    const docLinkHtml = 'Like what you see? Visit the ' +
      '<a target="_blank" href=https://colab.research.google.com/notebooks/data_table.ipynb>data table notebook</a>'
      + ' to learn more about interactive tables.';
    element.innerHTML = '';
    dataTable['output_type'] = 'display_data';
    await google.colab.output.renderOutput(dataTable, element);
    const docLink = document.createElement('div');
    docLink.innerHTML = docLinkHtml;
    element.appendChild(docLink);
  }
</script>
<svg xmlns=“http://www.w3.org/2000/svg” height="24px"viewBox=“0 0 24 24”
width=“24px”>
cases.crs #This returns you the crs
<Projected CRS: EPSG:27700>
Name: OSGB36 / British National Grid
Axis Info [cartesian]:
- E[east]: Easting (metre)
- N[north]: Northing (metre)
Area of Use:
- name: United Kingdom (UK) - offshore to boundary of UKCS within 49°45'N to 61°N and 9°W to 2°E; onshore Great Britain (England, Wales and Scotland). Isle of Man onshore.
- bounds: (-9.01, 49.75, 2.01, 61.01)
Coordinate Operation:
- name: British National Grid
- method: Transverse Mercator
Datum: Ordnance Survey of Great Britain 1936
- Ellipsoid: Airy 1830
- Prime Meridian: Greenwich
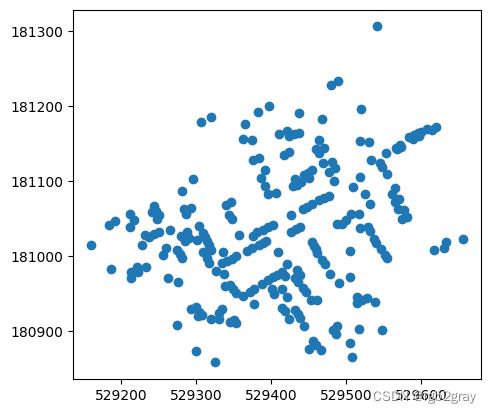
cases.plot() #This returns you a map of all the cases
<Axes: >
pump.crs
<Projected CRS: EPSG:27700>
Name: OSGB36 / British National Grid
Axis Info [cartesian]:
- E[east]: Easting (metre)
- N[north]: Northing (metre)
Area of Use:
- name: United Kingdom (UK) - offshore to boundary of UKCS within 49°45'N to 61°N and 9°W to 2°E; onshore Great Britain (England, Wales and Scotland). Isle of Man onshore.
- bounds: (-9.01, 49.75, 2.01, 61.01)
Coordinate Operation:
- name: British National Grid
- method: Transverse Mercator
Datum: Ordnance Survey of Great Britain 1936
- Ellipsoid: Airy 1830
- Prime Meridian: Greenwich
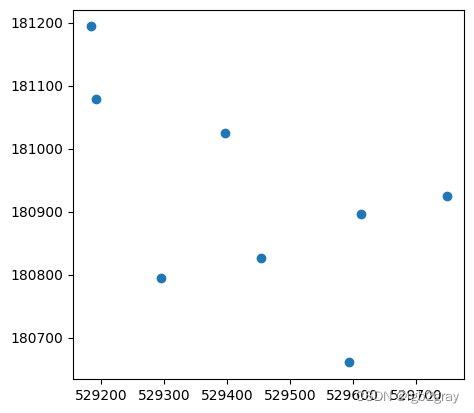
pump.plot()
<Axes: >
步骤 3
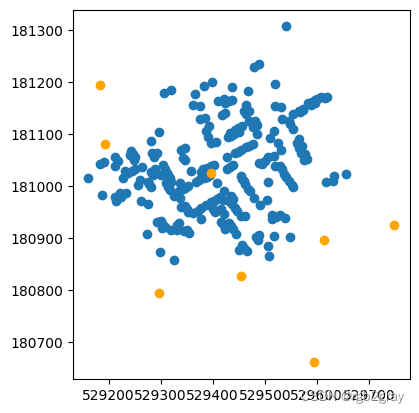
制作一个简单的地图,覆盖带有泵的案例
ax = cases.plot() #First we need to create an axis

pump.plot(ax=ax,color="orange") #Then plot the pumps using thes previously created axis as a parameter in the `plot()`
<Axes: >
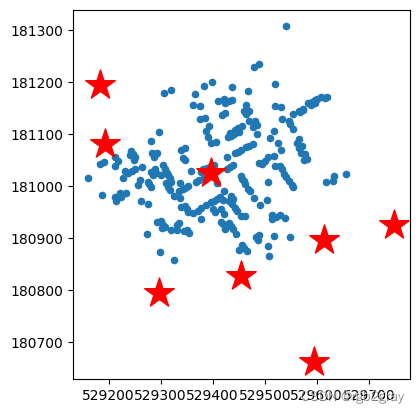
ax = cases.plot(markersize = 20)
#Check out here for differernt shapes of the markers:
#https://matplotlib.org/api/markers_api.html

pump.plot(ax=ax,markersize=500,marker="*",color="red")
<Axes: >
步骤4
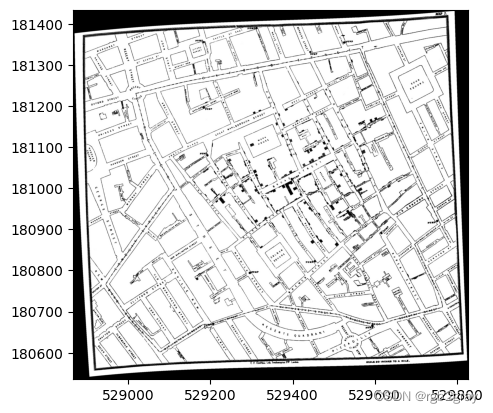
使用 rasterio 读取 TIF 底图“SnowGIS/SnowMap.tif”
basemap = rasterio.open('https://raw.githubusercontent.com/Ziqi-Li/GEO4162C/main/data/SnowGIS/SnowMap.tiff')

show(basemap)
<Axes: >
步骤 5
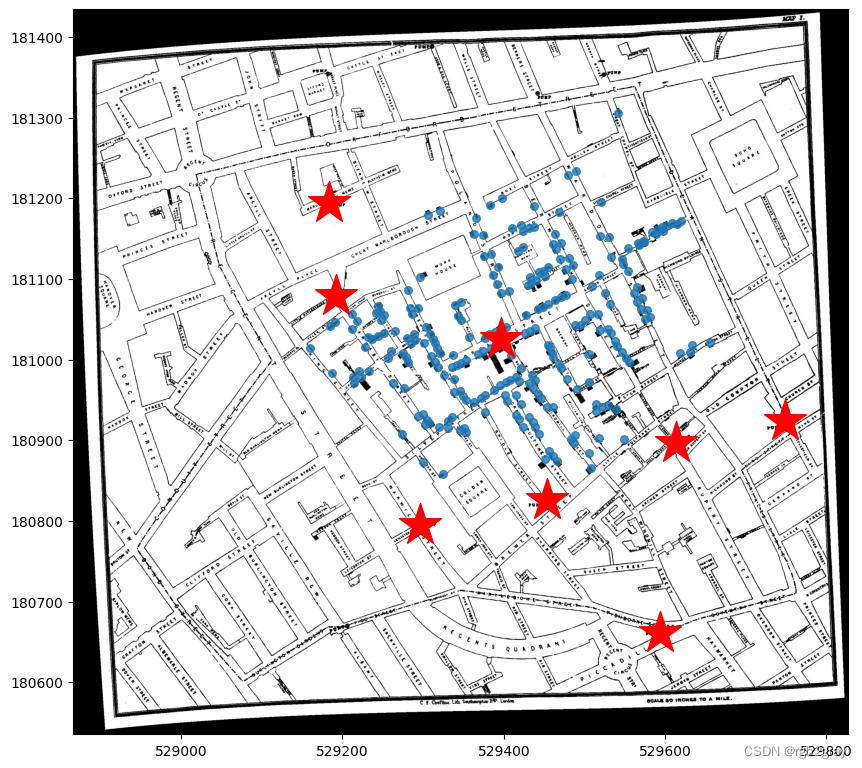
将地图叠加在一起
#First we create a figure with a size of (10,10)
f, ax = plt.subplots(figsize=(10,10))

#Plot each layer, with the same axis `ax`
show(basemap,ax=ax)

cases.plot(ax=ax, markersize = 30, alpha=0.8)
pump.plot(ax=ax,markersize=1000, marker="*",color="red")
<Axes: >
步骤 6
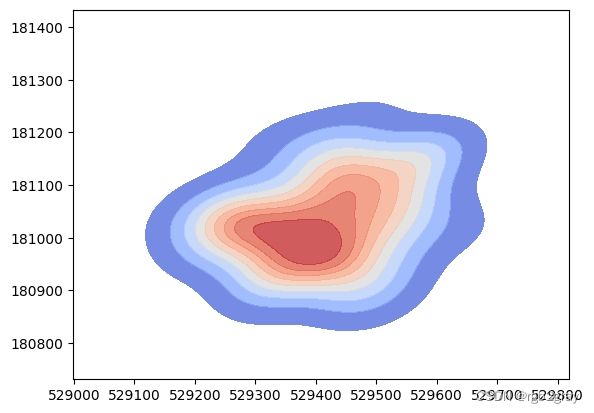
执行核密度估计(KDE)
函数 sns.kdeplot() 有几个参数:
-
- GeoDataFrame
cases
- GeoDataFrame
-
- x 和 y 坐标,我们可以从 GeoDataFrame 中提取为
cases.geometry.x和cases.geometry.y
- x 和 y 坐标,我们可以从 GeoDataFrame 中提取为
-
bw_method是 KDE 的带宽。
- 4.
fill参数表示你想要计数图还是填充色图 - 5.
cmap参数表示您要使用的颜色 -
alpha参数表示透明度的级别。
基本上 4、5、6 是您可以更改的样式参数。
执行 KDE 的代码是:
sns.kdeplot(data=cases,
            x=cases.geometry.x,
            y=cases.geometry.y,
            bw_method=0.5,
            fill=True,
            cmap="coolwarm",
            alpha=0.8)
<Axes: >
让我们将 kde 覆盖在我们的地图上。 请注意,您需要指定要在与其余地图相同的轴上绘制的 kdeplot。 所以我们需要在sns.kdeplot(ax=ax,...)中添加ax=ax。
f, ax = plt.subplots(figsize=(10,10))
show(basemap,ax=ax)
cases.plot(ax=ax, markersize = 50)
pump.plot(ax=ax,markersize=1000,marker="*",color="red")

#4th layer
sns.kdeplot(ax=ax, data=cases,
            x=cases.geometry.x,
            y=cases.geometry.y,
            bw_method=0.5,
            fill=True,
            cmap="coolwarm",
            alpha=0.6)
<Axes: >
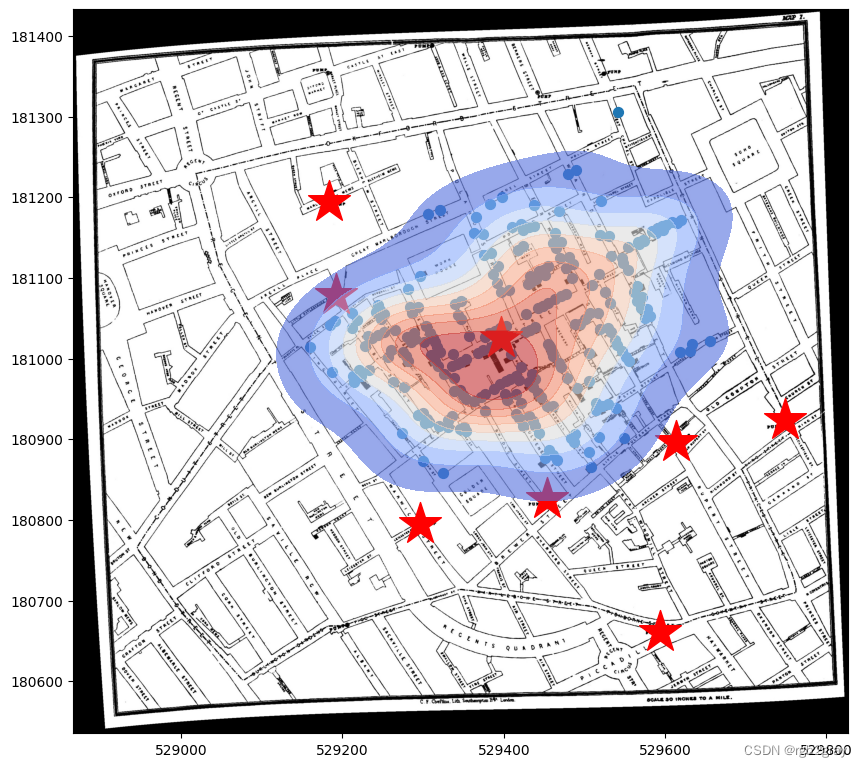
我们可以看到热点中心与中央泵对齐得很好!
sns.kdeplot() 中的另一个重要参数是有一个 weights 参数,您可以使用它根据每个位置的案例数量来权衡您的位置。
- 首先让我们回顾一下 GeoDataFrame 的情况,我们发现有一列名为“Count”。
- 然后,让我们使用这个“Count”作为 KDE 中的权重。 为此,请将“weights=cases.Count”添加到现有的 kde 函数中
cases.head()
| Id | Count | geometry | |
|---|---|---|---|
| 0 | 0 | 3 | POINT (529308.741 181031.352) |
| 1 | 0 | 2 | POINT (529312.164 181025.172) |
| 2 | 0 | 1 | POINT (529314.382 181020.294) |
| 3 | 0 | 1 | POINT (529317.380 181014.259) |
| 4 | 0 | 4 | POINT (529320.675 181007.872) |
<script>
  const buttonEl =
    document.querySelector('#df-fc93c370-9178-4d6b-a535-1aca6b1bd379 button.colab-df-convert');
  buttonEl.style.display =
    google.colab.kernel.accessAllowed ? 'block' : 'none';

  async function convertToInteractive(key) {
    const element = document.querySelector('#df-fc93c370-9178-4d6b-a535-1aca6b1bd379');
    const dataTable =
      await google.colab.kernel.invokeFunction('convertToInteractive',
                                                [key], {});
    if (!dataTable) return;

    const docLinkHtml = 'Like what you see? Visit the ' +
      '<a target="_blank" href=https://colab.research.google.com/notebooks/data_table.ipynb>data table notebook</a>'
      + ' to learn more about interactive tables.';
    element.innerHTML = '';
    dataTable['output_type'] = 'display_data';
    await google.colab.output.renderOutput(dataTable, element);
    const docLink = document.createElement('div');
    docLink.innerHTML = docLinkHtml;
    element.appendChild(docLink);
  }
</script>
<svg xmlns=“http://www.w3.org/2000/svg” height="24px"viewBox=“0 0 24 24”
width=“24px”>
f, ax = plt.subplots(figsize=(10,10))
show(basemap,ax=ax,adjust=None)
cases.plot(ax=ax, markersize = 50,column="Count")
pump.plot(ax=ax,markersize=1000,marker="*",color="red")

sns.kdeplot(ax=ax,data=cases, x=cases.geometry.x, y=cases.geometry.y, bw_method=0.5, fill=True,
            cmap="coolwarm",alpha=0.8,weights=cases.Count)

plt.tight_layout()

plt.savefig('choloera.png',dpi=600)
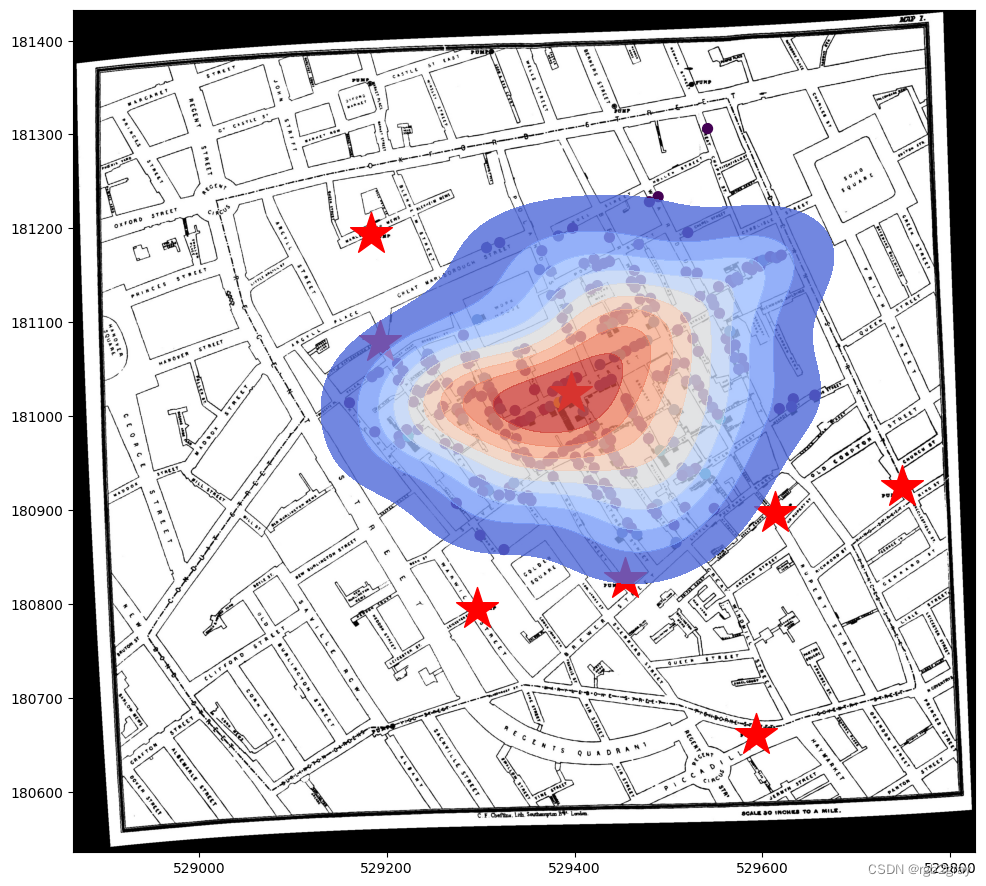
你能找到什么? 基本上 KDE 最热点正好指向中央泵! 如果 John Snow 博士能够进行 KDE,他的生活会变得更轻松吗?
添加底图
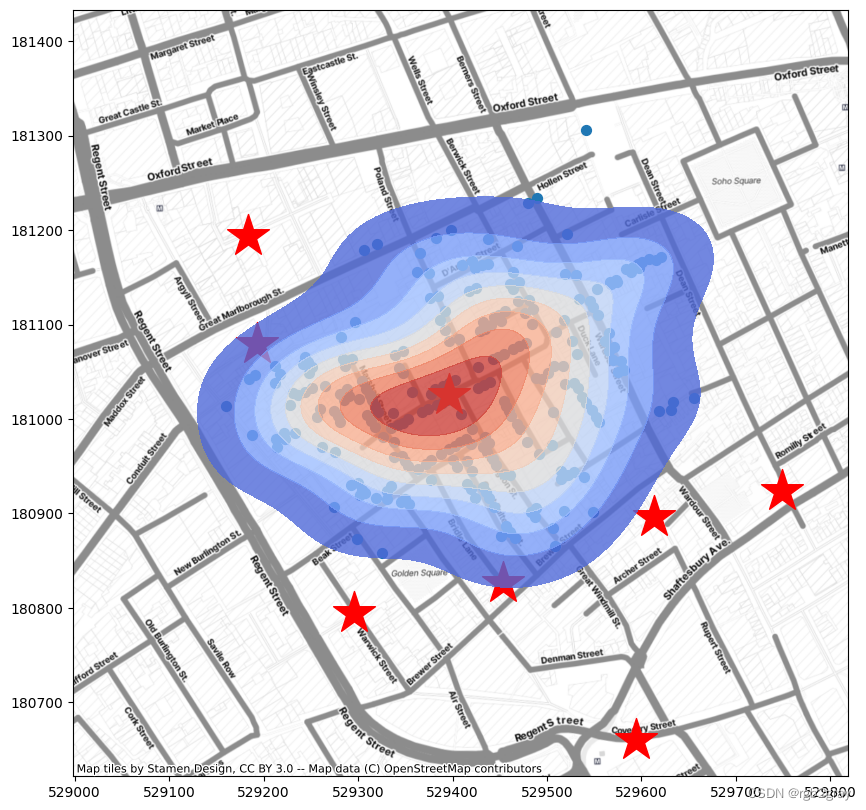
在这里,我添加了一小节关于使用“contextily”包将底图添加到绘图中的内容,这在大多数情况下非常有用,当我们没有另一个底图作为参考/提供必要的上下文时。
contextily 在 Google Colab 中不可用,所以我们需要在这里安装它。
pip install -q contextily
import contextily as cx
f, ax = plt.subplots(figsize=(10,10))

cases.plot(ax=ax, markersize = 50, figsize=(9,9))
pump.plot(ax=ax,markersize=1000,marker="*",color="red")
sns.kdeplot(ax=ax,data=cases, x=cases.geometry.x, y=cases.geometry.y, bw_method=0.5, fill=True,
            cmap="coolwarm",alpha=0.8,weights=cases.Count)

#This is the new line of code:
#We need to put a crs into the function.
#The source defines the style of the base map: https://contextily.readthedocs.io/en/latest/providers_deepdive.html
#There are many options available.
cx.add_basemap(ax, source=cx.providers.Stamen.TonerLite, crs=cases.crs) # we need to put a crs into the function.
步骤 7
最近邻分析
下一节我们将使用距离函数和显着性检验进行最近邻分析。 这可以在很棒的“pointpats”包中轻松完成。
首先,让我们从“cases”GeoDataFrame 中提取 x 和 y 坐标,并将它们作为二维数组。
x = cases.geometry.x.values
y = cases.geometry.y.values

points = np.array(list(zip(x,y)))
其次,让我们使用点创建一个“PointPattern()”类
pp = PointPattern(points)
/usr/local/lib/python3.10/dist-packages/libpysal/cg/shapes.py:1492: FutureWarning: Objects based on the `Geometry` class will deprecated and removed in a future version of libpysal.
  warnings.warn(dep_msg, FutureWarning)
/usr/local/lib/python3.10/dist-packages/libpysal/cg/shapes.py:1208: FutureWarning: Objects based on the `Geometry` class will deprecated and removed in a future version of libpysal.
  warnings.warn(dep_msg, FutureWarning)
pp
<pointpats.pointpattern.PointPattern at 0x7d59d1a5f010>
“knn”函数将返回每个点的最近邻居以及到该邻居的距离。
接下来,让我们生成 100 个 CSR(每个都是泊松过程)作为我们的空基准。 请记住,这将是我们进行显着性检验的置信区间。
CSRs = PoissonPointProcess(pp.window, pp.n, 100, asPP=True) # simulate CSR 100 times
/usr/local/lib/python3.10/dist-packages/libpysal/cg/shapes.py:1923: FutureWarning: Objects based on the `Geometry` class will deprecated and removed in a future version of libpysal.
  warnings.warn(dep_msg, FutureWarning)
/usr/local/lib/python3.10/dist-packages/libpysal/cg/shapes.py:103: FutureWarning: Objects based on the `Geometry` class will deprecated and removed in a future version of libpysal.
  warnings.warn(dep_msg, FutureWarning)
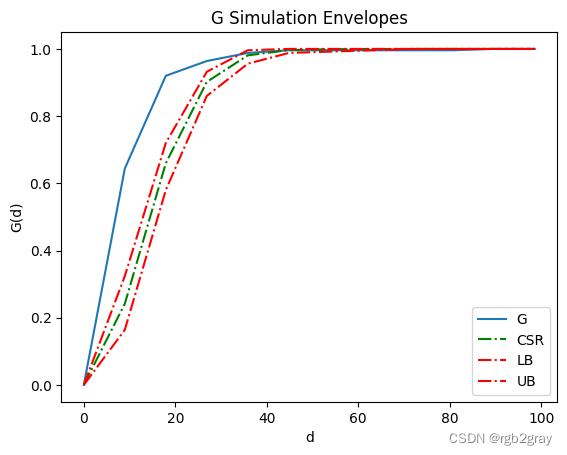
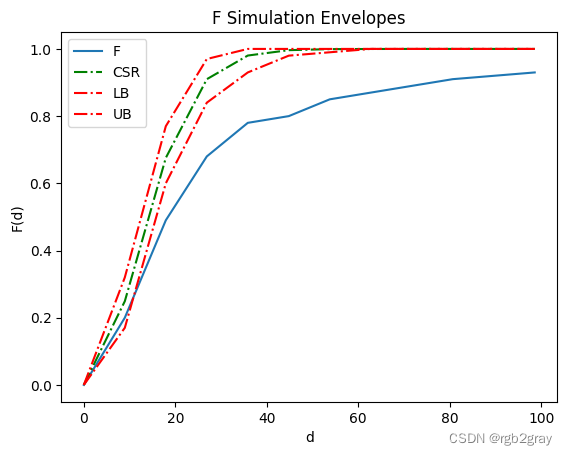
运行 G 距离 stats.Genv() 函数并将其可视化。
它显示 G 曲线高于置信包络线(红色曲线),表明我们在霍乱图中观察到聚集模式。
genv = stats.Genv(pp, realizations=CSRs)

genv.plot()
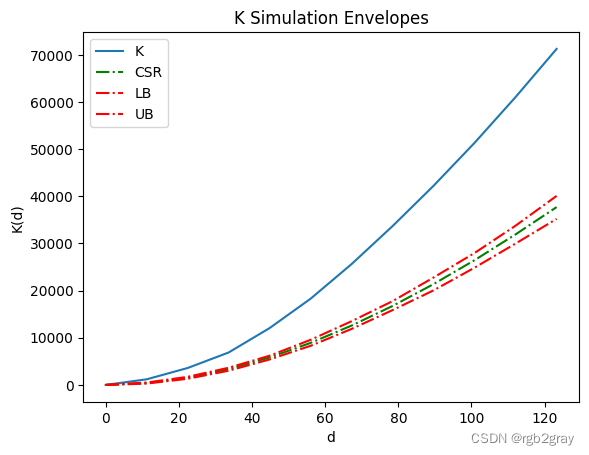
您还可以轻松执行 K 或 F 距离函数。 同样,K 曲线高于置信包络线(红色曲线),表明我们在霍乱地图中观察到聚集模式。
kenv = stats.Kenv(pp, realizations=CSRs) # call Fenv for F function
kenv.plot()
F 曲线低于置信包络线(红色曲线),表明我们在霍乱地图中观察到聚集模式。
import warnings
warnings.filterwarnings('ignore')
fenv = stats.Fenv(pp, realizations=CSRs) # call Fenv for F function
fenv.plot()


![[JavaScript前端开发及实例教程]计算器井字棋游戏的实现](https://img-blog.csdnimg.cn/direct/804b8bb6e4b24943902549628f13f05a.png)
