资源、源码来自于B站@黑马pink老师
让我们一起来学习吧!!!
链接:https://pan.baidu.com/s/1B7jS-8ZWdYabA9JKqFPpRw
提取码:6666
项目演示视频
1.初始化项目
我们的适配方案选择用flex布局+rem单位来做。使用flexible插件来更简便的实现响应式布局。使用less来完成css样式的编写。
/* 初始化 */
* {
  margin: 0;
  padding: 0;
  box-sizing: border-box;
}

li {
  list-style: none;
}

@font-face {
  font-family: electronicFont;
  src: url(../font/DS-DIGIT.TTF);
}

/* 背景设置 */
body {
  background: url("/images/bg.jpg") no-repeat top center;
  line-height: 1.15;
}

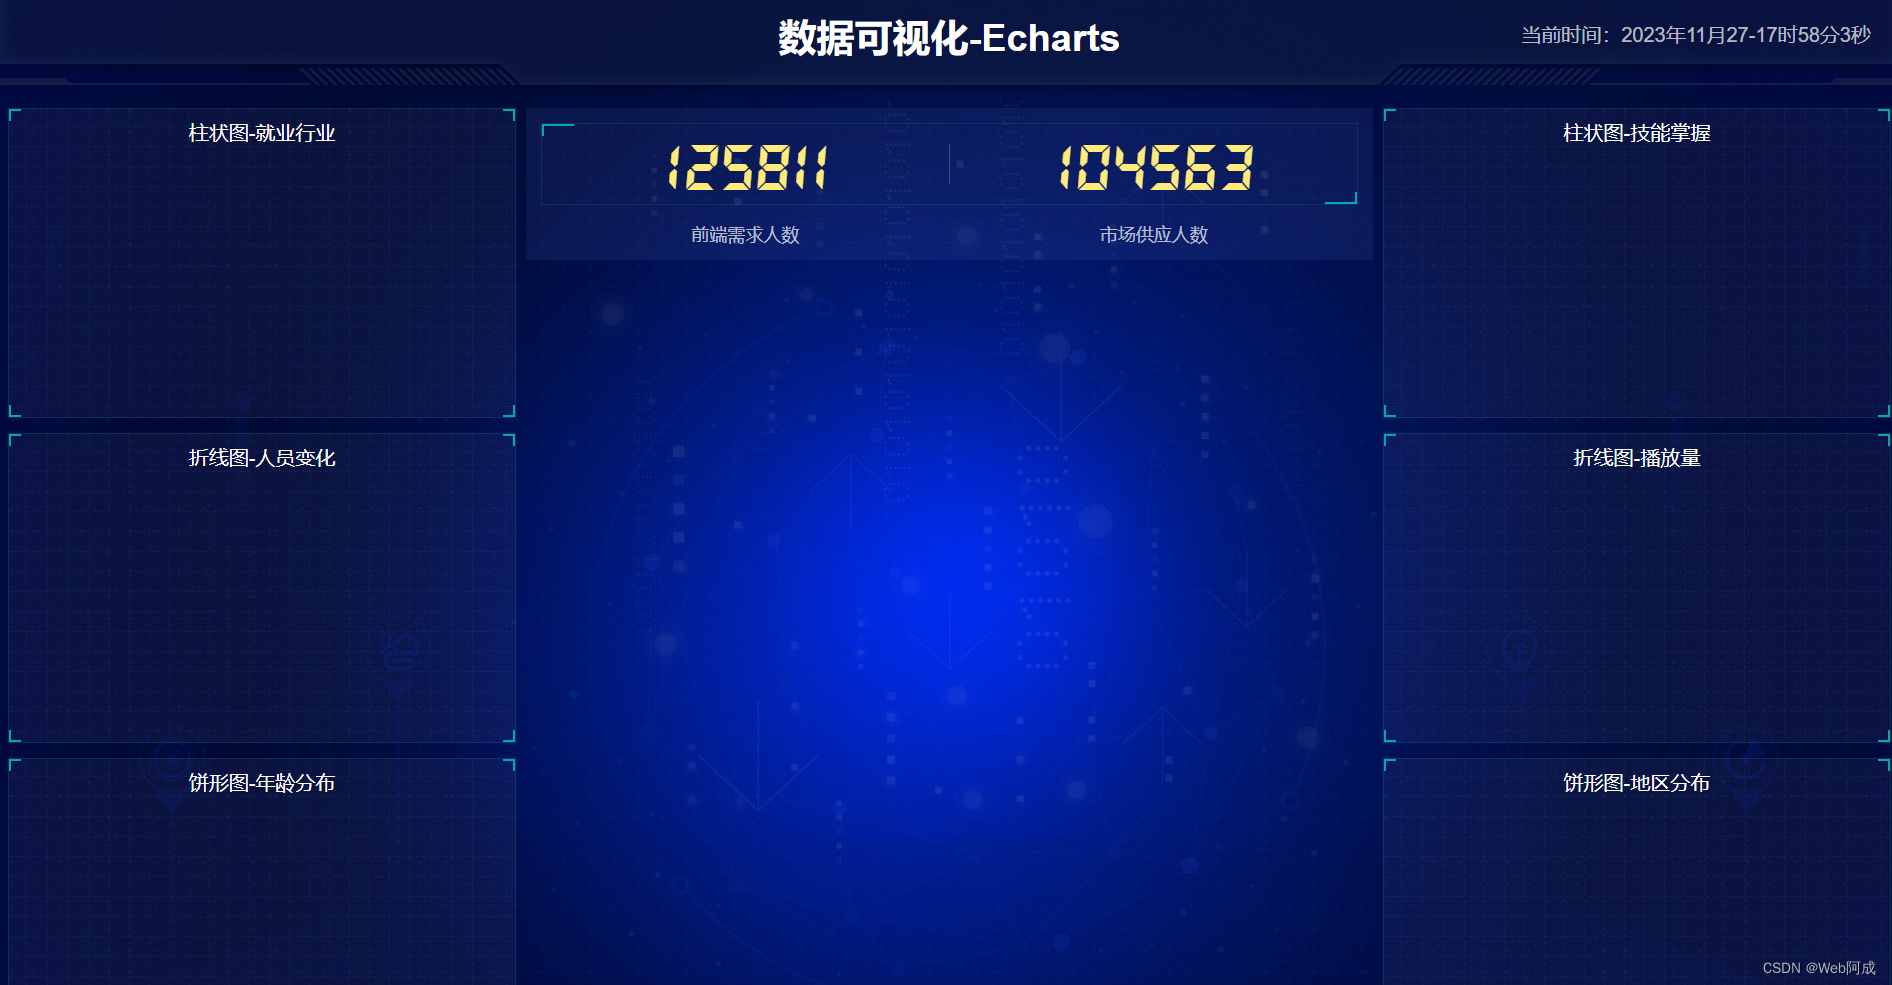
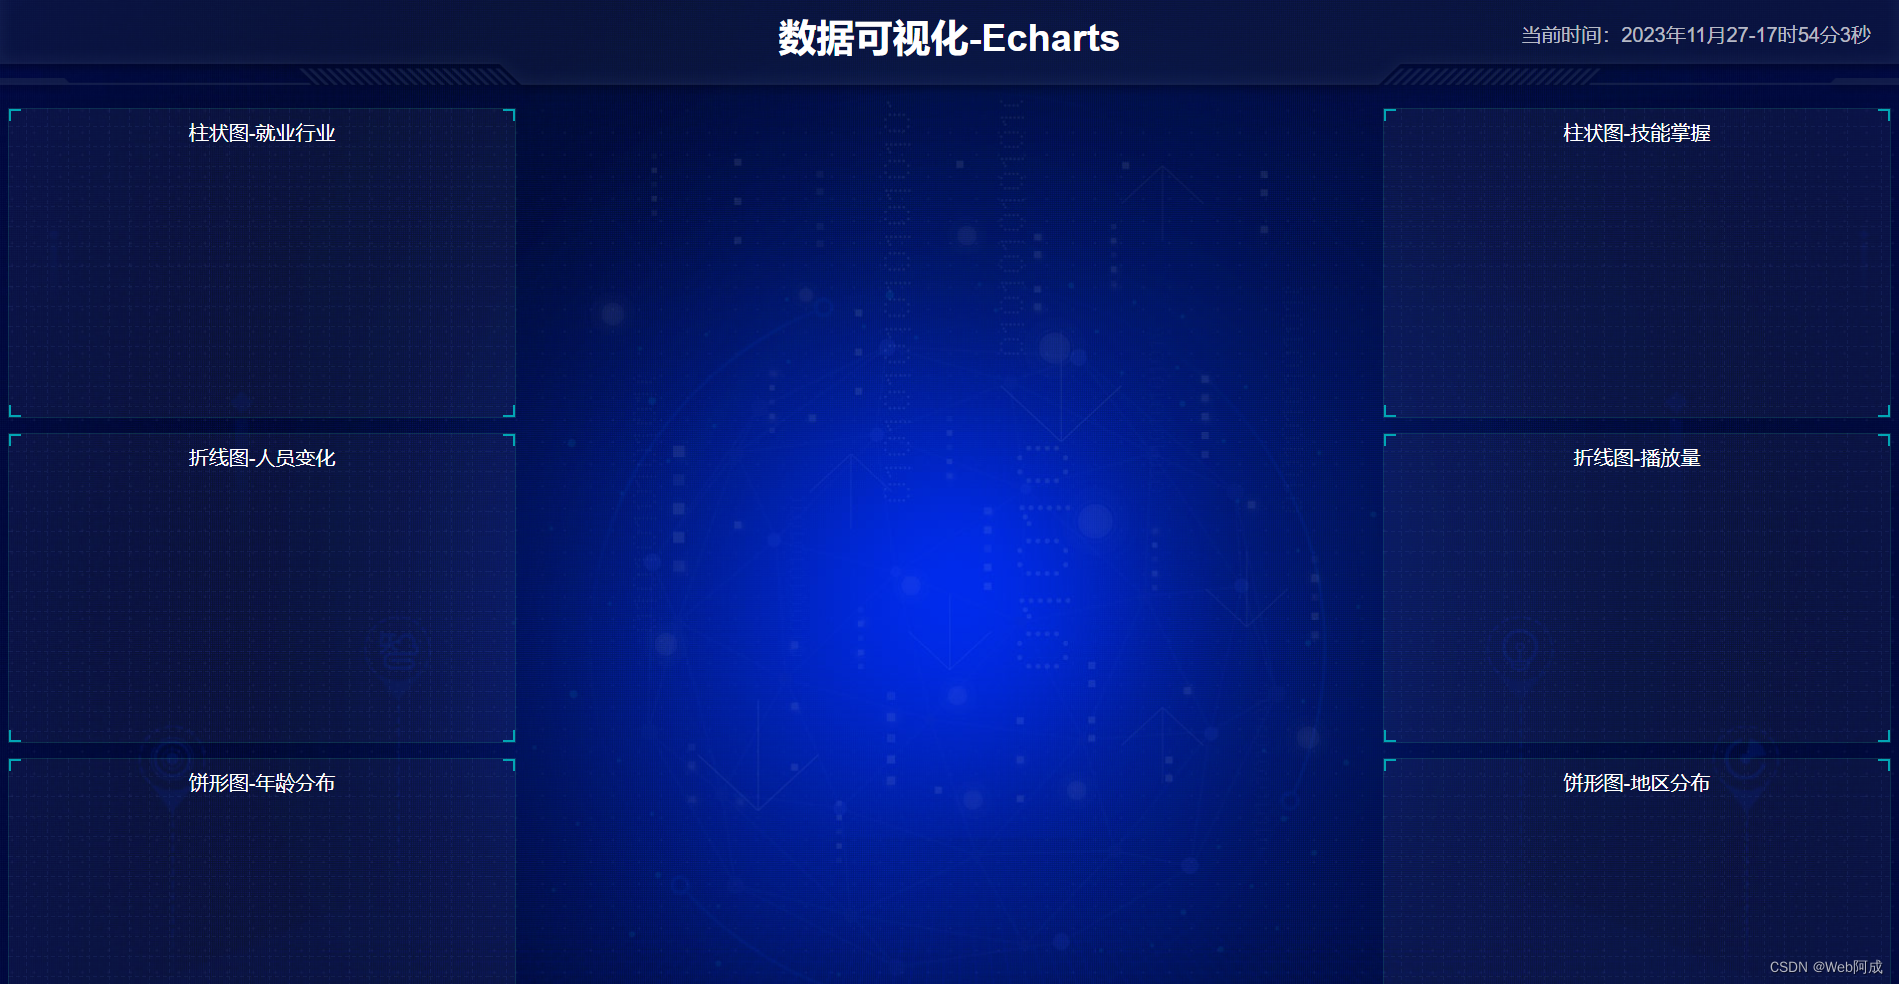
整个项目我们不难发现,应该是上下结构的,下面模块里又分为了三列模块,所以我们主要的布局思路就是 上下结构 然后细致的拆分下面的结构。
2. 头部模块(标题+右侧时间)
HTML
<header>
   <h1>数据可视化-Echarts</h1>
   <div class="showTime"></div>
</header>
CSS
CSS上就是简单的使用定位来固定住右边时间的时间位置。
header {
  position: relative;
  height: 1.25rem;
  background: url(../images/head_bg.png) no-repeat top center;
  background-size: 100% 100%;

  h1 {
    font-size: 0.475rem;
    color: #fff;
    text-align: center;
    line-height: 1rem;
  }

  .showTime {
    position: absolute;
    top: 0;
    right: 0.375rem;
    line-height: 0.9375rem;
    font-size: 0.25rem;
    color: rgba(255, 255, 255, 0.7);
  }
}
JS
<script>
   var t = null;
   t = setTimeout(time, 1000); //開始运行
   function time() {
     clearTimeout(t); //清除定时器
     dt = new Date();
     var y = dt.getFullYear();
     var mt = dt.getMonth() + 1;
     var day = dt.getDate();
     var h = dt.getHours(); //获取时
     var m = dt.getMinutes(); //获取分
     var s = dt.getSeconds(); //获取秒
     document.querySelector(".showTime").innerHTML =
       "当前时间:" +
       y +
       "年" +
       mt +
       "月" +
       day +
       "-" +
       h +
       "时" +
       m +
       "分" +
       s +
       "秒";
     t = setTimeout(time, 1000); //设定定时器,循环运行
   }
</script>
3. 下部模块
我们按照之前的思路,下部模块排为三列。
HTML
<section class="mainbox">
   <div class="column"></div>
   <div class="column"></div>
   <div class="column"></div>
 </section>
CSS
因为我们第二列的占宽是比较高得,所以我们用伪类单独将第二列列宽设宽一些。
.mainbox {
  min-width: 1024px;
  max-width: 1920px;
  padding: 0.125rem 0.125rem 0;
  display: flex;
  color: white;
  .column {
    flex: 3;

    &:nth-child(2) {
      flex: 5;
      margin: 0 0.125rem 0.1875rem;
      overflow: hidden;
    }
  }
}
4.图表模块
HTML
    <section class="mainbox">
      <div class="column">
        <div class="panel bar">
          <h2>
            柱状图-就业行业
          </h2>
          <div class="chart"></div>
          <div class="panel-footer"></div>
        </div>
        <div class="panel line">
          <h2>折线图-人员变化</h2>
          <div class="chart"></div>
          <div class="panel-footer"></div>
        </div>
        <div class="panel pie">
          <h2>饼形图-年龄分布</h2>
          <div class="chart"></div>
          <div class="panel-footer"></div>
        </div>
      </div>
      <div class="column"></div>
      <div class="column">
        <div class="panel bar1">
          <h2>柱状图-技能掌握</h2>
          <div class="chart"></div>
          <div class="panel-footer"></div>
        </div>
        <div class="panel line1">
          <h2>折线图-播放量</h2>
          <div class="chart"></div>
          <div class="panel-footer"></div>
        </div>
        <div class="panel pie1">
          <h2>饼形图-地区分布</h2>
          <div class="chart"></div>
          <div class="panel-footer"></div>
        </div>
      </div>
    </section>
CSS
图表模块中,我们需要使用定位的方式来做四个角的样式。
.panel {
  position: relative;
  height: 3.875rem;
  border: 1px solid rgba(25, 186, 139, 0.17);
  background: rgba(255, 255, 255, 0.04) url(../images/line\(1\).png);
  padding: 0 0.1875rem 0.5rem;
  margin-bottom: 0.1875rem;

  &::before {
    position: absolute;
    top: 0;
    left: 0;
    content: "";
    width: 10px;
    height: 10px;
    border-top: 2px solid #02a6b5;
    border-left: 2px solid #02a6b5;
  }

  &::after {
    position: absolute;
    top: 0;
    right: 0;
    content: "";
    width: 10px;
    height: 10px;
    border-top: 2px solid #02a6b5;
    border-right: 2px solid #02a6b5;
  }

  .panel-footer {
    position: absolute;
    left: 0;
    bottom: 0;
    width: 100%;

    &::before {
      position: absolute;
      bottom: 0;
      left: 0;
      content: "";
      width: 10px;
      height: 10px;
      border-bottom: 2px solid #02a6b5;
      border-left: 2px solid #02a6b5;
    }

    &::after {
      position: absolute;
      bottom: 0;
      right: 0;
      content: "";
      width: 10px;
      height: 10px;
      border-bottom: 2px solid #02a6b5;
      border-right: 2px solid #02a6b5;
    }
  }

  h2 {
    height: 0.6rem;
    line-height: 0.6rem;
    text-align: center;
    color: #fff;
    font-size: 0.25rem;
    font-weight: 400;

    a {
      margin: 0 0.1875rem;
      color: #fff;
      text-decoration: underline;
    }
  }

  .chart {
    height: 3rem;
  }
}
5.中间列
根据原图效果,中间列的布局应该是上下的。
HTML
    <section class="mainbox">
      <div class="column">
        <div class="panel bar">
          <h2>柱状图-就业行业</h2>
          <div class="chart"></div>
          <div class="panel-footer"></div>
        </div>
        <div class="panel line">
          <h2>折线图-人员变化</h2>
          <div class="chart"></div>
          <div class="panel-footer"></div>
        </div>
        <div class="panel pie">
          <h2>饼形图-年龄分布</h2>
          <div class="chart"></div>
          <div class="panel-footer"></div>
        </div>
      </div>
      <div class="column">
        <div class="no">
          <div class="no-hd">
            <ul>
              <li>125811</li>
              <li>104563</li>
            </ul>
          </div>
          <div class="no-bd">
            <ul>
              <li>前端需求人数</li>
              <li>市场供应人数</li>
            </ul>
          </div>
        </div>
        <div class="map">
          <div class="chart"></div>
          <div class="map1"></div>
          <div class="map2"></div>
          <div class="map3"></div>
        </div>
      </div>
      <div class="column">
        <div class="panel bar1">
          <h2>柱状图-技能掌握</h2>
          <div class="chart"></div>
          <div class="panel-footer"></div>
        </div>
        <div class="panel line1">
          <h2>折线图-播放量</h2>
          <div class="chart"></div>
          <div class="panel-footer"></div>
        </div>
        <div class="panel pie1">
          <h2>饼形图-地区分布</h2>
          <div class="chart"></div>
          <div class="panel-footer"></div>
        </div>
      </div>
    </section>
CSS
.no {
  background: rgba(101, 132, 226, 0.1);
  padding: 0.1875rem;

  .no-hd {
    position: relative;
    border: 1px solid rgba(25, 186, 139, 0.17);

    &::before {
      content: "";
      position: absolute;
      width: 30px;
      height: 10px;
      border-top: 2px solid #02a6b5;
      border-left: 2px solid #02a6b5;
      top: 0;
      left: 0;
    }

    &::after {
      content: "";
      position: absolute;
      width: 30px;
      height: 10px;
      border-bottom: 2px solid #02a6b5;
      border-right: 2px solid #02a6b5;
      right: 0;
      bottom: 0;
    }

    ul {
      display: flex;

      li {
        position: relative;
        flex: 1;
        text-align: center;
        height: 1rem;
        line-height: 1rem;
        font-size: 0.875rem;
        color: #ffeb7b;
        padding: 0.05rem 0;
        font-family: electronicFont;
        font-weight: bold;

        &:first-child::after {
          content: "";
          position: absolute;
          height: 50%;
          width: 1px;
          background: rgba(255, 255, 255, 0.2);
          right: 0;
          top: 25%;
        }
      }
    }
  }

  .no-bd ul {
    display: flex;

    li {
      flex: 1;
      height: 0.5rem;
      line-height: 0.5rem;
      text-align: center;
      font-size: 0.225rem;
      color: rgba(255, 255, 255, 0.7);
      padding-top: 0.125rem;
    }
  }
}