import matplotlib.pyplot as plt
import numpy as np

# 创建数据
x = np.linspace(0, 10, 100)
y1 = np.sin(x)
y2 = np.cos(x)
y3 = np.tan(x)
y4 = np.exp(x)

# 创建一个2x2的子图网格
# fig = plt.figure()
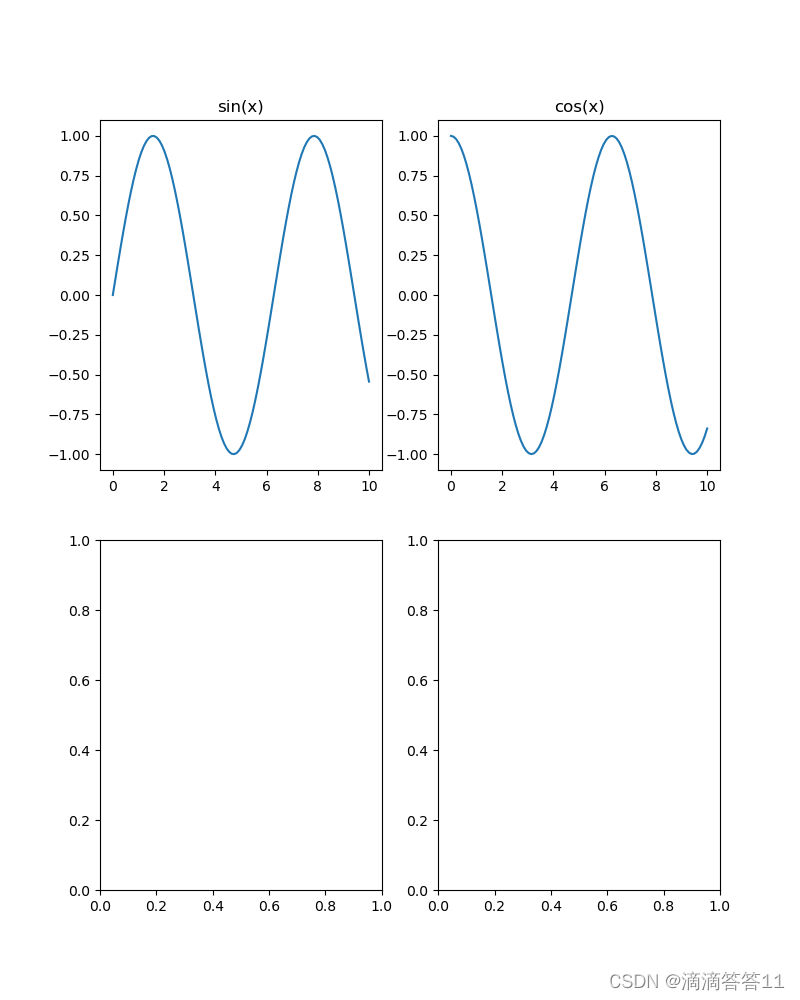
fig,((ax1, ax2), (ax3, ax4)) = plt.subplots(nrows=2, ncols=2, figsize=(8, 10))
# 第一行第一列的子图
# ax1 = fig.add_subplot(221)  # 2行2列的第一个图,前面的2表示行数,2表示列数,后面的1表示这个位置是第几个图
ax1.plot(x, y1)
ax1.set_title('sin(x)')

# 第一行第二列的子图
# ax2 = fig.add_subplot(222)  # 2行2列的第二个图
ax2.plot(x, y2)
ax2.set_title('cos(x)')
plt.show() #只显示第一个plt.show()
# 第二行第一列的子图
# ax3 = fig.add_subplot(223)  # 2行2列的第三个图
ax3.plot(x, y3)
ax3.set_title('tan(x)')
plt.show()
# 第二行第二列的子图
# ax4 = fig.add_subplot(224)  # 2行2列的第四个图
ax4.plot(x, y4)
ax4.set_title('exp(x)')

# 显示图像
plt.show()


![[图片来源BZhan]最小生成树(Prim➕Kruskal)、最短路径(Dijkstra➕Floyd)](https://img-blog.csdnimg.cn/d4a8a5c34216418391eb11f4ca93fba4.png)


![⑥【bitmap 】Redis数据类型: bitmap [使用手册]](https://img-blog.csdnimg.cn/20a7f1b58dfb4660b75d7f021c157d57.png#pic_center)