1,安装echarts
npm install echarts2,具体页面
<template>
	<view class="container notice-list">
		<view>

			<view class="aa" id="main" style="width: 500px; height: 400px;"></view>

		</view>
	</view>
</template>

<script>
	import * as echarts from 'echarts';
	export default {
		data() {
			return {
				myChart: null
			}
		},

		onShow() {

		},
		onLoad() {


		},
		onReady(){
			// 注意调用顺序,先初始化echarts才给echarts赋值
			this.initEcharts()
			this.setEchartsOption()
		},
		methods: {
			// 初始化echarts
			initEcharts() {
			    var chartDom = document.getElementById('main');
			    // 将创建的echarts示例放到vue的data中,这样在这个界面就想到于全局配置了
			    this.myChart = echarts.init(chartDom);
			},
			// 配置echarts的option,展示数据图表
			 setEchartsOption() {
			     // 这里可以发送axios请求,然后通过响应的数据赋值给对应的x轴和y轴即可,由于这里没有于后端联调,所以简单请求判断一下,
			     // 请求后端大概也是这个过程
			     var option;

			     option = {
			         tooltip: {
			             trigger: 'axis',
			             axisPointer: {
			                 type: 'shadow'
			             }
			         },
			         grid: {
			             left: '3%',
			             right: '4%',
			             bottom: '3%',
			             containLabel: true
			         },
			         xAxis: [
			             {
			                 type: 'category',
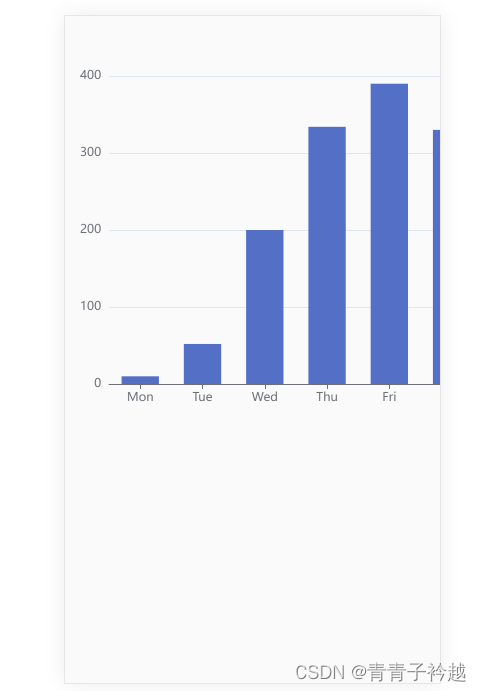
			                 data: ['Mon', 'Tue', 'Wed', 'Thu', 'Fri', 'Sat', 'Sun'],
			                 axisTick: {
			                     alignWithLabel: true
			                 }
			             }
			         ],
			         yAxis: [
			             {
			                 type: 'value'
			             }
			         ],
			         series: [
			             {
			                 name: 'Direct',
			                 type: 'bar',
			                 barWidth: '60%',
			                 data: [10, 52, 200, 334, 390, 330, 220]
			             }
			         ]
			     };

			     option && this.myChart.setOption(option);
			 },

		},

	}
</script>

<style lang="scss">

</style>
