一、介绍
这种用于自动超参数搜索进行预测的开发方法可能会花费大量时间,但它可以带来回报,因为当您找到预测模型的最佳参数时,它将节省时间并提高预测的精度。此外,手动尝试可能会花费您最多的时间,但这种方法在某些情况下可能会有所帮助,请记住,理解为什么我们应该在预测模型中使用精确的参数对于更好地理解业务问题至关重要。尽管如此,这种方法可以缩短您的探索时间并帮助您更好地理解您的问题。
在这篇博客中,我将介绍自动搜索 (S)ARIMA 预测模型关键参数的方法。我们将在 (S)ARIMA 预测模型中调整的超参数是季节性参数 (S)、自回归参数 (AR)、差分参数 (I) 和移动平均值 (MA)。如果需要,您可以在我之前的博客中阅读有关此参数的更多信息(此处)。
二、CO2 数据示例
我们将检查并绘制过去 50 年二氧化碳排放时间序列的趋势和季节性,由于冬季供暖期,我们看到了增加的趋势和清晰的季节性模式(完整代码和数据可在此处获取)。
import pandas as pd
import numpy as np
from statsmodels.tsa.seasonal import STL
import matplotlib.pyplot as plt
from statsmodels.tsa.stattools import adfuller
import statsmodels.api as sm
plt.rc('figure',figsize=(10,6))
plt.rc('font',size=13)
stl = STL(co2, seasonal=7)
res = stl.fit()
fig = res.plot()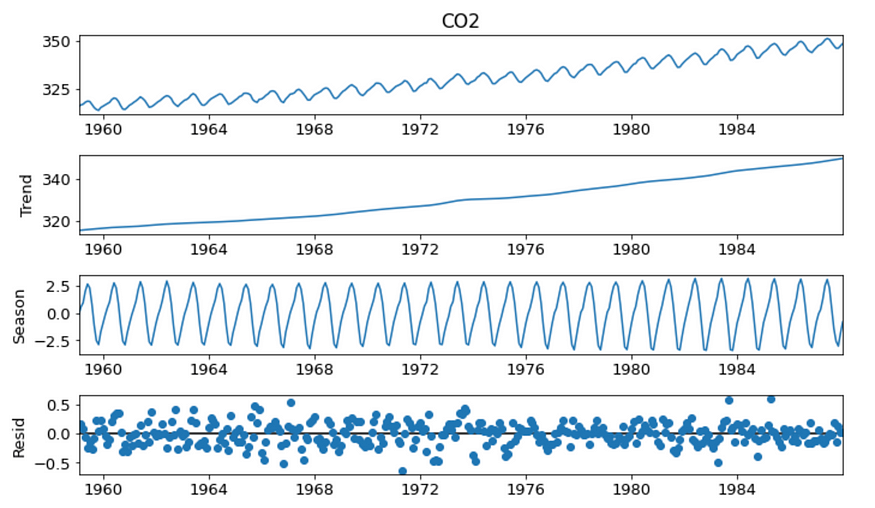
CO2数据分解
在使用创建的函数绘制差分时间序列的滚动平均值(12 个数据点)和标准差后,我们应该检查多年来二氧化碳排放量的平稳性。
def test_stationarity(timeseries, rolling=12):

    #Determing rolling statistics
    rolmean = timeseries.rolling(rolling).mean()
    rolstd = timeseries.rolling(rolling).std()

    #Plot rolling statistics:
    plt.figure(figsize=(10, 5))
    orig = plt.plot(timeseries, color='blue',label='Original')
    mean = plt.plot(rolmean, color='red', label='Rolling Mean')
    std = plt.plot(rolstd, color='black', label = 'Rolling Std')
    plt.title('Power consumption Old data')
    plt.xlabel('Time - periods(30s)')
    plt.ylabel('Power consumption in Watts')
    plt.legend(loc='best')
    plt.title('Rolling Mean & Standard Deviation')
    plt.show()


    #Perform Dickey-Fuller test:
    print ('Results of Dickey-Fuller Test:')
    dftest = adfuller(timeseries, autolag='AIC')
    dfoutput = pd.Series(dftest[0:4], index=['Test Statistic','p-value','#Lags Used','Number of Observations Used'])
    for key,value in dftest[4].items():
        dfoutput['Critical Value (%s)'%key] = value
    print (dfoutput)
    if dfoutput['p-value'] < 0.05:
        print('The time series is stationary at 95% level of confidence')
    else:
        print('The time series is not stationary at 95% level of confidence')
co2_diff = co2 - co2.shift(1)
co2_diff = co2_diff.dropna()
test_stationarity(co2_diff, rolling=12)
差分 C02 数据是平稳的。
在进行自动 arima 搜索之前,我们将检查 40 个时间点的相关图,以了解数据如何跨滞后相关,由此我们可以确认高 AR 参数以及强季节性模式(偏相关,捕获所有其他变量回归后的残差)。
fig, axes = plt.subplots(1, 2, figsize=(15,4))

fig = sm.graphics.tsa.plot_acf(co2,
                               lags=40,
                               ax=axes[0])
fig = sm.graphics.tsa.plot_pacf(co2,
                                lags=40,
                                ax=axes[1])
C02 数据的相关图。
三、自动调节
在代码的下一部分中,我们创建了 p (AR)、d(I) 和 q(MA) 参数的几种组合。为了放宽搜索范围,我们将季节性 (s) 参数定义为 12,因为我们确信存在年度模式。为了评估模型的优点,我们使用 Akaike 信息标准 (aic)。该标准对于某些数据的统计模型至关重要,通过计算 k(模型中估计参数的数量)与 L(模型似然函数的最大值)之间的差异。这意味着具有最佳 AIC 的模型将具有最佳似然值和尽可能最少的参数数量,从而使模型简单高效(简约),从而实现最佳性能。模型的AIC值如下:
AIC=2k−2ln(L)
import itertools
import warnings
warnings.filterwarnings('ignore')
# Grid Search
p = d = q = range(0,3) # p, d, and q can be either 0, 1, or 2
pdq = list(itertools.product(p,d,q)) # gets all possible combinations of p, d, and q
p2 = d2 = q2 = range(0, 2) # second set of p's, d's, and q's for seasonal parameters
pdq2 = list(itertools.product(p2,d2,q2)) # similar to code above but for seasonal parameters
s = 12 # here I use twelve but the number here is representative of the periodicity of the seasonal cycle
pdqs2 = [(c[0], c[1], c[2], s) for c in pdq2]
combs = {}
aics = []
# Grid Search Continued
for combination in pdq:
    for seasonal_combination in pdqs2:
        try:
            model = sm.tsa.statespace.SARIMAX(co2, order=combination, seasonal_order=seasonal_combination,
                                             enforce_stationarity=True,
                                             enforce_invertibility=True)
            model = model.fit(disp=False)
            combs.update({model.aic : [combination, seasonal_combination]})
            aics.append(model.aic)

        except:
            continue

best_aic = min(aics)
现在我们可以看到哪些预测超参数可以提供最佳预测。
print('best aic is: ', round(best_aic, 3))
print(40*'==')
print ('ARIMA parameters: ', '\n', 'AR: ', combs[best_aic][0][0], '\n', 'I: ',combs[best_aic][0][1], '\n', 'MA: ',combs[best_aic][0][2])
print('Seasonal parameters:', combs[best_aic][1])
自动选择的参数由最佳AIC值决定。
恭喜!有了这个超参数,我们可以进行训练测试分割并对测试集进行预测,然后比较预测和测试结果。
四、使用选定的超参数进行预测
创建train-test split函数后,我们进行实际预测:
def train_test_split(timeseries, lags_for_prediction=12):
    split=len(timeseries)-lags_for_prediction
    train=timeseries[:split]
    test=timeseries[split:]
    return train, test
train_series, test_series = train_test_split(co2, 12)
检查模型优良性的好方法是绘制预测数据与测试数据的图。在实际应用中,真正的预测将更多地涉及未来,但这一步确保我们拥有一个好的模型。
def forecasting (p,d,q, season, lags_for_forecast, train_series):

    model = sm.tsa.statespace.SARIMAX(train_series, order=(p,d,q), seasonal_order=(p,d,q,season),
                                             simple_differencing=0, #if True  time series provided as endog is literally differenced and an ARMA model is fit to the resulting new time series
                                             enforce_stationarity=True,
                                             enforce_invertibility=False)
    fitted = model.fit(disp=-1)

    # Forecast
    forecast = fitted.forecast(lags_for_forecast)

    # Plot
    plt.figure(figsize=(12,5), dpi=100)
    plt.plot(train_series, color='blue', label='train')
    plt.plot(test_series, color='green', label='test', alpha=0.6)
    plt.plot(forecast, color='red', label='forecast')
    plt.title('Forecast vs Actuals')
    plt.legend(loc='upper left', fontsize=8)
    plt.show()
    RSS=np.sqrt(sum(forecast.values-test_series.values.reshape(-1))**2)/lags_for_forecast
    print("\n", '\033[1m' +'Root Squared Error (RSS) of SARIMAX model(p,d,q)(p,d,q,s)' + '\033[0m',(p,d,q),season,':', round(RSS, 3),"\n")
    print(fitted.summary())
forecasting (2,1,1, 12, 12, train_series)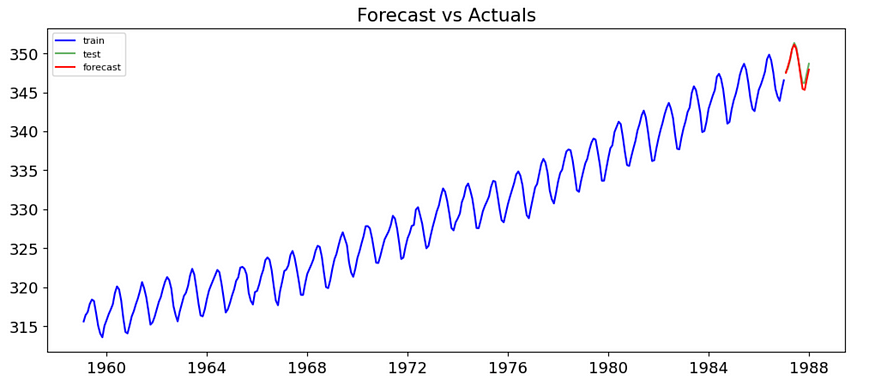
预测数据与测试数据。
正如我们所看到的,自动调整效果非常好。statsmodels 的摘要选项使我们能够更深入地了解参数的统计显着性。非常小的均方根误差 (0.313) 为我们提供了额外的保证,即我们拥有可靠且良好的模型。就这样了。在某些情况下,旧的传统 ARIMA 可以击败复杂的 LSTM :)
维托米尔·约万诺维奇

