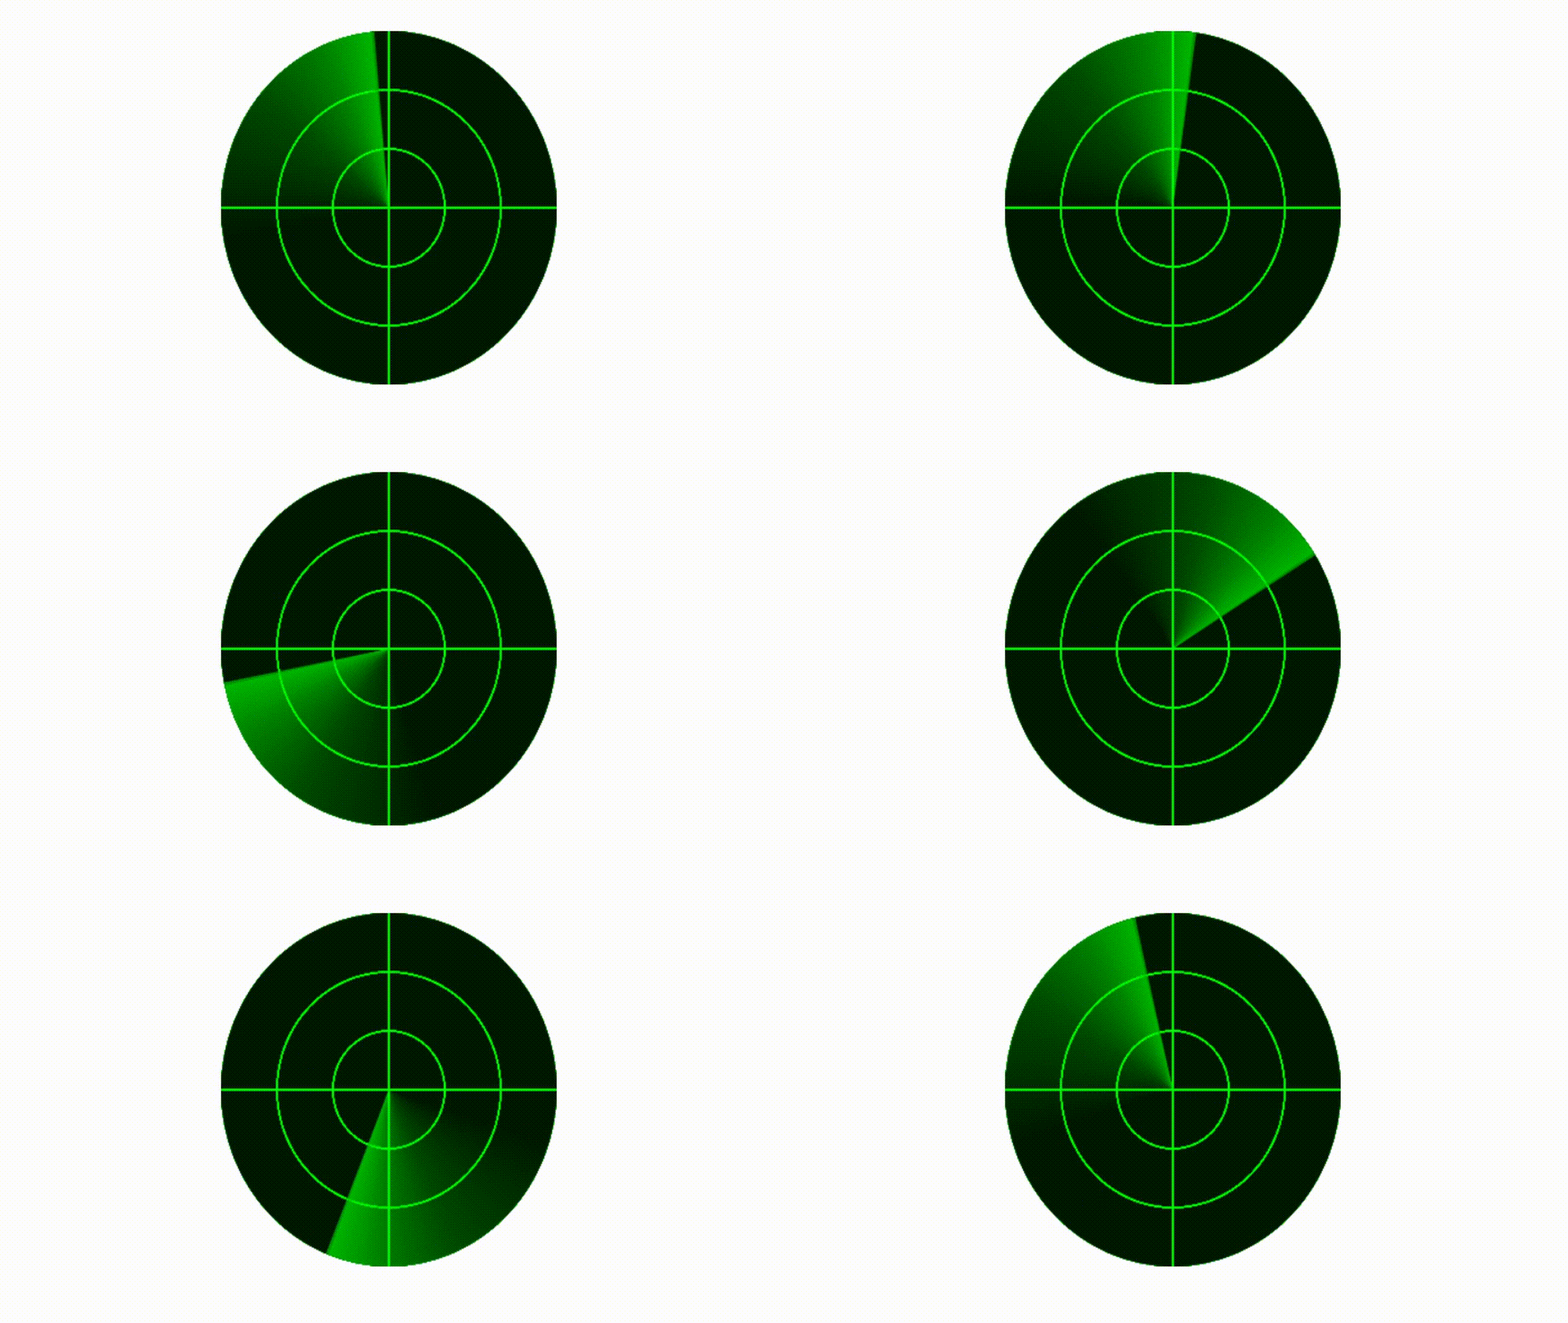
做卫星项目的时候,会涉及到雷达图,用于扫描卫星,给人形象化的感觉。以下代码为canvas实现的demo,请运行查看.
效果图
源代码
							<!DOCTYPE html>
<html lang="zh">

<head>
    <meta charset="UTF-8">
    <meta name="viewport" content="width=device-width, initial-scale=1.0">
    <meta http-equiv="X-UA-Compatible" content="ie=edge">
    <title>radar</title>
    <style>
        canvas {
            margin: 20px auto;
            display: block;
        }
    </style>
</head>

<body>
    <canvas id="can" width=300 height=300></canvas>

    <script type="text/javascript">
        var CFG = {
            perDeg: 1,
        };

        var can = document.getElementById('can');
        var ctx = can.getContext('2d');
        var deg = 0;
        ctx.strokeStyle = 'rgba(0,255,0,1)';

        function init() {
            ctx.fillStyle = 'rgba(0,50,0,1)';
            ctx.arc(150, 150, 150, 0, 2 * Math.PI);
            ctx.fill();
            var raf = window.requestAnimationFrame(loop);
        }

        function loop() {
            deg = (deg + CFG.perDeg);
            cover();
            drawPosLine();
            drawRadar(deg);
            raf = window.requestAnimationFrame(loop);
        }

        function cover() {
            ctx.save();
            ctx.fillStyle = 'rgba(0,0,0,0.02)';
            ctx.arc(150, 150, 150, 0, 2 * Math.PI);
            ctx.fill();
            ctx.restore();
        }

        function drawPosLine() {
            ctx.beginPath();
            ctx.moveTo(150, 0);
            ctx.lineTo(150, 300);
            ctx.closePath();
            ctx.stroke();

            ctx.beginPath();
            ctx.moveTo(0, 150);
            ctx.lineTo(300, 150);
            ctx.closePath();
            ctx.stroke();

            ctx.moveTo(150, 150);
            ctx.beginPath();
            ctx.arc(150, 150, 100, 0 * Math.PI, 2 * Math.PI);
            ctx.closePath();
            ctx.stroke();

            ctx.moveTo(150, 150);
            ctx.beginPath();
            ctx.arc(150, 150, 50, 0 * Math.PI, 2 * Math.PI);
            ctx.closePath();
            ctx.stroke();
        }

        function drawRadar(iDeg) {
            ctx.fillStyle = 'rgba(0,200,0,.7)';
            ctx.beginPath();
            ctx.moveTo(150, 150);
            ctx.arc(150, 150, 150, (-2 * CFG.perDeg + iDeg) / 180 * Math.PI, (0 + iDeg) / 180 * Math.PI);
            ctx.closePath();
            ctx.fill();
        }

        init();
    </script>
</body>

</html>
